Microeconomics Assignment: Government Policies and Market Analysis
VerifiedAdded on Ā 2023/04/19
|7
|734
|57
Homework Assignment
AI Summary
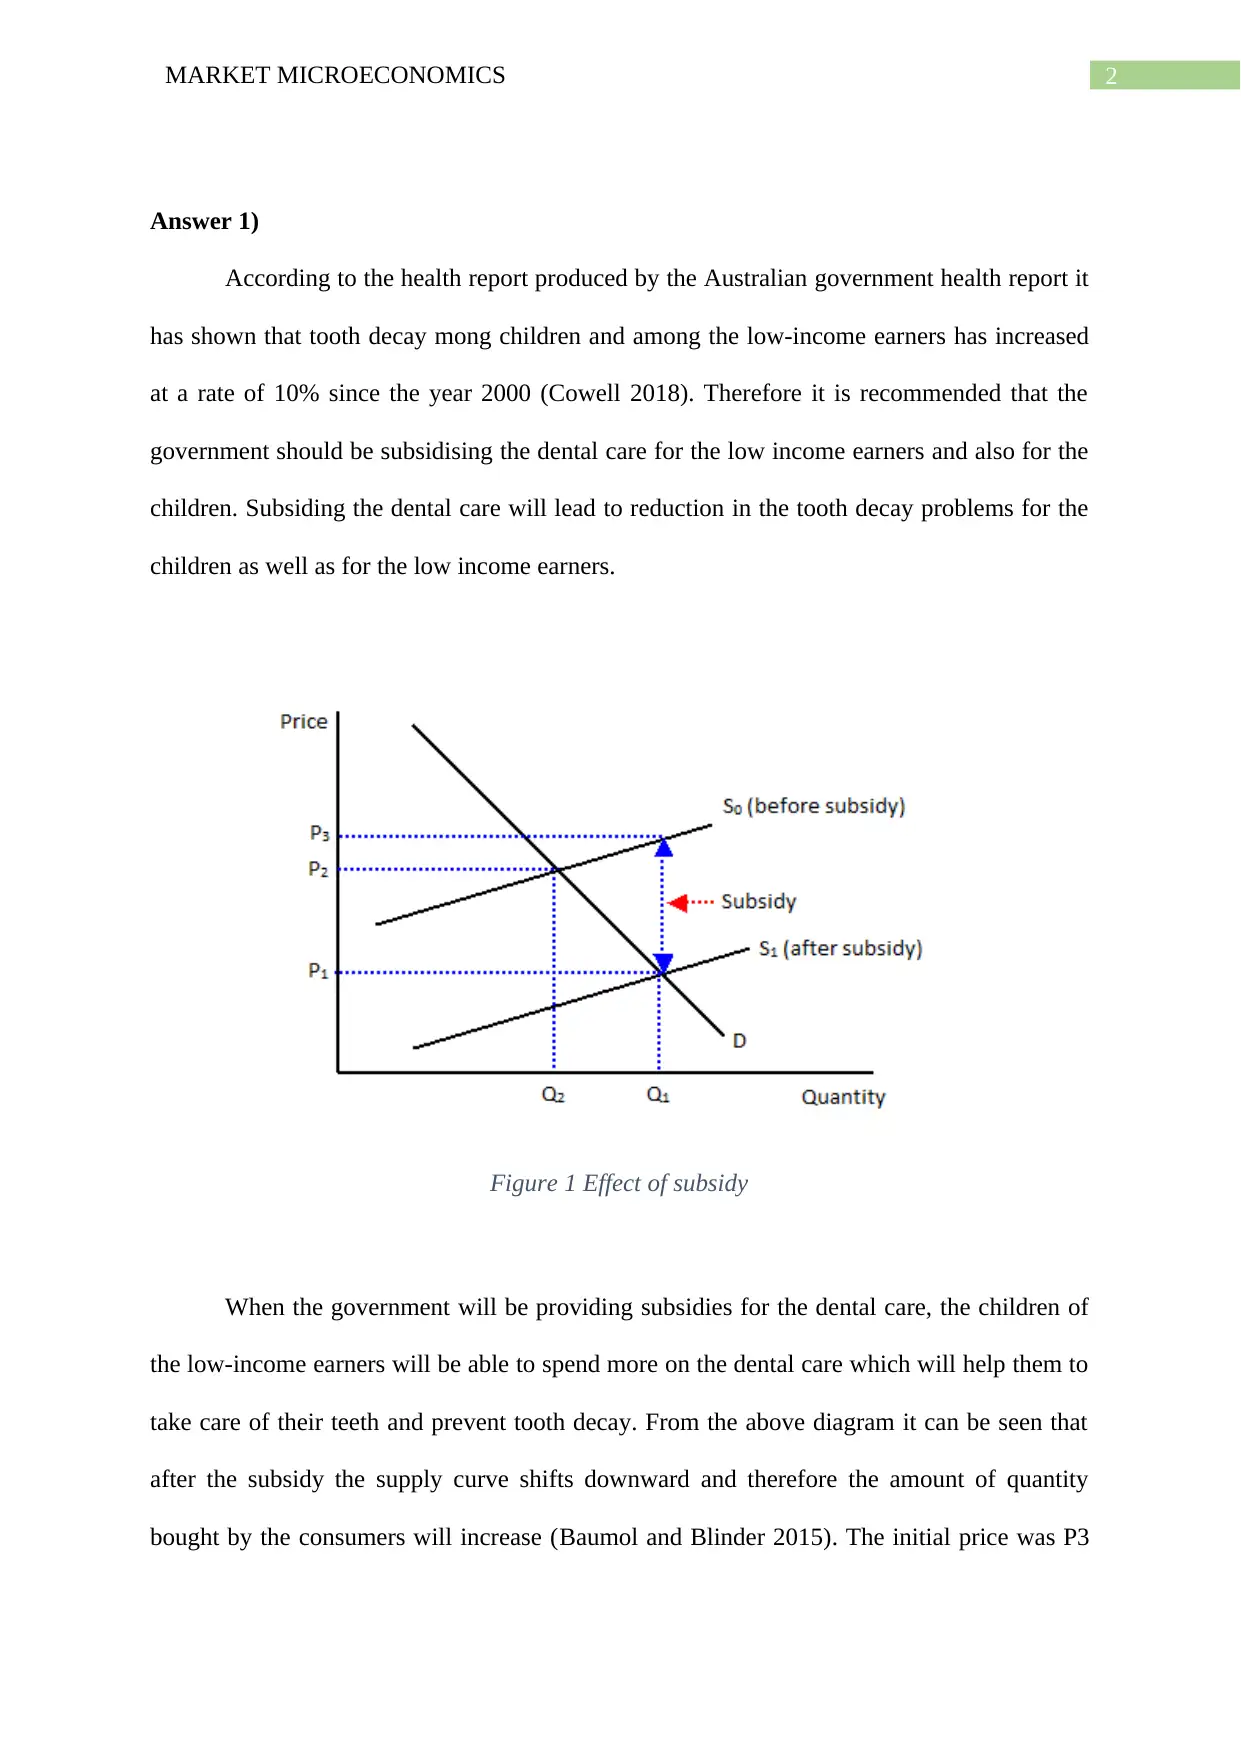
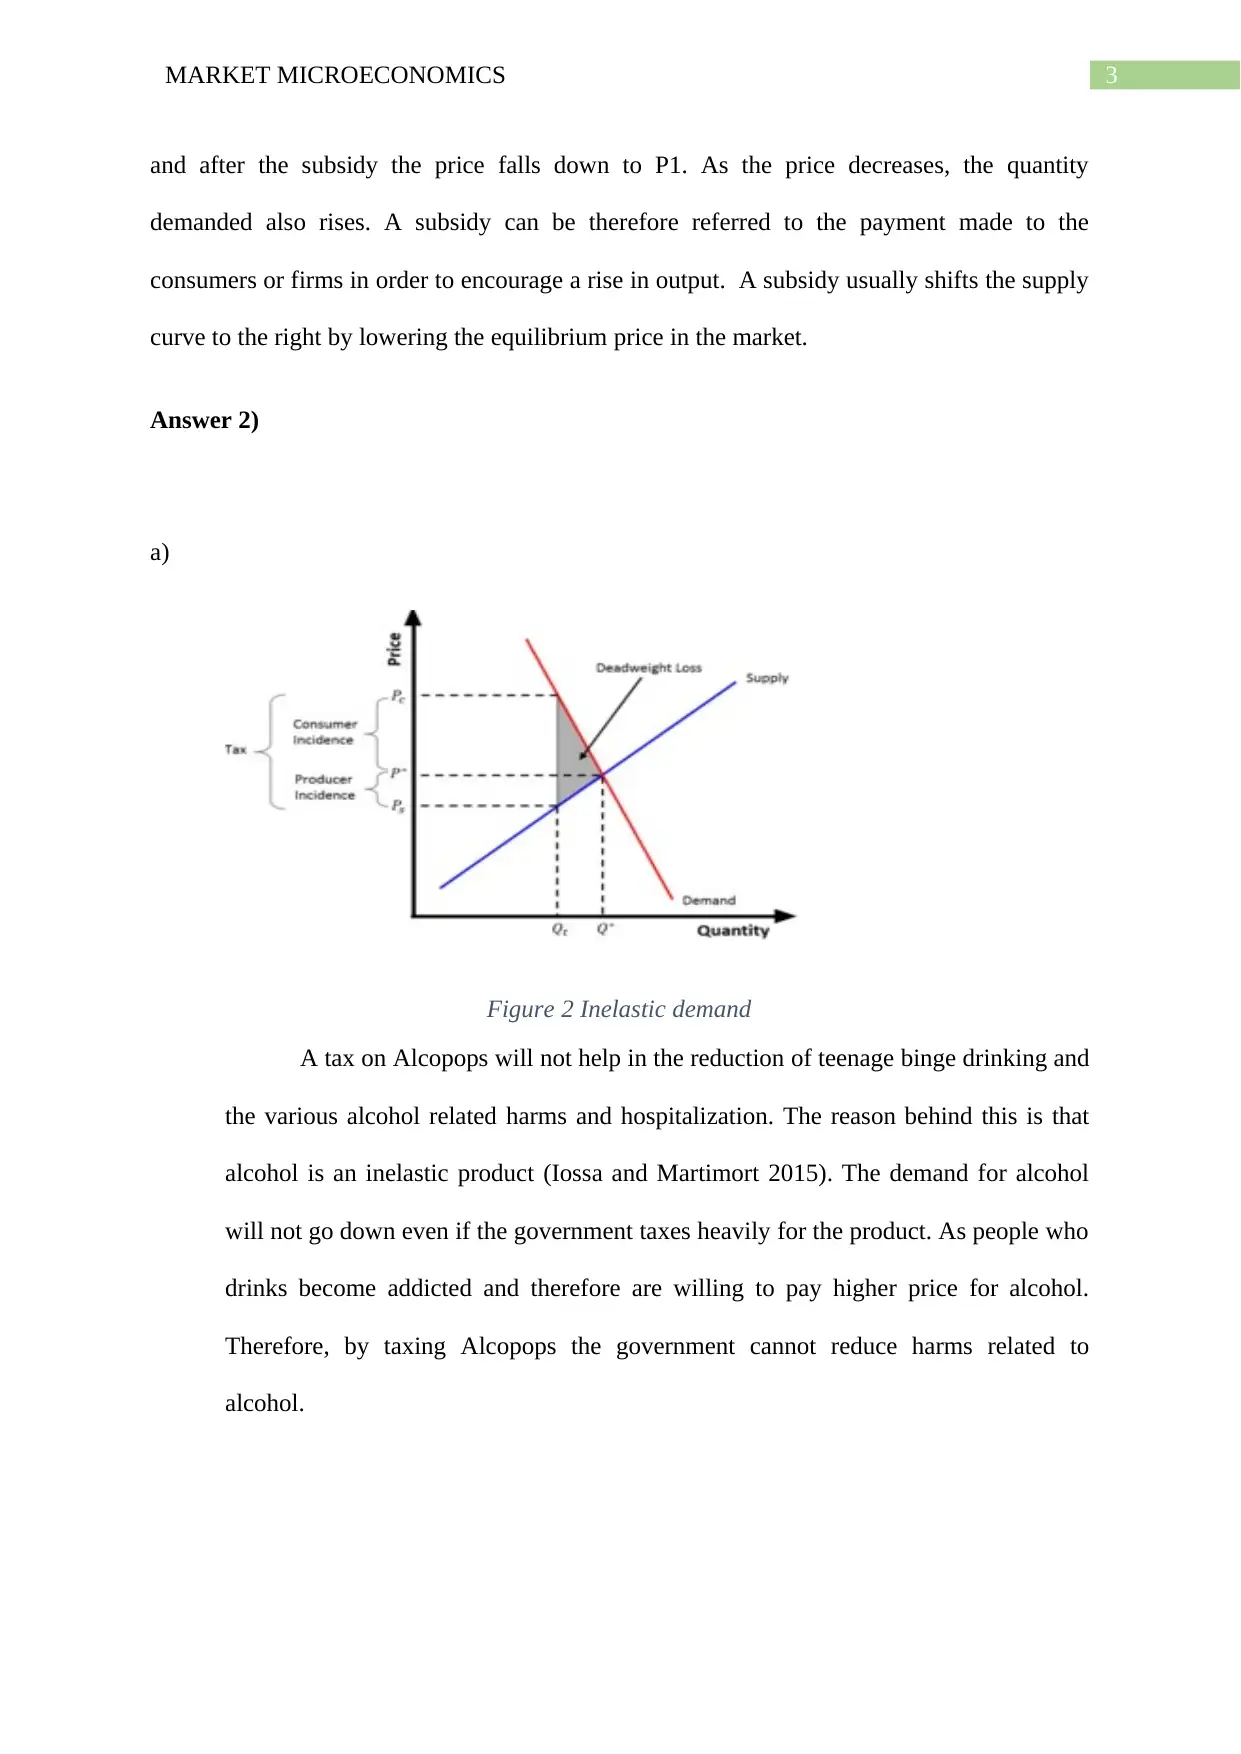
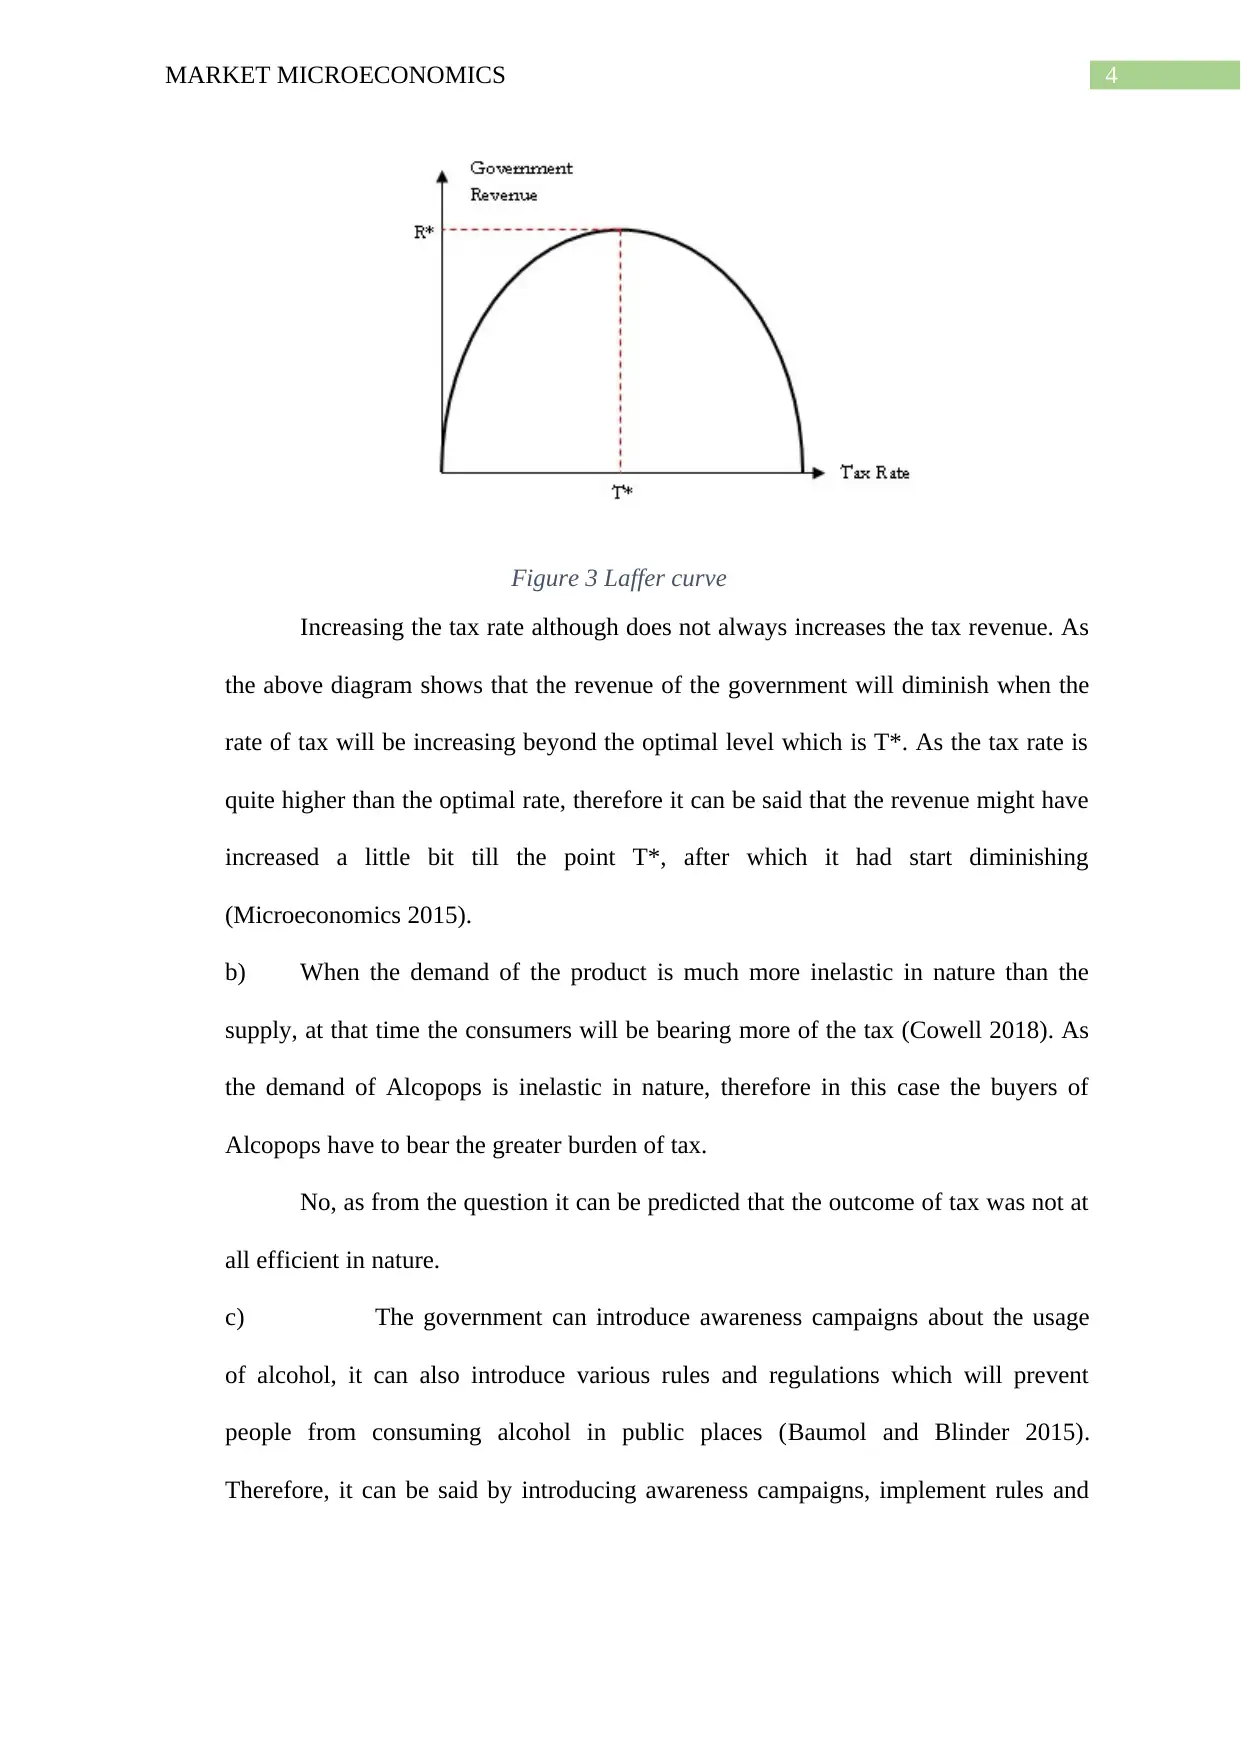
This microeconomics assignment analyzes the effects of government policies on market outcomes. The first part examines the impact of subsidies on dental care for low-income earners, using supply and demand diagrams to illustrate the effects on price and quantity. The second part explores the effects of taxes on Alcopops, considering the inelastic nature of alcohol demand and the implications for teenage binge drinking. It also discusses the Laffer curve and the distribution of tax burdens between consumers and producers, concluding with potential government interventions like awareness campaigns and regulations to reduce alcohol-related harms. The assignment uses diagrams and economic principles to provide a comprehensive analysis of market microeconomics.

Running head: MARKET MICROECONOMICS
Market microeconomics
Name of the student
Name of the university
Author note
Market microeconomics
Name of the student
Name of the university
Author note
Paraphrase This Document
Need a fresh take? Get an instant paraphrase of this document with our AI Paraphraser

1MARKET MICROECONOMICS
Table of contents
Answer 1)...................................................................................................................................2
Answer 2)...................................................................................................................................3
Reference list..............................................................................................................................5

2MARKET MICROECONOMICS
Answer 1)
According to the health report produced by the Australian government health report it
has shown that tooth decay mong children and among the low-income earners has increased
at a rate of 10% since the year 2000 (Cowell 2018). Therefore it is recommended that the
government should be subsidising the dental care for the low income earners and also for the
children. Subsiding the dental care will lead to reduction in the tooth decay problems for the
children as well as for the low income earners.
Figure 1 Effect of subsidy
When the government will be providing subsidies for the dental care, the children of
the low-income earners will be able to spend more on the dental care which will help them to
take care of their teeth and prevent tooth decay. From the above diagram it can be seen that
after the subsidy the supply curve shifts downward and therefore the amount of quantity
bought by the consumers will increase (Baumol and Blinder 2015). The initial price was P3
ā This is a preview!ā
Do you want full access?
Subscribe today to unlock all pages.

Trusted by 1+ million students worldwide

3MARKET MICROECONOMICS
and after the subsidy the price falls down to P1. As the price decreases, the quantity
demanded also rises. A subsidy can be therefore referred to the payment made to the
consumers or firms in order to encourage a rise in output. A subsidy usually shifts the supply
curve to the right by lowering the equilibrium price in the market.
Answer 2)
a)
Figure 2 Inelastic demand
A tax on Alcopops will not help in the reduction of teenage binge drinking and
the various alcohol related harms and hospitalization. The reason behind this is that
alcohol is an inelastic product (Iossa and Martimort 2015). The demand for alcohol
will not go down even if the government taxes heavily for the product. As people who
drinks become addicted and therefore are willing to pay higher price for alcohol.
Therefore, by taxing Alcopops the government cannot reduce harms related to
alcohol.
Paraphrase This Document
Need a fresh take? Get an instant paraphrase of this document with our AI Paraphraser

4MARKET MICROECONOMICS
Figure 3 Laffer curve
Increasing the tax rate although does not always increases the tax revenue. As
the above diagram shows that the revenue of the government will diminish when the
rate of tax will be increasing beyond the optimal level which is T*. As the tax rate is
quite higher than the optimal rate, therefore it can be said that the revenue might have
increased a little bit till the point T*, after which it had start diminishing
(Microeconomics 2015).
b) When the demand of the product is much more inelastic in nature than the
supply, at that time the consumers will be bearing more of the tax (Cowell 2018). As
the demand of Alcopops is inelastic in nature, therefore in this case the buyers of
Alcopops have to bear the greater burden of tax.
No, as from the question it can be predicted that the outcome of tax was not at
all efficient in nature.
c) The government can introduce awareness campaigns about the usage
of alcohol, it can also introduce various rules and regulations which will prevent
people from consuming alcohol in public places (Baumol and Blinder 2015).
Therefore, it can be said by introducing awareness campaigns, implement rules and

5MARKET MICROECONOMICS
regulations and educating the teenagers about the demerits of alcohol consumption
can help in reducing teenage binge drinking and alcohol related harms.
regulations and educating the teenagers about the demerits of alcohol consumption
can help in reducing teenage binge drinking and alcohol related harms.
ā This is a preview!ā
Do you want full access?
Subscribe today to unlock all pages.

Trusted by 1+ million students worldwide

6MARKET MICROECONOMICS
Reference list
Baumol, W.J. and Blinder, A.S., 2015. Microeconomics: Principles and policy. Nelson
Education.
Cowell, F., 2018. Microeconomics: principles and analysis. Oxford University Press.
Iossa, E. and Martimort, D., 2015. The simple microeconomics of publicāprivate
partnerships. Journal of Public Economic Theory, 17(1), pp.4-48.
Microeconomics, E.E., 2015. KELVIN WONG. Cell, 808, pp.386-8406.
1 out of 7
Related Documents

Your All-in-One AI-Powered Toolkit for Academic Success.
Ā +13062052269
info@desklib.com
Available 24*7 on WhatsApp / Email
Unlock your academic potential
Copyright Ā© 2020ā2025 A2Z Services. All Rights Reserved. Developed and managed by ZUCOL.