Microeconomics Assignment on Market Structures and Inflation Analysis

Verified

Added on  2020/03/16

|5
|1048
|50
Homework Assignment
AI Summary
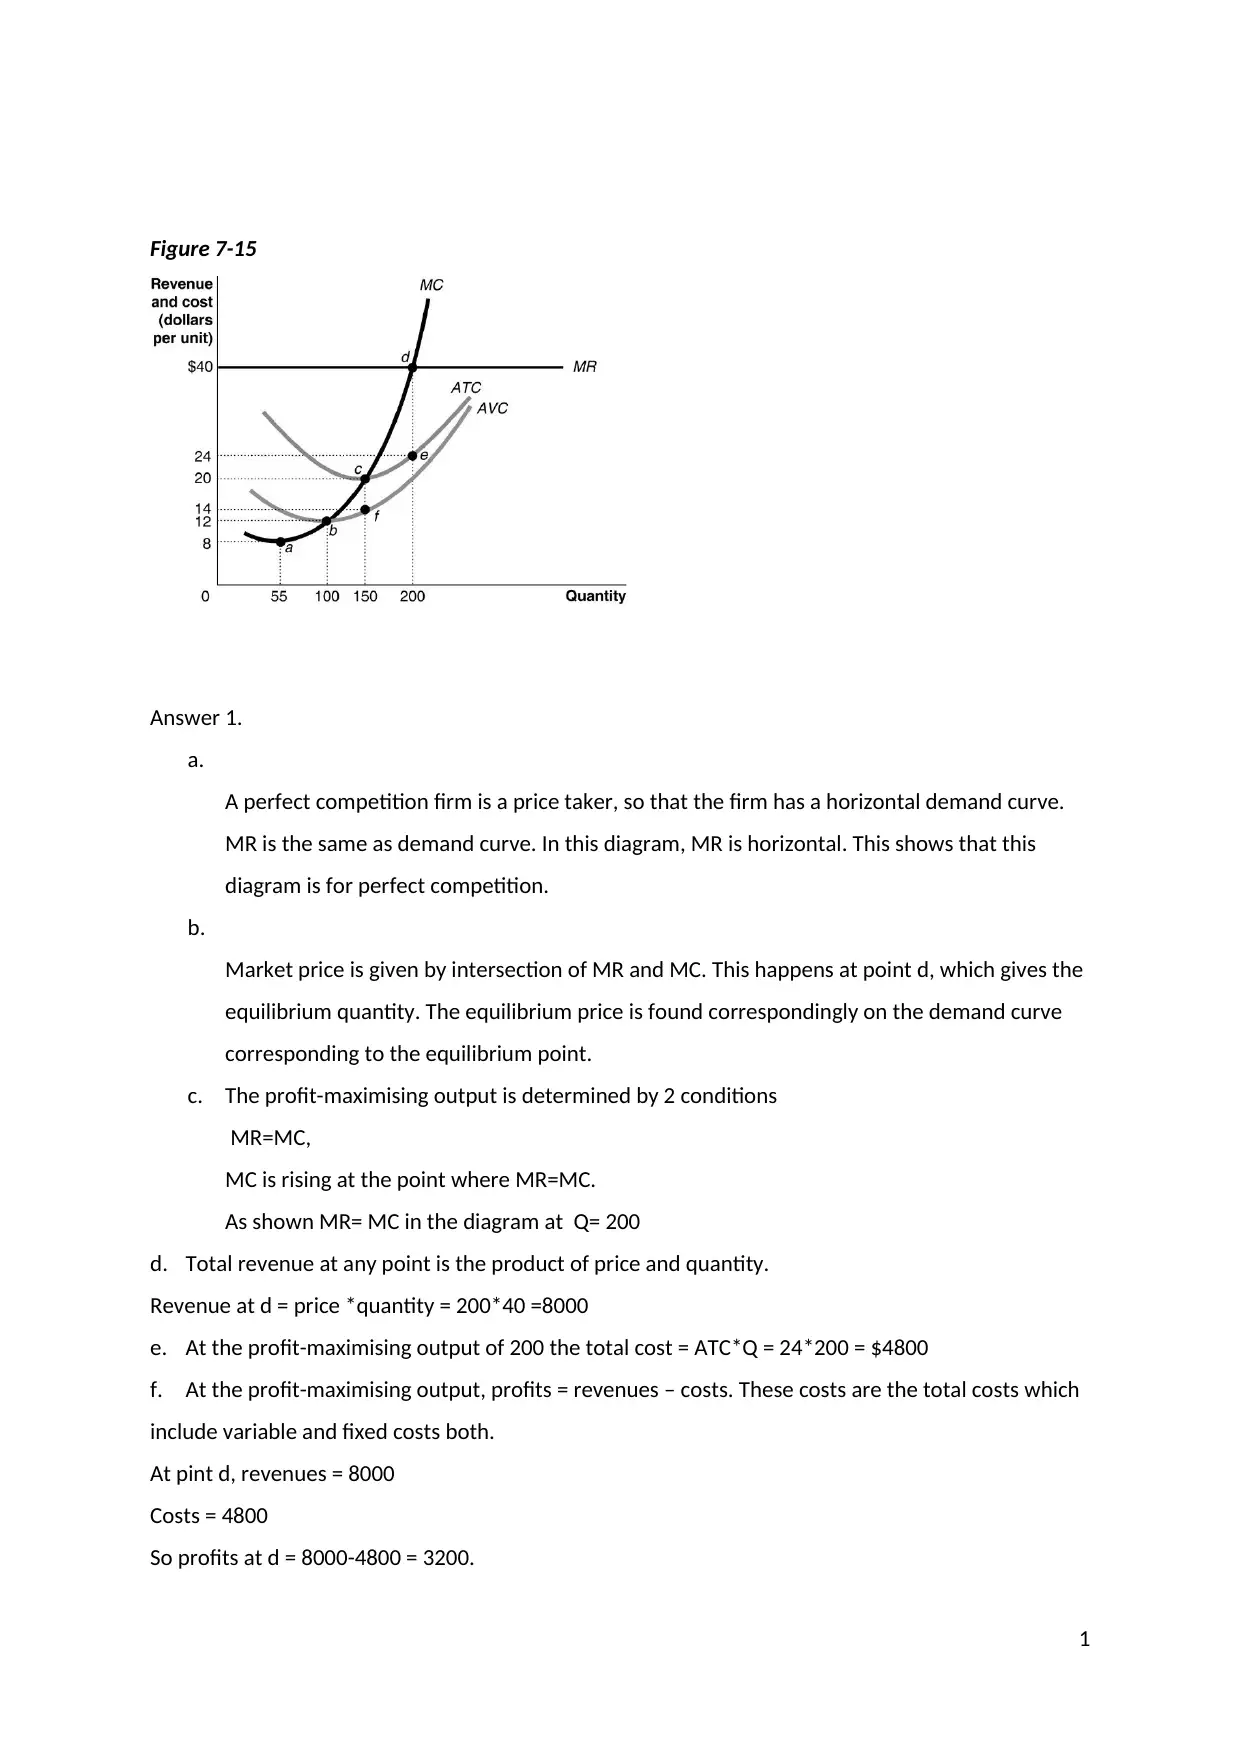
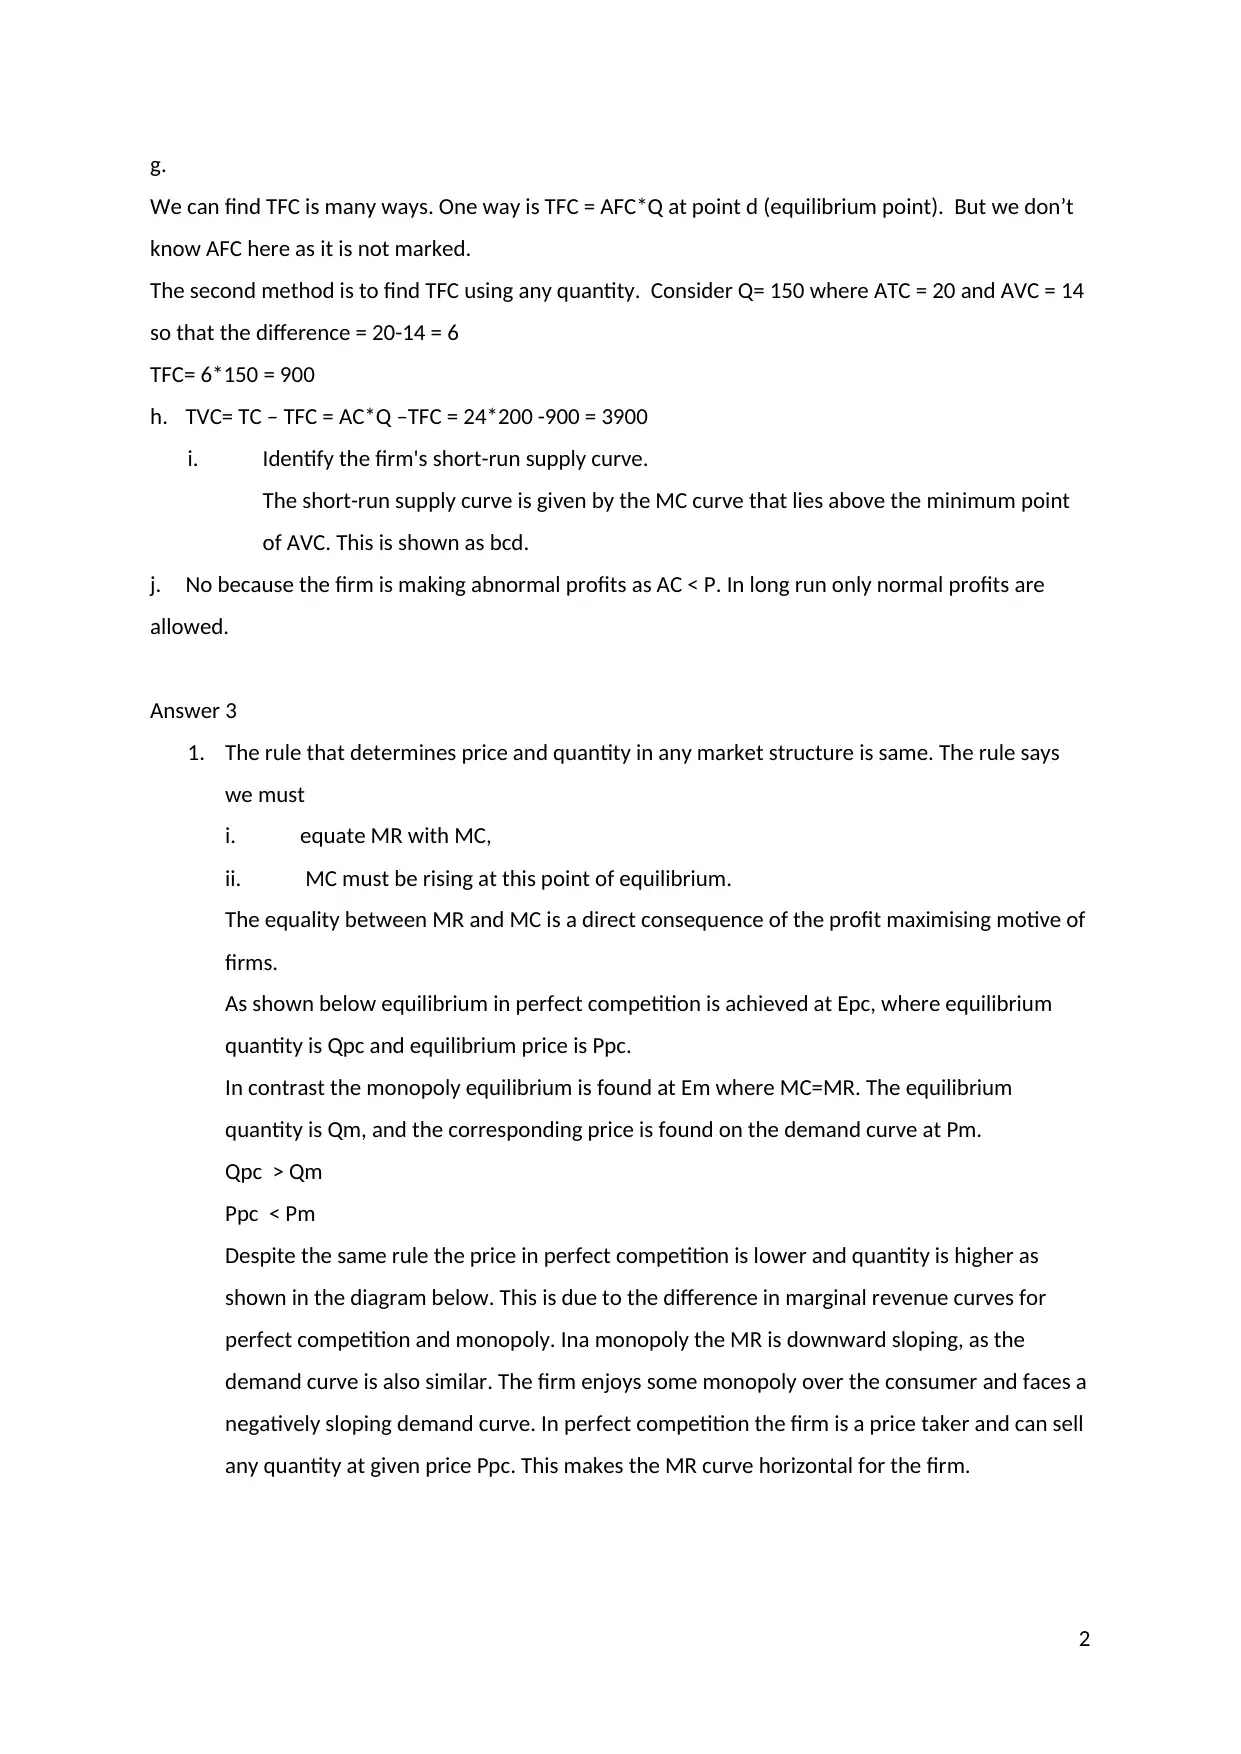
This economics assignment provides solutions to questions on microeconomic principles. The first part analyzes a perfectly competitive firm, determining profit-maximizing output, total revenue, total cost, and profits using marginal cost and revenue curves. It also identifies the firm's short-run supply curve and explains long-run profitability. The second part compares perfect competition and monopoly, highlighting the differences in equilibrium price and quantity, and the role of marginal revenue. The final part examines inflation, differentiating between cost-push and demand-pull inflation, and analyzing the causes of cost-push inflation in Pakistan, referencing rising fuel, food, and raw material prices, along with the elimination of energy subsidies. The assignment includes supporting diagrams and a bibliography of cited sources.
Document Page
Figure 7-15
Answer 1.
a.
A perfect competition firm is a price taker, so that the firm has a horizontal demand curve.
MR is the same as demand curve. In this diagram, MR is horizontal. This shows that this
diagram is for perfect competition.
b.
Market price is given by intersection of MR and MC. This happens at point d, which gives the
equilibrium quantity. The equilibrium price is found correspondingly on the demand curve
corresponding to the equilibrium point.
c. The profit-maximising output is determined by 2 conditions
MR=MC,
MC is rising at the point where MR=MC.
As shown MR= MC in the diagram at Q= 200
d. Total revenue at any point is the product of price and quantity.
Revenue at d = price *quantity = 200*40 =8000
e. At the profit-maximising output of 200 the total cost = ATC*Q = 24*200 = $4800
f. At the profit-maximising output, profits = revenues – costs. These costs are the total costs which
include variable and fixed costs both.
At pint d, revenues = 8000
Costs = 4800
So profits at d = 8000-4800 = 3200.
1
tabler-icon-diamond-filled.svg

Paraphrase This Document

Need a fresh take? Get an instant paraphrase of this document with our AI Paraphraser
Document Page
g.
We can find TFC is many ways. One way is TFC = AFC*Q at point d (equilibrium point). But we don’t
know AFC here as it is not marked.
The second method is to find TFC using any quantity. Consider Q= 150 where ATC = 20 and AVC = 14
so that the difference = 20-14 = 6
TFC= 6*150 = 900
h. TVC= TC – TFC = AC*Q –TFC = 24*200 -900 = 3900
i. Identify the firm's short-run supply curve.
The short-run supply curve is given by the MC curve that lies above the minimum point
of AVC. This is shown as bcd.
j. No because the firm is making abnormal profits as AC < P. In long run only normal profits are
allowed.
Answer 3
1. The rule that determines price and quantity in any market structure is same. The rule says
we must
i. equate MR with MC,
ii. MC must be rising at this point of equilibrium.
The equality between MR and MC is a direct consequence of the profit maximising motive of
firms.
As shown below equilibrium in perfect competition is achieved at Epc, where equilibrium
quantity is Qpc and equilibrium price is Ppc.
In contrast the monopoly equilibrium is found at Em where MC=MR. The equilibrium
quantity is Qm, and the corresponding price is found on the demand curve at Pm.
Qpc > Qm
Ppc < Pm
Despite the same rule the price in perfect competition is lower and quantity is higher as
shown in the diagram below. This is due to the difference in marginal revenue curves for
perfect competition and monopoly. Ina monopoly the MR is downward sloping, as the
demand curve is also similar. The firm enjoys some monopoly over the consumer and faces a
negatively sloping demand curve. In perfect competition the firm is a price taker and can sell
any quantity at given price Ppc. This makes the MR curve horizontal for the firm.
2
Document Page
Answer 4
Inflation is defined as a consistent rise in price level in the economy. Depending on the cause, level
and pace of rise in prices, it can be of many types ranging from hyperinflation to creeping
inflation. We have two main types- demand pull inflation and cost push inflation.
COST PUSH INFLATION.
As the name suggests this inflation is caused by an increase in costs of production. Some of the
common costs include:
Input costs are a major part of variable costs. A rise in the prices of raw materials can be attributed
to internal or external reasons. External reasons are beyond our control asana economy- rise in
global commodity prices such as oil, gas, copper and primary agricultural products is one example.
Internal reasons lie within the economy- a temporary disruption in electricity services due to a local
hurricane in an example.
labour costs – Any wage rise can increase costs, which can be temporary or permanent due to
structural and institutional reasons.
Policy measures like tax structure, can be passé don to the consumer, this causes the final price of a
good to increase.
3
Document Page
Fluctuations in the exchange rate affect prices of imports. if imports are part of inputs then any
exchange rate changes affect input costs.
DEMAND PULL INFLATION: this is caused by an increase in demand from any economic agent –
consumption demand from consumers, investment demand by producers, government demand or
demand from rest of the world. The causes of such an increase range from - depreciation of the
exchange rate( that lead to higher demand for exports), expansionary fiscal policy, expansionary
monetary policy, a fall in interest rates, higher economic growth in trading countries or improved
business confidence among firms.
From the given data it is clear that Pakistan is seeing a COST PUSH inflation. We are told of
increasing prices of fuel, food, raw materials, transportation, construction materials,
elimination of energy subsidies. This has translated into a rise in input prices which directly
impacts the wholesale price index. A 21.99% rise in WPI is indicative of costs pushing up
prices.
BIBLIOGRAPHY
Cost concepts. (n.d.). Retrieved Oct 2, 2017, from Pitt.edu:
http://www.pitt.edu/~upjecon/MCG/MICRO/COST/Costs.html
LR competitive equilibrium in an economy with production. (n.d.). Retrieved Oct 2, from
Economics.utoronto.ca: https://www.economics.utoronto.ca/osborne/2x3/tutorial/LRCE.HTM
Perfect Comnpetition in the Long run. (n.d.). Retrieved Oct 3, 2017, from Open.lib.umn.edu:
https://open.lib.umn.edu/principleseconomics/chapter/9-3-perfect-competition-in-the-long-run/
perfect competition. (n.d.). Retrieved October 2, 2017, from Staffwww.fullcoll.edu:
http://staffwww.fullcoll.edu/fchan/Micro/4perfect_competition.htm
4
tabler-icon-diamond-filled.svg

Paraphrase This Document

Need a fresh take? Get an instant paraphrase of this document with our AI Paraphraser
Document Page
5
chevron_up_icon
1 out of 5
circle_padding
hide_on_mobile
zoom_out_icon
[object Object]