Microeconomics Assignment Solution for BUECO 5903, Semester 2, 2019

Verified

Added on  2022/12/23

|10
|1862
|2
Homework Assignment
AI Summary
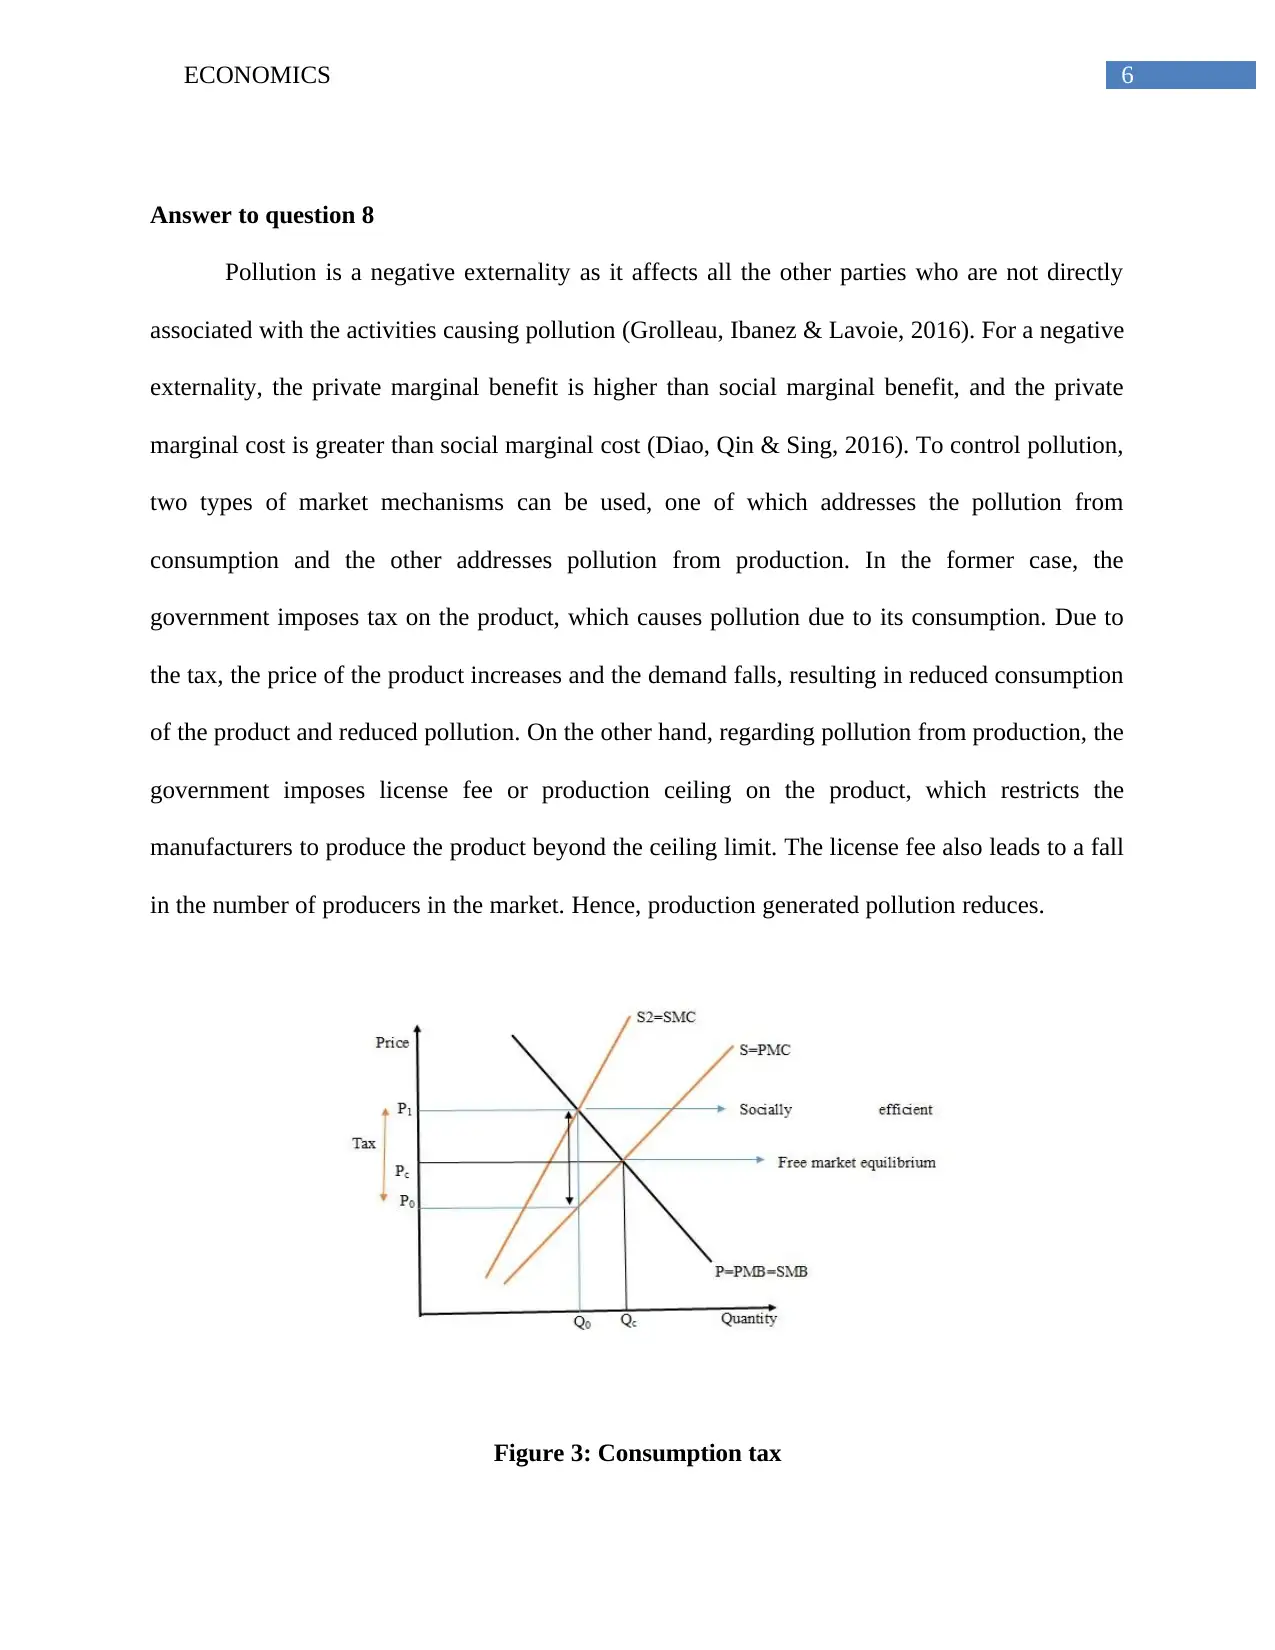
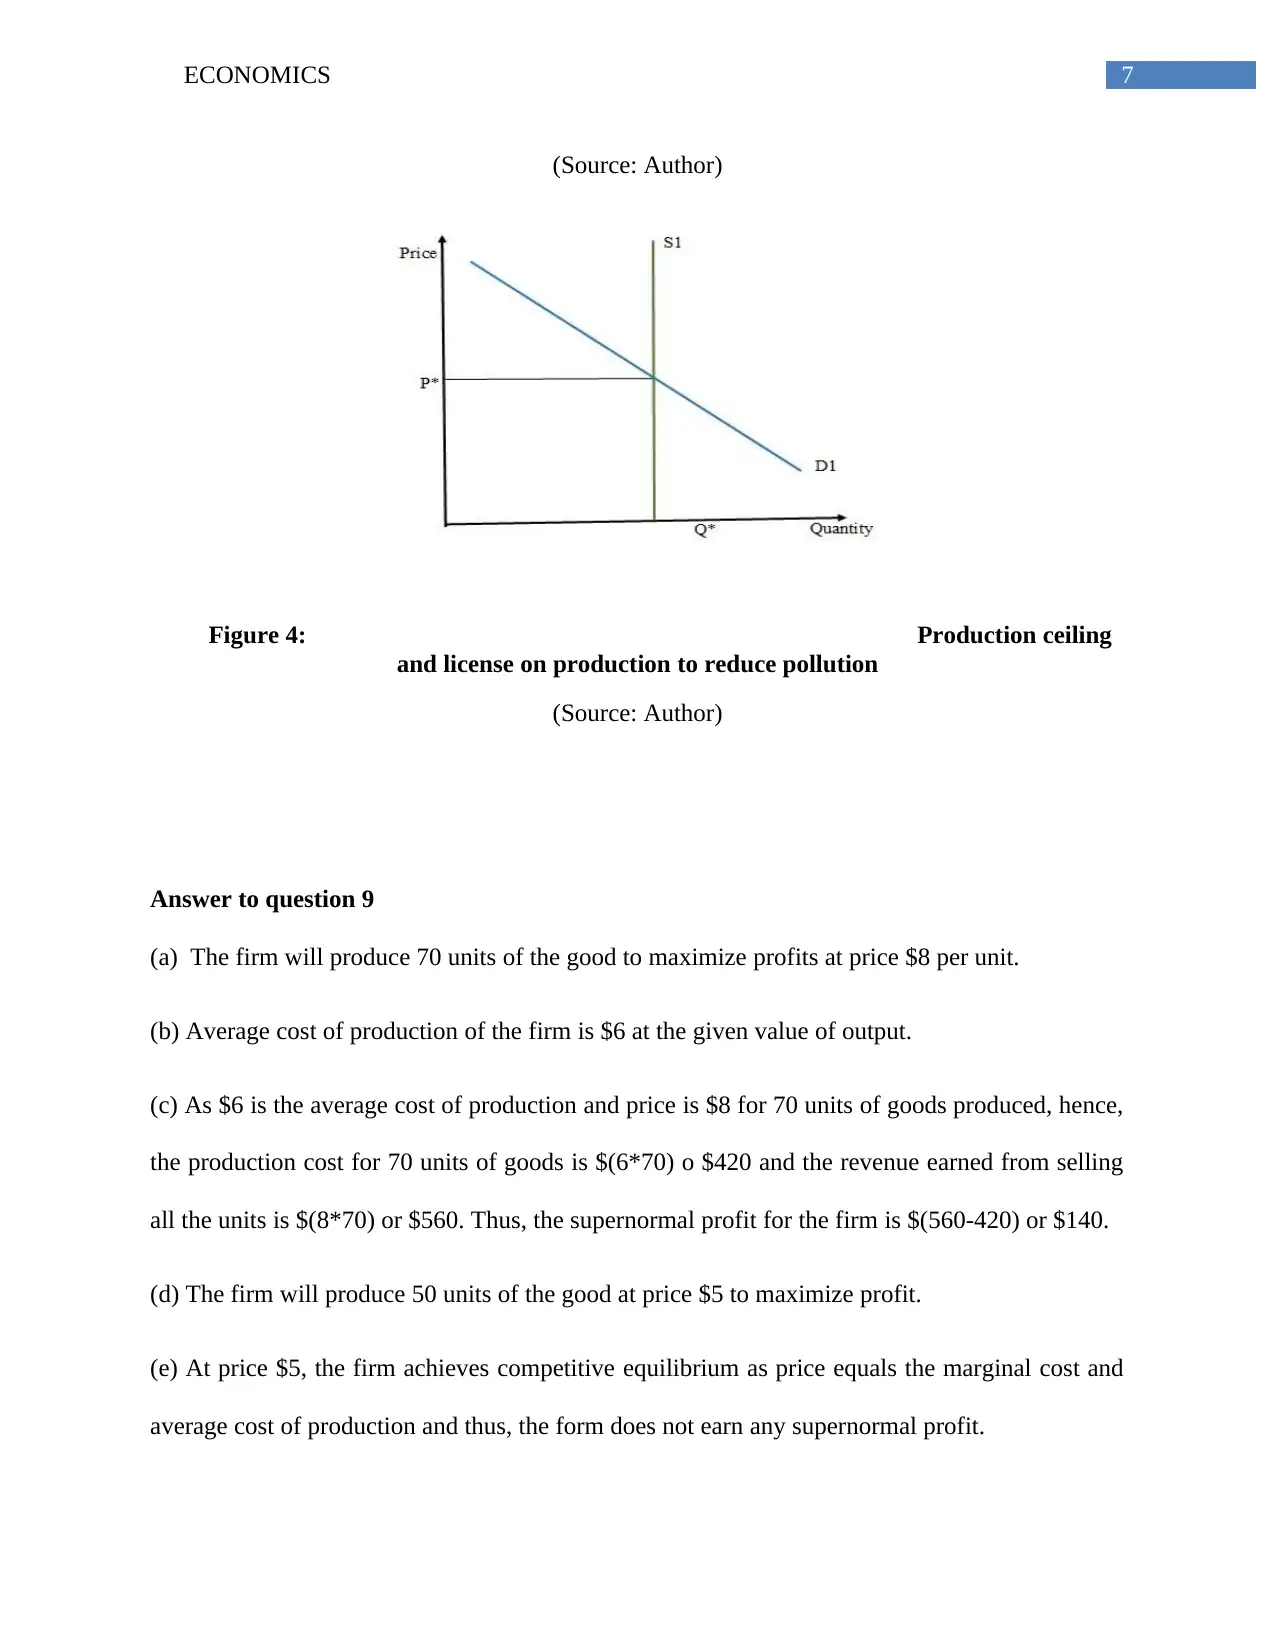
This document presents a comprehensive solution to a microeconomics assignment for the BUECO 5903 course, focusing on key economic principles. The assignment addresses several core concepts, including market equilibrium, supply and demand analysis, and the impact of various events on the peanut industry, such as changes in fertilizer prices, consumer preferences, and environmental factors. The solution explores diminishing marginal returns and diseconomies of scale, differentiating between explicit and implicit costs. It delves into the concept of elasticity of demand (price, income, and cross-price), and how firms can use this knowledge for pricing decisions. The assignment also examines negative externalities, specifically pollution, and how market mechanisms like consumption taxes and production ceilings can be used to mitigate them. The solution includes diagrams to illustrate these concepts and answers questions on profit maximization, competitive equilibrium, and the short-run and long-run shutdown decisions of a firm.
Document Page
Running head: ECONOMICS
Economics
Name of the Student:
Name of the University:
Author note:
tabler-icon-diamond-filled.svg

Paraphrase This Document

Need a fresh take? Get an instant paraphrase of this document with our AI Paraphraser
Document Page
1ECONOMICS
Table of Contents
Answer to question 2.......................................................................................................................2
Answer to question 5.......................................................................................................................4
Answer to question 6.......................................................................................................................5
Answer to question 8.......................................................................................................................6
Answer to question 9.......................................................................................................................7
References........................................................................................................................................9
Document Page
2ECONOMICS
Answer to question 2
(a) Fertilizer used in the production of peanuts is a factor of production and increase in the price
of fertilizer will raise the cost of production. Hence, the sellers will supply fewer amounts of
peanuts in the market. This will shift the supply curve of peanut to the left, from S to S1. The
equilibrium price for peanuts will increase and the quantity supplied will fall. The new
equilibrium is shown in the graph below.
Figure 1: Fall in peanut supply due to rise in fertilizer price
(Source: Author)
(b) Tastes and preferences of the consumers influence the sales and the market demand for the
good. As the taste of the customers changed towards popcorn from peanuts, there is a fall in the
demand for the peanut. This shifts the position of the demand curve to the left, from D to D1,
Document Page
3ECONOMICS
which causes fall in the price and quantity demanded for peanut. The price and quantity at the
new equilibrium point are P1 and Q1 respectively.
Figure 2: Shift in demand curve and
fall in demand
(Source: Author)
(c) Productivity of the land, used for peanut production, has reduced because of drought and
thus, the supply of peanuts has reduced, resulting in the shifting of the supply curve of peanut to
the left as in figure 1. Thus, the quantity supplied of peanuts fall and price increases.
(d) As the doctors found that peanuts are bad for overall general health, there is a fall in the
demand for the peanuts and that shifts the demand curve for peanuts to the left, from D to D1 as
shown in figure 2. There is a fall in both price and quantity at the new equilibrium point.
tabler-icon-diamond-filled.svg

Paraphrase This Document

Need a fresh take? Get an instant paraphrase of this document with our AI Paraphraser
Document Page
4ECONOMICS
Answer to question 5
Diminishing marginal returns refers to fall in the output due to addition of increasing
input in the short run while one factor of production is fixed. As stated by Ravichandran, Han &
Mithas (2017), according to the law of diminishing marginal returns, with each additional unit in
one factor of production, the additional output per unit decreases while the other factors of
production remain constant. This happens in the short run, as the factors can be kept constant
only in the short run.
On the other hand, diseconomies of scale refer to the cost disadvantages that a firm faces
in the long run due to increase in the size of the firm. As stated by Swart & Groot (2015), the
diseconomies of scale arise when a firm or an organization grows much larger in size, the cost
per unit of output increases in the long run. In this stage, economies of scale no longer functions
for the firm and it experiences increasing cost with increasing output. Thus, it can be stated that
diminishing marginal returns arise in the short run when output decreases with each additional
unit of one input while others remain fixed, and decreasing returns to scale arise when a plant
grows too large that cost per unit increases with one unit of additional output.
The explicit costs of a firm refer to the expenses that the firm pays with tangible assets
and hence, these are known as out-of-pocket expenses. It is borne directly. On the other hand,
implicit costs are the opportunity costs or imputed costs of a firm. In other words, the implicit
costs are those opportunity costs that a firm gives up for using a factor of production which it
already owns and does not pay rent (Boneva et al., 2019).
Document Page
5ECONOMICS
Answer to question 6
Price elasticity of demand is defined as the percentage change in demand for a product or
a service due to one percent change in its own price. On the other hand, income elasticity of
demand refers to the percentage change in demand for a product or a service due to one
percentage change in the income of the consumers. Thus, price elasticity of demand shows a
movement in the slope of the demand curve, while for income elasticity, the position of the
demand curve changes along with its slope (Kreps, 2019).
Cross price elasticity of demand refers to the percentage change in the demand for a
product or service due to one percentage change in the price of another good.
A firm should know the difference between these three concepts of elasticity of demand
as elasticity of demand represents the sensitiveness of the demand for a good or service to
changes in economic variables, such as, its own price, income of consumers and price of
substitute or complementary goods. Price elasticity gives an idea about how the demand for a
good may change if its price increases or decreases, while the income elasticity is useful for
measuring the impact of the consumer’s income on the demand for a product. Lastly, cross price
elasticity is beneficial for understanding the substitute and complementary products for a good
and based on this, firms can take pricing decisions (Cowell, 2018).
Document Page
6ECONOMICS
Answer to question 8
Pollution is a negative externality as it affects all the other parties who are not directly
associated with the activities causing pollution (Grolleau, Ibanez & Lavoie, 2016). For a negative
externality, the private marginal benefit is higher than social marginal benefit, and the private
marginal cost is greater than social marginal cost (Diao, Qin & Sing, 2016). To control pollution,
two types of market mechanisms can be used, one of which addresses the pollution from
consumption and the other addresses pollution from production. In the former case, the
government imposes tax on the product, which causes pollution due to its consumption. Due to
the tax, the price of the product increases and the demand falls, resulting in reduced consumption
of the product and reduced pollution. On the other hand, regarding pollution from production, the
government imposes license fee or production ceiling on the product, which restricts the
manufacturers to produce the product beyond the ceiling limit. The license fee also leads to a fall
in the number of producers in the market. Hence, production generated pollution reduces.
Figure 3: Consumption tax
tabler-icon-diamond-filled.svg

Paraphrase This Document

Need a fresh take? Get an instant paraphrase of this document with our AI Paraphraser
Document Page
7ECONOMICS
(Source: Author)
Figure 4: Production ceiling
and license on production to reduce pollution
(Source: Author)
Answer to question 9
(a) The firm will produce 70 units of the good to maximize profits at price $8 per unit.
(b) Average cost of production of the firm is $6 at the given value of output.
(c) As $6 is the average cost of production and price is $8 for 70 units of goods produced, hence,
the production cost for 70 units of goods is $(6*70) o $420 and the revenue earned from selling
all the units is $(8*70) or $560. Thus, the supernormal profit for the firm is $(560-420) or $140.
(d) The firm will produce 50 units of the good at price $5 to maximize profit.
(e) At price $5, the firm achieves competitive equilibrium as price equals the marginal cost and
average cost of production and thus, the form does not earn any supernormal profit.
Document Page
8ECONOMICS
(f) Price $4 is below average cost and thus there is no profit earned by the firm at this point.
However, the firm produces 40 units to minimize loss. $4 is less than the average cost of
production and hence, it does not generate any profit for the firm. However, to minimize loss the
firm produces 40 units at $4 as it is the marginal cost at that point.
(g) The price is below average cost and thus the firm not even able to cover its entire cost.
Therefore, at the give price the firm is making loss. At price $4, the price is less than the average
cost for the firm and hence, the firm cannot cover its cost of production at this price level. Thus,
the firm will make loss at $4.
(h) In the short run, the firm will shut down if the product price is less than the average variable
cost.
(i) In the long run, the firm will shut down if the price of the product is less than the average cost
of production.
Document Page
9ECONOMICS
References
Boneva, L., Cloyne, J., Weale, M., & Wieladek, T. (2019). Firms' price, cost and activity
expectations: evidence from micro data.
Cowell, F. (2018). Microeconomics: principles and analysis. Oxford University Press.
Diao, M., Qin, Y., & Sing, T. F. (2016). Negative externalities of rail noise and housing values:
Evidence from the cessation of railway operations in Singapore. Real Estate
Economics, 44(4), 878-917.
Grolleau, G., Ibanez, L., & Lavoie, N. (2016). Cause-related marketing of products with a
negative externality. Journal of Business Research, 69(10), 4321-4330.
Kreps, D. M. (2019). Microeconomics for managers. Princeton University Press.
Ravichandran, T., Han, S., & Mithas, S. (2017). Mitigating diminishing returns to R&D: The
role of information technology in innovation. Information Systems Research, 28(4), 812-
827.
Swart, J., & Groot, L. (2015). Waste management alternatives:(Dis) economies of scale in
recovery and decoupling. Resources, Conservation and Recycling, 94, 43-55.
chevron_up_icon
1 out of 10
circle_padding
hide_on_mobile
zoom_out_icon
[object Object]