University Microeconomics Assignment: Elasticity, Market, and Strategy
VerifiedAdded on 2022/10/04
|11
|1909
|407
Homework Assignment
AI Summary
This microeconomics assignment explores several key concepts. Task 2 analyzes price elasticity of supply in different seasons, cross-price elasticity, and price elasticity of demand for a novel. Task 3 differentiates between fixed and variable costs, using examples like airline fees and R&D spending, and illustrates cost curves in the water supply industry. Task 4 examines perfect competition, explaining how market equilibrium is achieved and the impact of network externalities in monopoly markets. Task 5 delves into game theory, identifying the dominant strategy and Nash equilibrium in a payoff matrix scenario involving advertising decisions by two firms. The assignment uses diagrams and real-world examples to illustrate the economic principles discussed.
Running head: Microeconomics
Microeconomics
Name of the Student
Name of the University
Student ID
Microeconomics
Name of the Student
Name of the University
Student ID
Paraphrase This Document
Need a fresh take? Get an instant paraphrase of this document with our AI Paraphraser
1Microeconomics
Table of Contents
Task 2...............................................................................................................................................2
Task 3...............................................................................................................................................4
Task 4...............................................................................................................................................6
Task 5...............................................................................................................................................7
List of Reference..............................................................................................................................9
2Microeconomics
Task 2
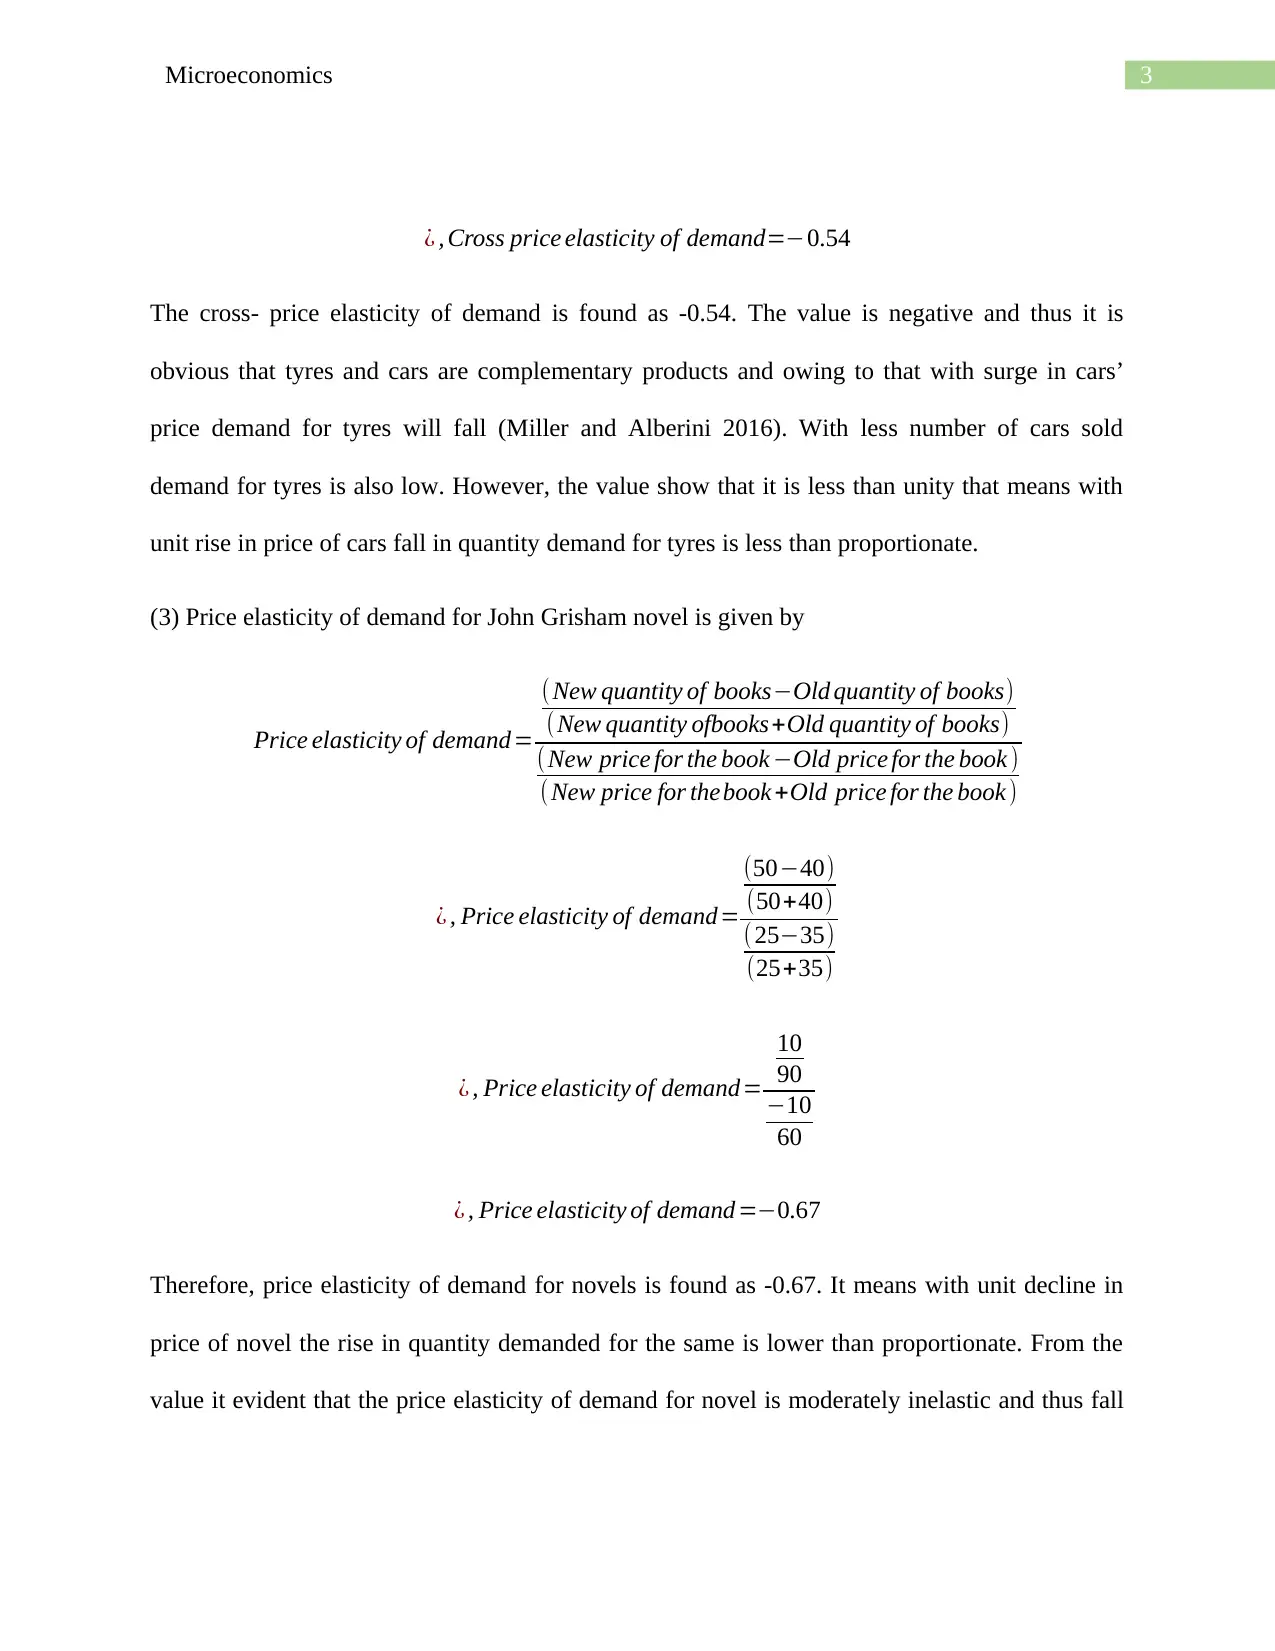
(1) Off-season would have more price elasticity of supply than peak because in peak season
demand for hotel rooms are high and most of the hotels are packed up and suffers from supply
constraint (Mason and Roberts 2018). Thus, even with high price in peak season hotels cannot
increase supply whereas in the case off-season hotels increase supply with increase in price. The
elasticity determinant is the supply limited number of rooms.
(2) Cross price elasticity of demand between tyres and cars is given below
Cross price elasticity of demand=
( New quantity oftyres−Old quantity of tyres )
(New quantity oftyres+Old quantity of tyres)
(New price for cars−Old price for cars)
(New price for cars+ Old price for cars)
¿ , Cross price elasticity of demand=
(61000−80000)
(61000+ 80000)
(35000−21000)
(35000+ 21000)
¿ , Cross price elasticity of demand=
(−19000)
(141000)
(14000)
(56000)
¿ , Cross price elasticity of demand=
−19
141
1
4
¿ , Cross price elasticity of demand=−76
141
Task 2
(1) Off-season would have more price elasticity of supply than peak because in peak season
demand for hotel rooms are high and most of the hotels are packed up and suffers from supply
constraint (Mason and Roberts 2018). Thus, even with high price in peak season hotels cannot
increase supply whereas in the case off-season hotels increase supply with increase in price. The
elasticity determinant is the supply limited number of rooms.
(2) Cross price elasticity of demand between tyres and cars is given below
Cross price elasticity of demand=
( New quantity oftyres−Old quantity of tyres )
(New quantity oftyres+Old quantity of tyres)
(New price for cars−Old price for cars)
(New price for cars+ Old price for cars)
¿ , Cross price elasticity of demand=
(61000−80000)
(61000+ 80000)
(35000−21000)
(35000+ 21000)
¿ , Cross price elasticity of demand=
(−19000)
(141000)
(14000)
(56000)
¿ , Cross price elasticity of demand=
−19
141
1
4
¿ , Cross price elasticity of demand=−76
141
⊘ This is a preview!⊘
Do you want full access?
Subscribe today to unlock all pages.
Trusted by 1+ million students worldwide
3Microeconomics
¿ , Cross price elasticity of demand=−0.54
The cross- price elasticity of demand is found as -0.54. The value is negative and thus it is
obvious that tyres and cars are complementary products and owing to that with surge in cars’
price demand for tyres will fall (Miller and Alberini 2016). With less number of cars sold
demand for tyres is also low. However, the value show that it is less than unity that means with
unit rise in price of cars fall in quantity demand for tyres is less than proportionate.
(3) Price elasticity of demand for John Grisham novel is given by
Price elasticity of demand=
(New quantity of books−Old quantity of books)
(New quantity ofbooks+Old quantity of books)
( New price for the book −Old price for the book )
( New price for thebook +Old price for the book )
¿ , Price elasticity of demand=
(50−40)
(50+40)
( 25−35)
(25+35)
¿ , Price elasticity of demand=
10
90
−10
60
¿ , Price elasticity of demand =−0.67
Therefore, price elasticity of demand for novels is found as -0.67. It means with unit decline in
price of novel the rise in quantity demanded for the same is lower than proportionate. From the
value it evident that the price elasticity of demand for novel is moderately inelastic and thus fall
Paraphrase This Document
Need a fresh take? Get an instant paraphrase of this document with our AI Paraphraser
4Microeconomics
in price is could not increase the quantity demanded significantly and thus the revenue earned by
the bookstore at new price is lower than it earned at earlier price.
Task 3
(1) Once off fee applied by the federal government on every airplane that are utilized for flights
in domestic regions is a fixed cost to the airline companies because they have to pay the fee and
that cannot be avoided.
(2) The amount of $50 million that Samsung spent on R&D to innovate their next generation
mobile phone is not mandatory. However, if Samsung stops producing mobile phones then they
do not need such expenses and thus the cost is variable.
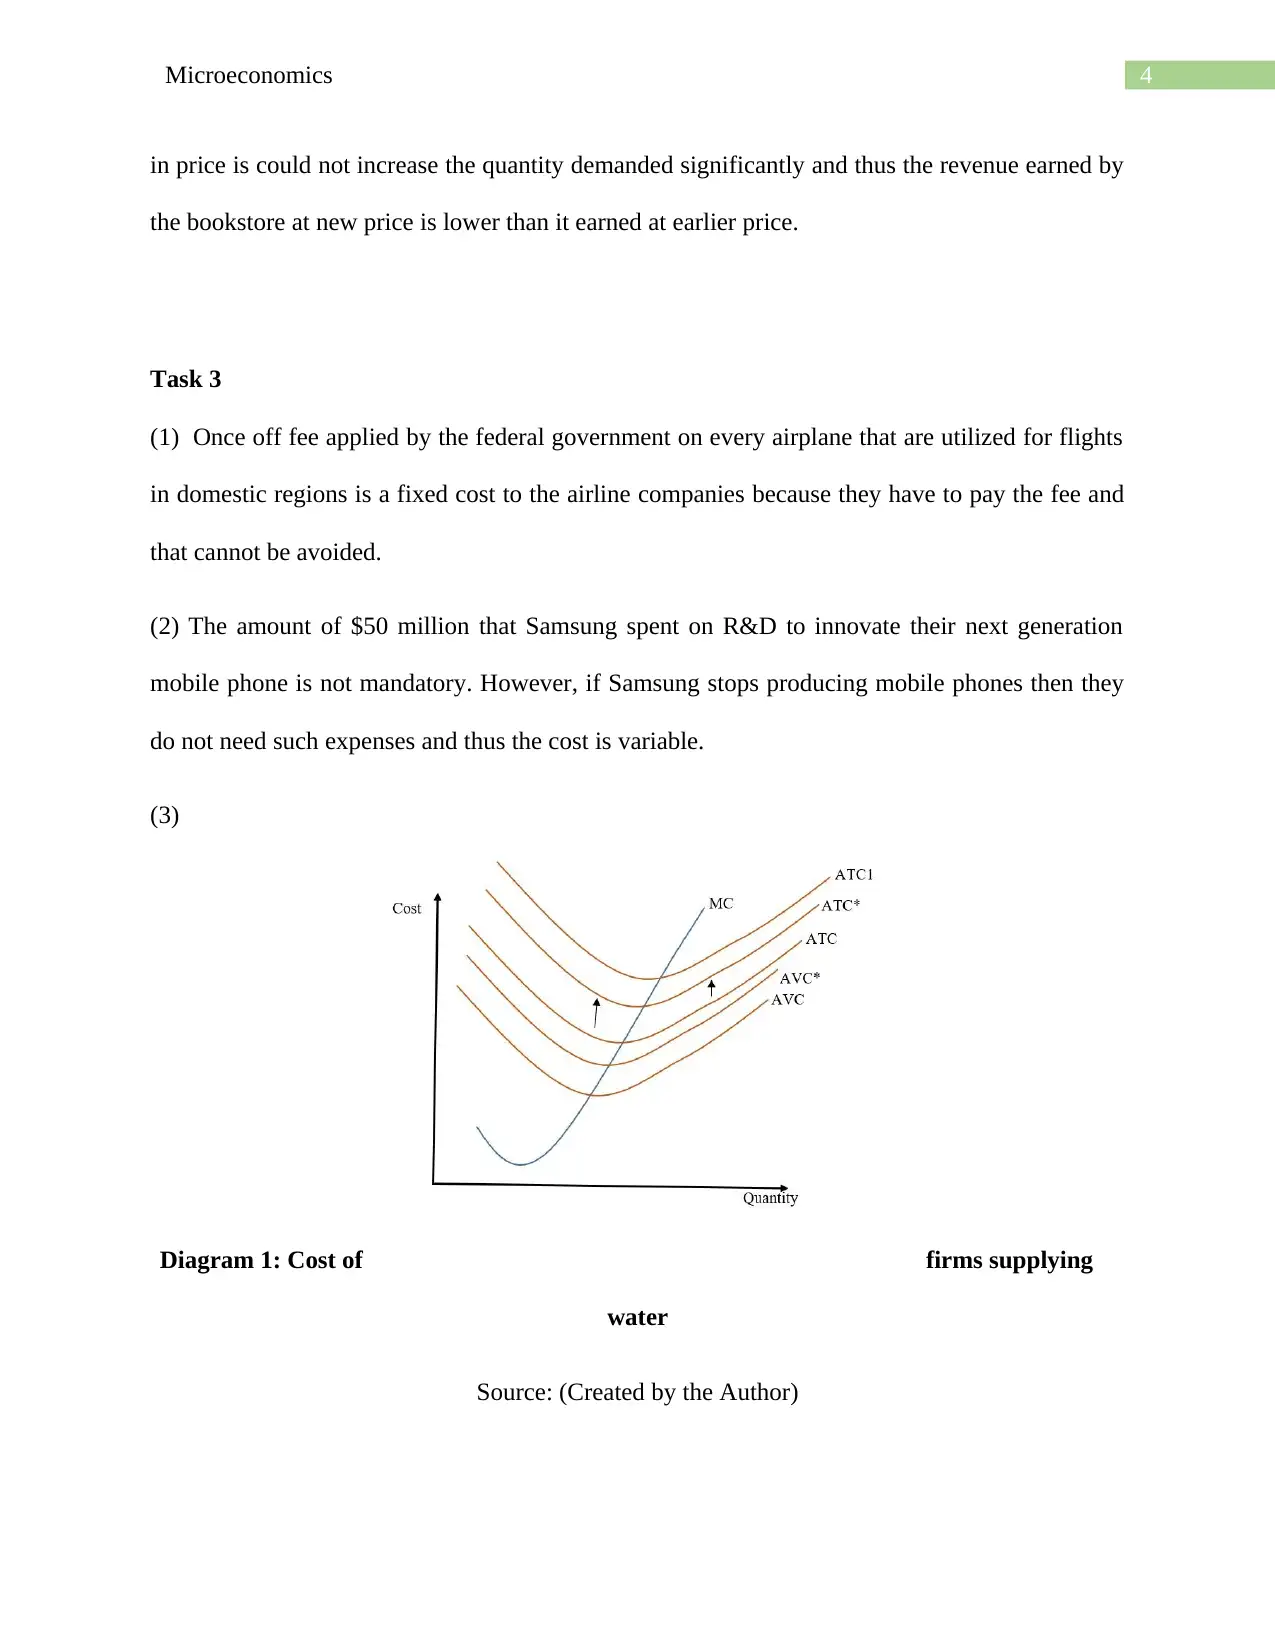
(3)
Diagram 1: Cost of firms supplying
water
Source: (Created by the Author)
in price is could not increase the quantity demanded significantly and thus the revenue earned by
the bookstore at new price is lower than it earned at earlier price.
Task 3
(1) Once off fee applied by the federal government on every airplane that are utilized for flights
in domestic regions is a fixed cost to the airline companies because they have to pay the fee and
that cannot be avoided.
(2) The amount of $50 million that Samsung spent on R&D to innovate their next generation
mobile phone is not mandatory. However, if Samsung stops producing mobile phones then they
do not need such expenses and thus the cost is variable.
(3)
Diagram 1: Cost of firms supplying
water
Source: (Created by the Author)
5Microeconomics
The cost of firms supplying water has increased over the last ten years due to that the
firms has increased the price of water bill. The main reason of cost surge of the firms is due to
sudden increase in cost of water processing and sewage cost. The smooth and undisrupted flow
of water can only be supplied if the supply system is maintained properly. Therefore, the cost
surge was justified and the cost that is borne by the firms were unavoidable and these cost are
variable because these are for improving the supply system. Thus, these cost are avoidable and
stopping supply of water would decrease this part of the cost. Thus, it need to be recovered and
this pressure of cost has been reflected on the price of the water service. The evidence of the
reflection is given by the 91 percent hike in sewerage and water price since 2007. In the above
diagram it can be seen that the both the AVC and ATC curves have shifted upward. The shift in
the ATC curve is however is entirely due to the increase in AVC (Feinberg and Huang 2019). In
the diagram ATC has moved to ATC*, which is equivalent to the amount of movement of AVC
to AVC *. On the other hand the ATC has further moved upward due to the increase in fixed cost
that occurred due to make the city drought proof. In this case the ATC has moved further from
ATC* to ATC1. However, this cost is fixed as it is an one time investment to build the
infrastructure. This cost has been however recovered from the consumers through the last
decade. The main concern in this price hike is the burden on poor because water is a necessary
commodity and its consumption cannot be avoided. Thus, to deal with the problem, the
government should charge extra for consuming over certain threshold and the charge should be
imposed on per extra unit of water consumed. However, initial daily allocation of water should
be exempt to remove the burden from the poor.
⊘ This is a preview!⊘
Do you want full access?
Subscribe today to unlock all pages.
Trusted by 1+ million students worldwide

6Microeconomics
Paraphrase This Document
Need a fresh take? Get an instant paraphrase of this document with our AI Paraphraser
7Microeconomics
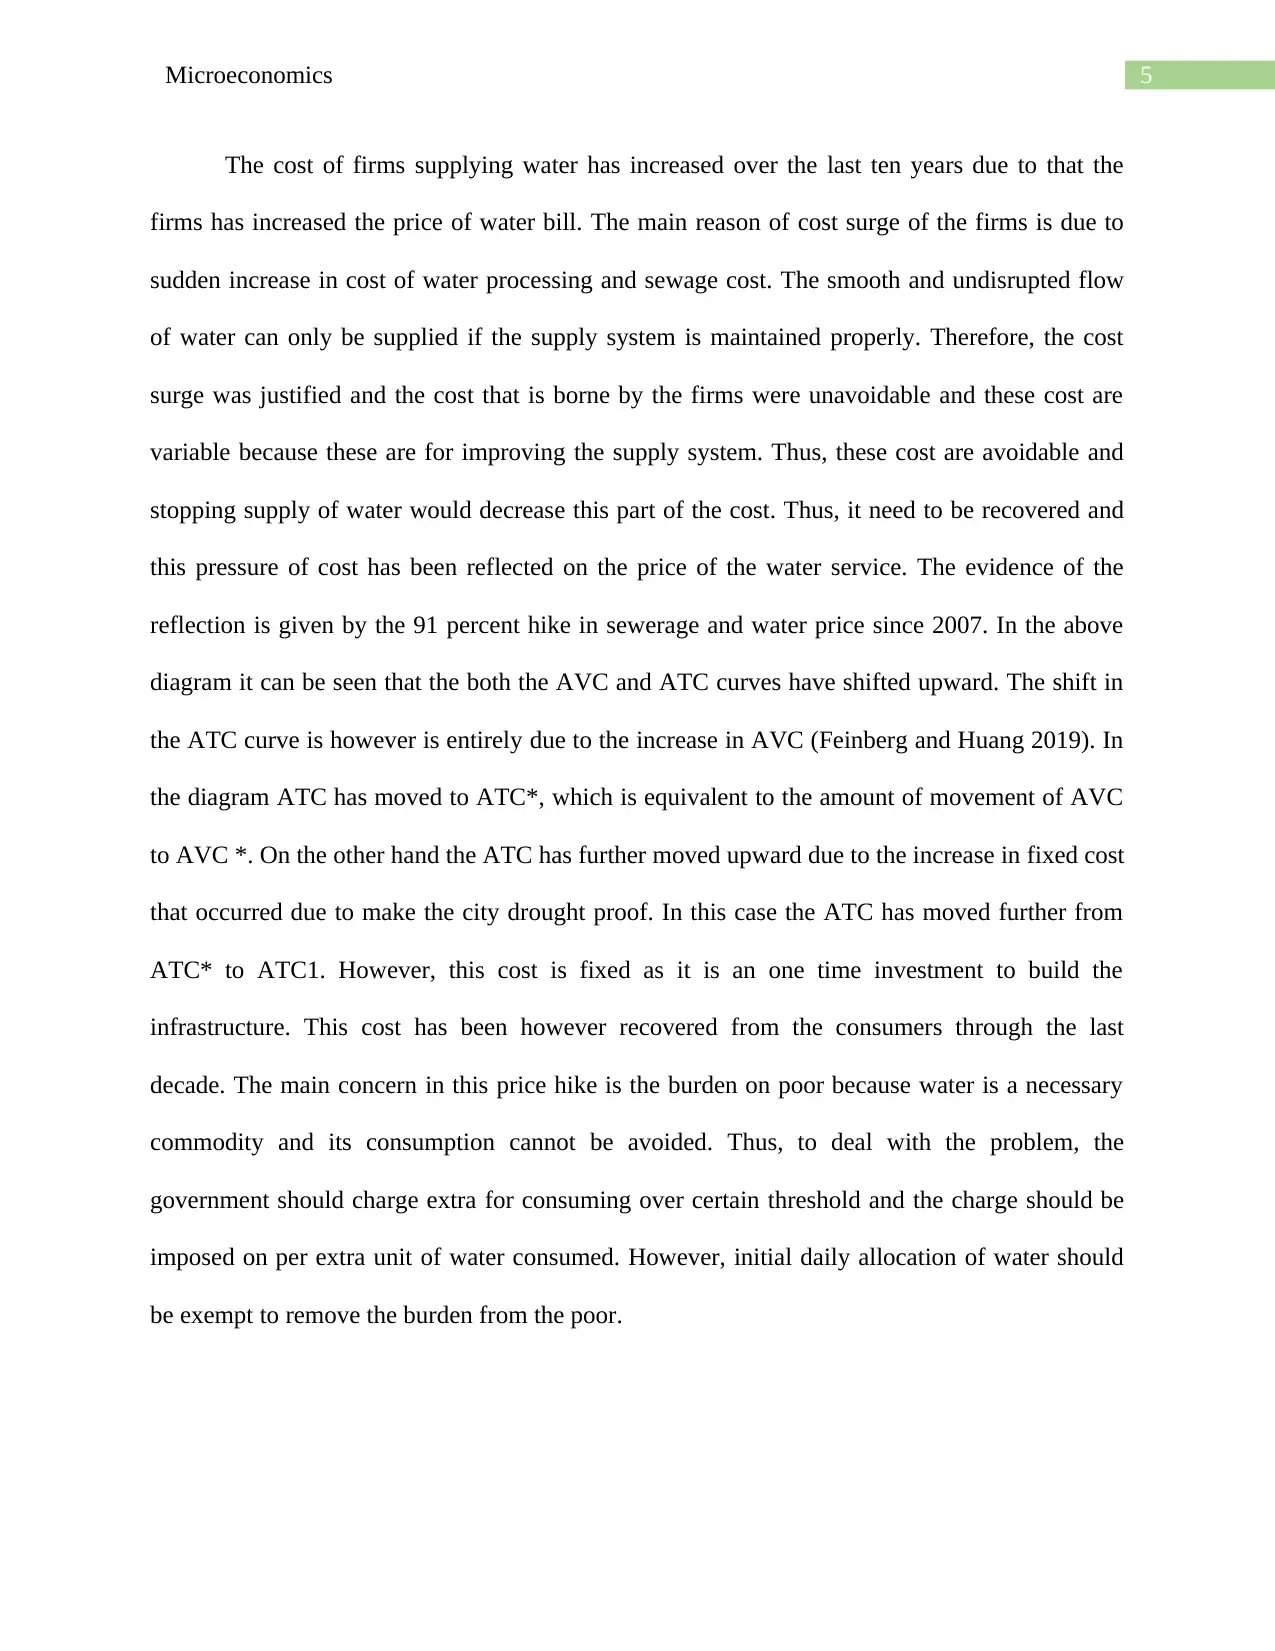
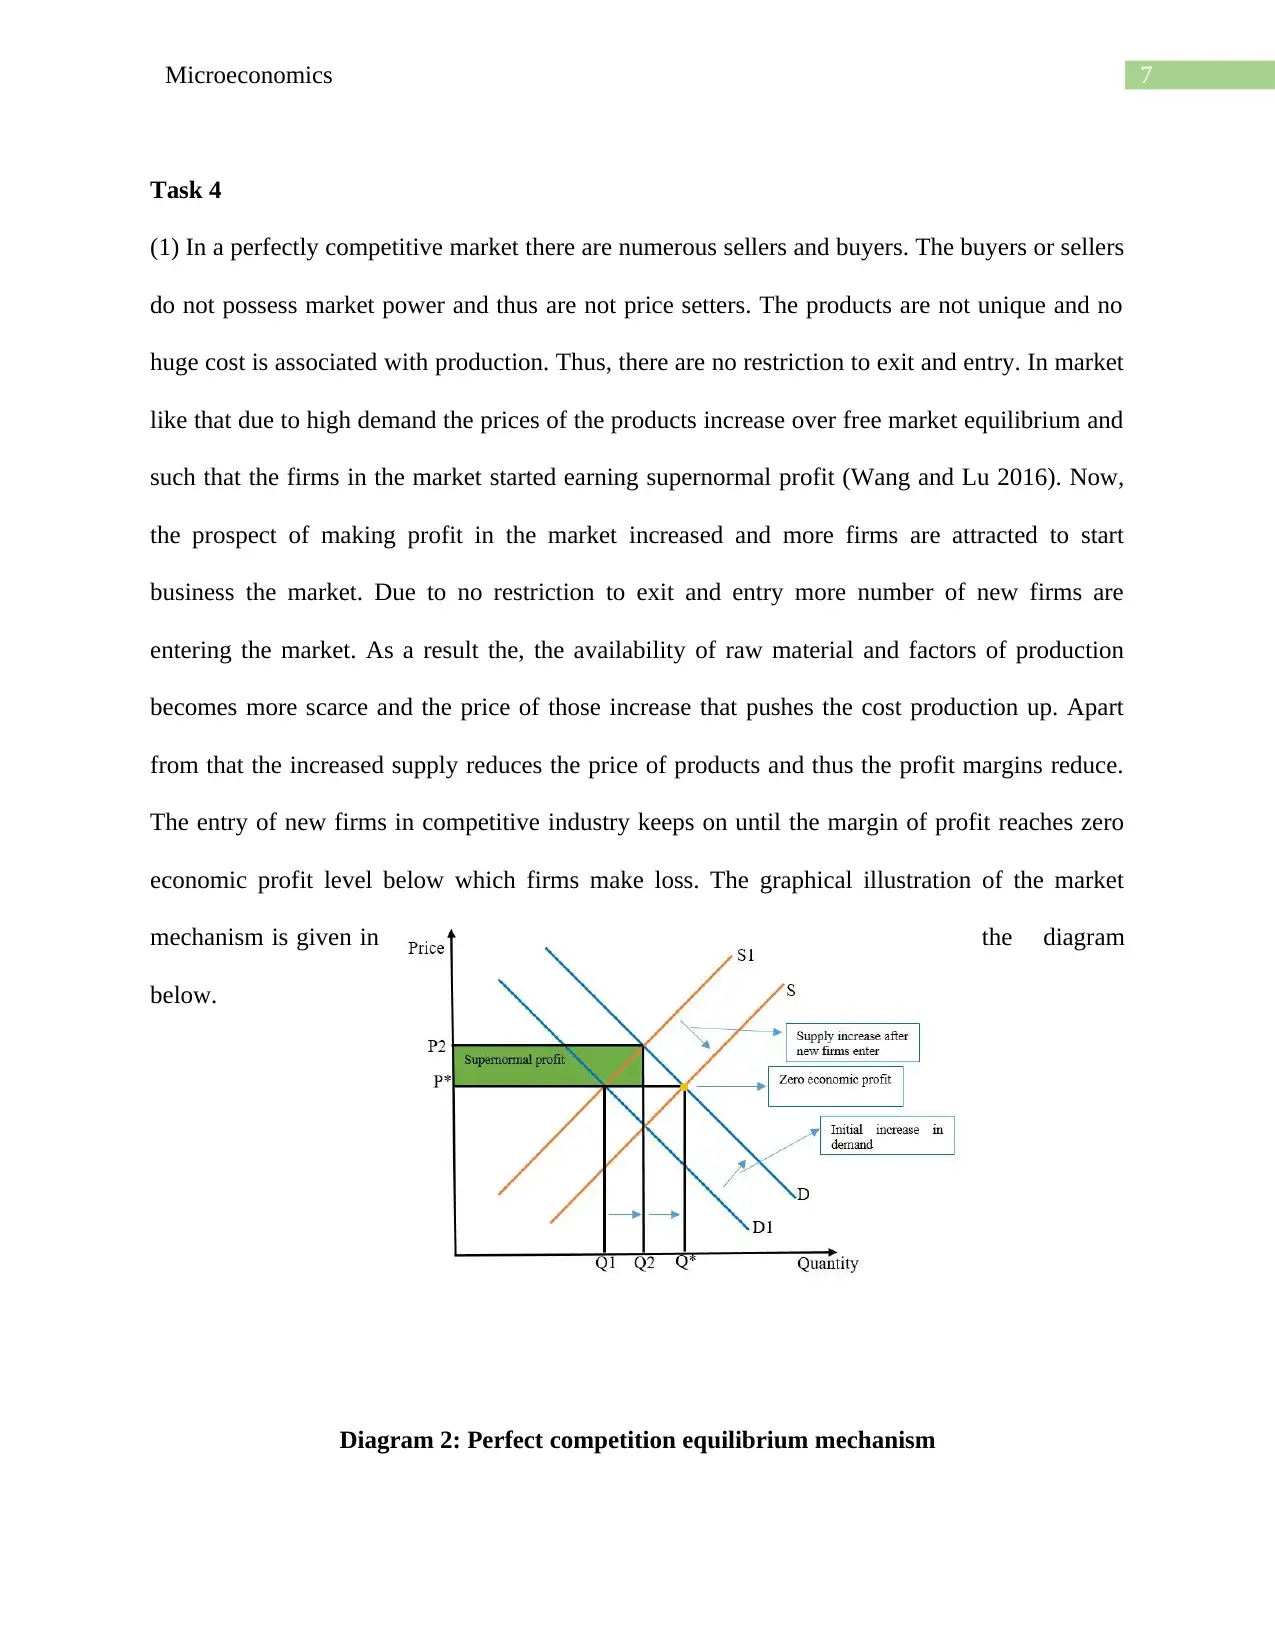
Task 4
(1) In a perfectly competitive market there are numerous sellers and buyers. The buyers or sellers
do not possess market power and thus are not price setters. The products are not unique and no
huge cost is associated with production. Thus, there are no restriction to exit and entry. In market
like that due to high demand the prices of the products increase over free market equilibrium and
such that the firms in the market started earning supernormal profit (Wang and Lu 2016). Now,
the prospect of making profit in the market increased and more firms are attracted to start
business the market. Due to no restriction to exit and entry more number of new firms are
entering the market. As a result the, the availability of raw material and factors of production
becomes more scarce and the price of those increase that pushes the cost production up. Apart
from that the increased supply reduces the price of products and thus the profit margins reduce.
The entry of new firms in competitive industry keeps on until the margin of profit reaches zero
economic profit level below which firms make loss. The graphical illustration of the market
mechanism is given in the diagram
below.
Diagram 2: Perfect competition equilibrium mechanism
8Microeconomics
Source: (Created by the Author)
(2) Network externality is the value a product gains when it is used by a large number of
consumers, in most cases nearly the entire market. This kind of externality is found in monopoly
market (Xu et al. 2018). In telecom industry there occurs natural monopoly or oligopoly and in
these markets number of consumers are very high and are loyal to the brand. It thus increases the
band value so high that even new consumers tends to purchase the goods or service provided by
the firms and avoid any new similar products. However, barrier from network externality can be
surmounted if a new firm enters the market and offers innovative product which is
technologically superior to the existing product and must offer better and distinguishable benefits
to the consumers.
Task 5
(1) Dominant strategy is the kind of business strategy or option that is the best possible option a
firm can make and earn the maximum possible revenue or profit irrespective of the strategy
taken by other and rival firms (Chen and Li 2018). Yes, MLC does have dominant strategy and it
is evident from the given pay-off matrix. MLC when chooses to leave advertising as it is then
given the choice of AC, MLC could earn either $900, 000 or $1, 000, 000. Alternatively,, if
MLC chooses to increase advertising budget given the choice of AC, MLC would have the
earned either $1, 000, 000 or $1, 400, 000. Thus, it is obvious that if MLC chooses to increase
advertising budget then it would benefit more. Therefore m increasing advertising is dominant
strategy for MLC.
⊘ This is a preview!⊘
Do you want full access?
Subscribe today to unlock all pages.
Trusted by 1+ million students worldwide
9Microeconomics
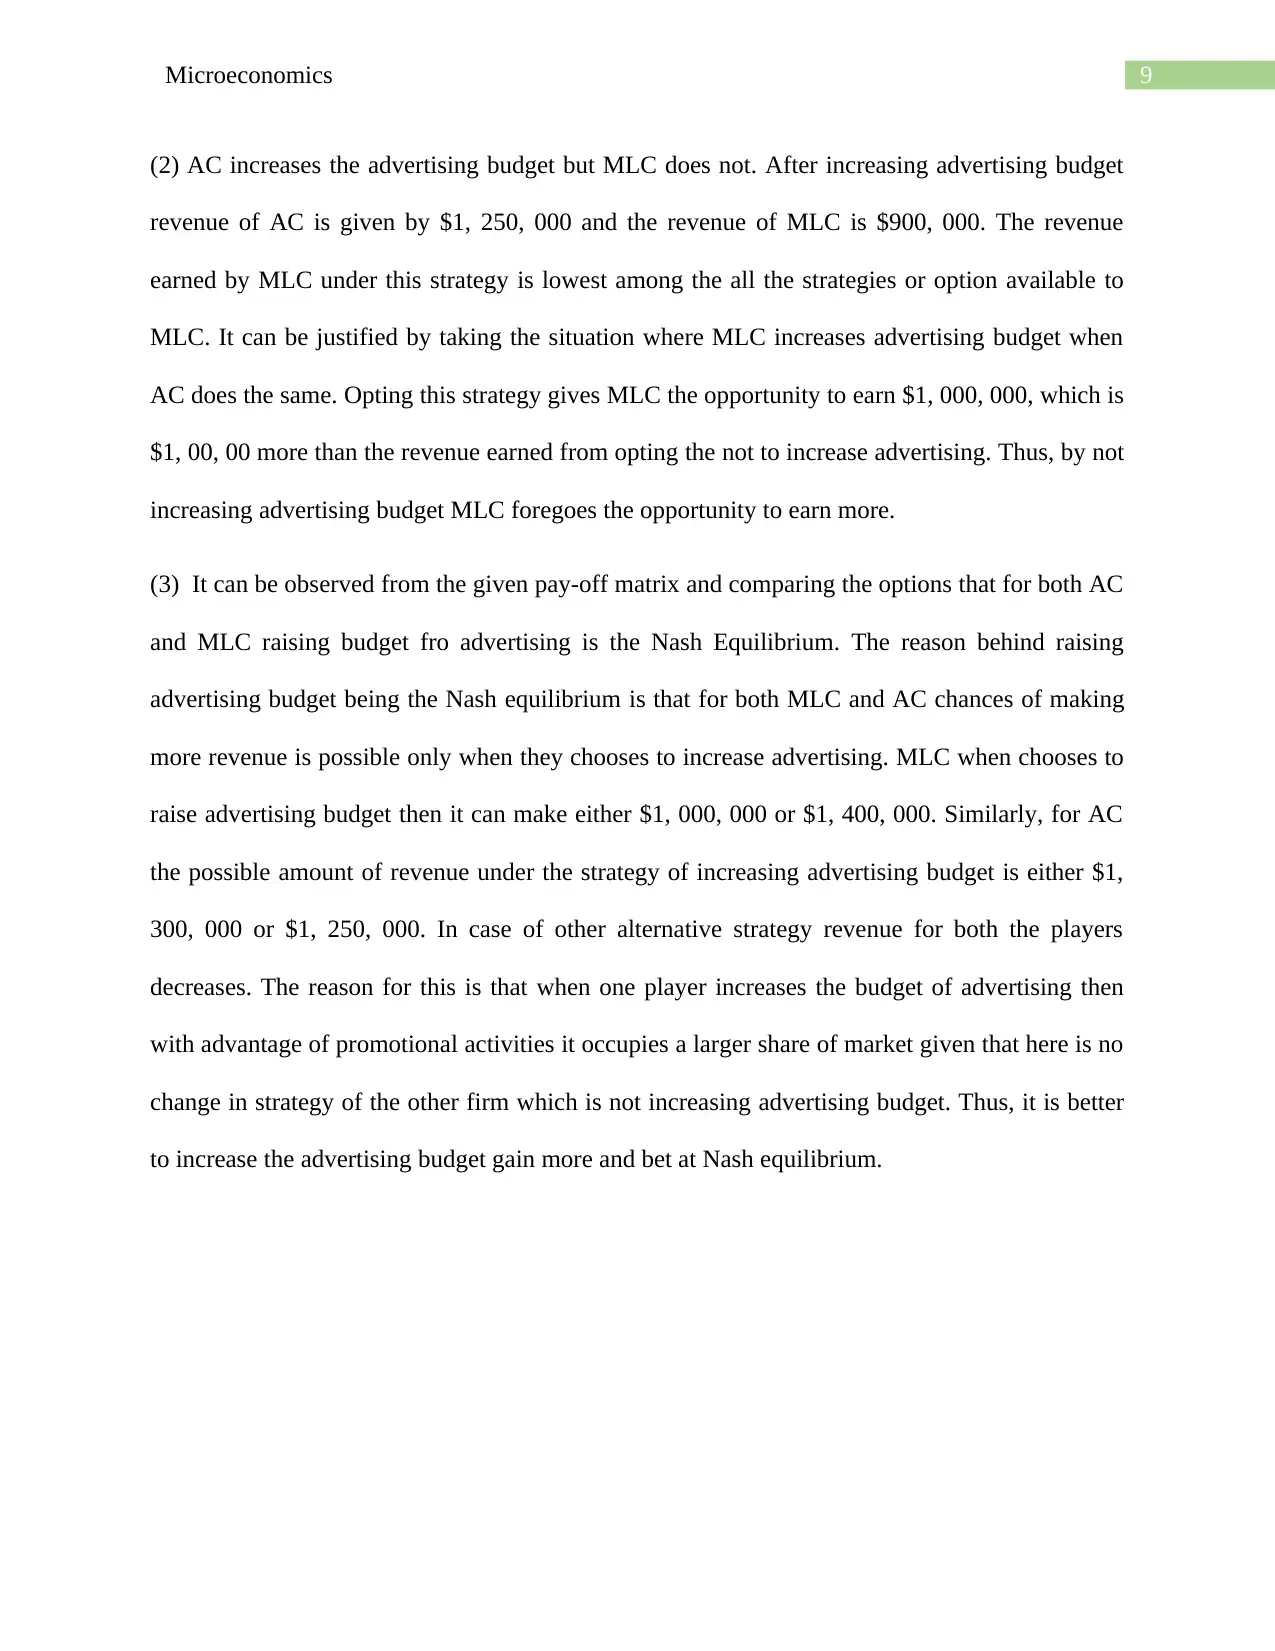
(2) AC increases the advertising budget but MLC does not. After increasing advertising budget
revenue of AC is given by $1, 250, 000 and the revenue of MLC is $900, 000. The revenue
earned by MLC under this strategy is lowest among the all the strategies or option available to
MLC. It can be justified by taking the situation where MLC increases advertising budget when
AC does the same. Opting this strategy gives MLC the opportunity to earn $1, 000, 000, which is
$1, 00, 00 more than the revenue earned from opting the not to increase advertising. Thus, by not
increasing advertising budget MLC foregoes the opportunity to earn more.
(3) It can be observed from the given pay-off matrix and comparing the options that for both AC
and MLC raising budget fro advertising is the Nash Equilibrium. The reason behind raising
advertising budget being the Nash equilibrium is that for both MLC and AC chances of making
more revenue is possible only when they chooses to increase advertising. MLC when chooses to
raise advertising budget then it can make either $1, 000, 000 or $1, 400, 000. Similarly, for AC
the possible amount of revenue under the strategy of increasing advertising budget is either $1,
300, 000 or $1, 250, 000. In case of other alternative strategy revenue for both the players
decreases. The reason for this is that when one player increases the budget of advertising then
with advantage of promotional activities it occupies a larger share of market given that here is no
change in strategy of the other firm which is not increasing advertising budget. Thus, it is better
to increase the advertising budget gain more and bet at Nash equilibrium.
Paraphrase This Document
Need a fresh take? Get an instant paraphrase of this document with our AI Paraphraser
10Microeconomics
List of Reference
Chen, Y.C. and Li, J., 2018. Revisiting the foundations of dominant-strategy
mechanisms. Journal of Economic Theory, 178, pp.294-317.
Feinberg, E.A. and Huang, J., 2019. On the reduction of total‐cost and average‐cost MDPs to
discounted MDPs. Naval Research Logistics (NRL), 66(1), pp.38-56.
Mason, C.F. and Roberts, G., 2018. Price elasticity of supply and productivity: an analysis of
natural gas wells in Wyoming. The Energy Journal, 9(1).
Miller, M. and Alberini, A., 2016. Sensitivity of price elasticity of demand to aggregation,
unobserved heterogeneity, price trends, and price endogeneity: Evidence from US Data. Energy
Policy, 97, pp.235-249.
Wang, Y.B. and Lu, J.R., 2016. A supply-lock competitive market for investable products. Asian
Development Policy Review, 4(4), pp.127-133.
Xu, L., Li, Y., Govindan, K. and Yue, X., 2018. Return policy and supply chain coordination
with network-externality effect. International Journal of Production Research, 56(10), pp.3714-
3732.
1 out of 11
Related Documents


Your All-in-One AI-Powered Toolkit for Academic Success.
+13062052269
info@desklib.com
Available 24*7 on WhatsApp / Email
![[object Object]](/_next/static/media/star-bottom.7253800d.svg)
Unlock your academic potential
Copyright © 2020–2026 A2Z Services. All Rights Reserved. Developed and managed by ZUCOL.