Microeconomics Assignment - University Economics Module, Semester 1

Verified

Added on  2022/10/06

|13
|2095
|123
Homework Assignment
AI Summary
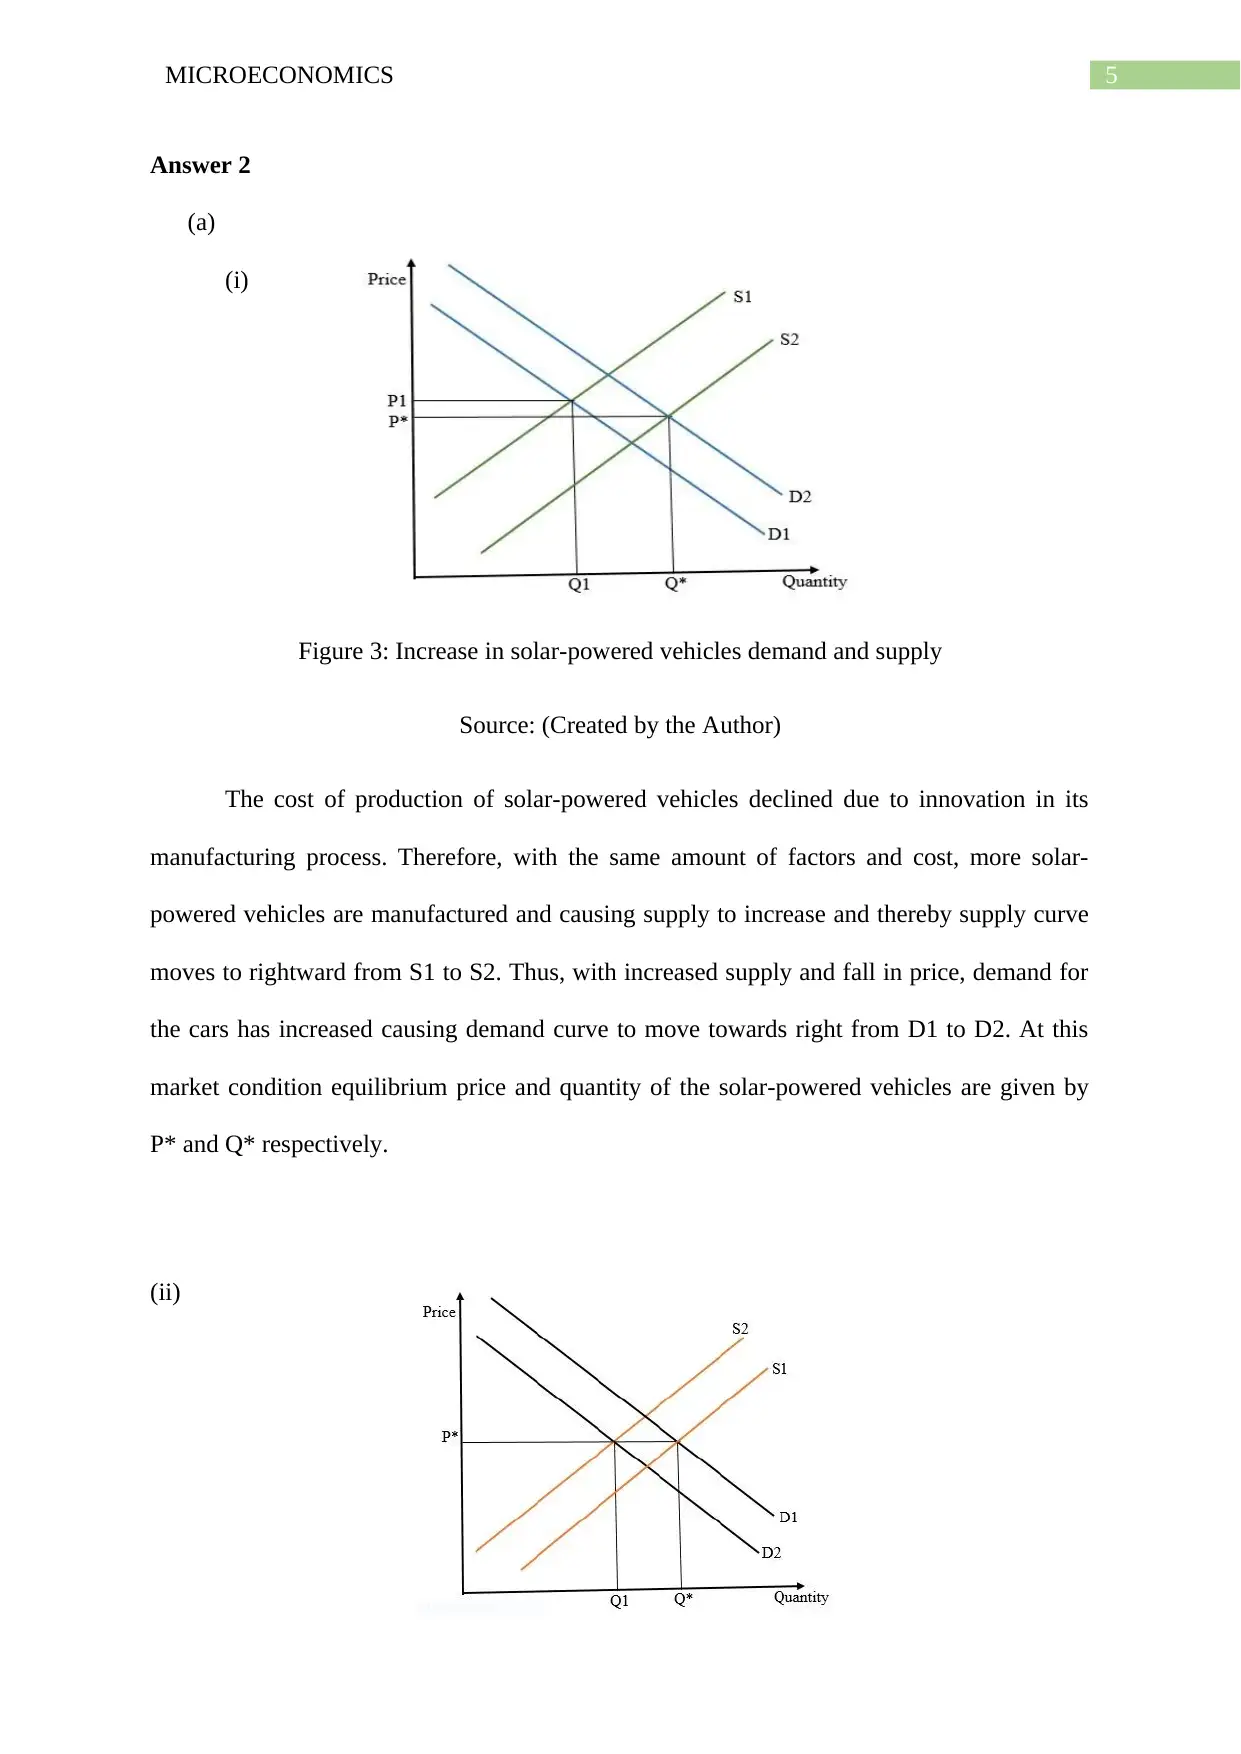
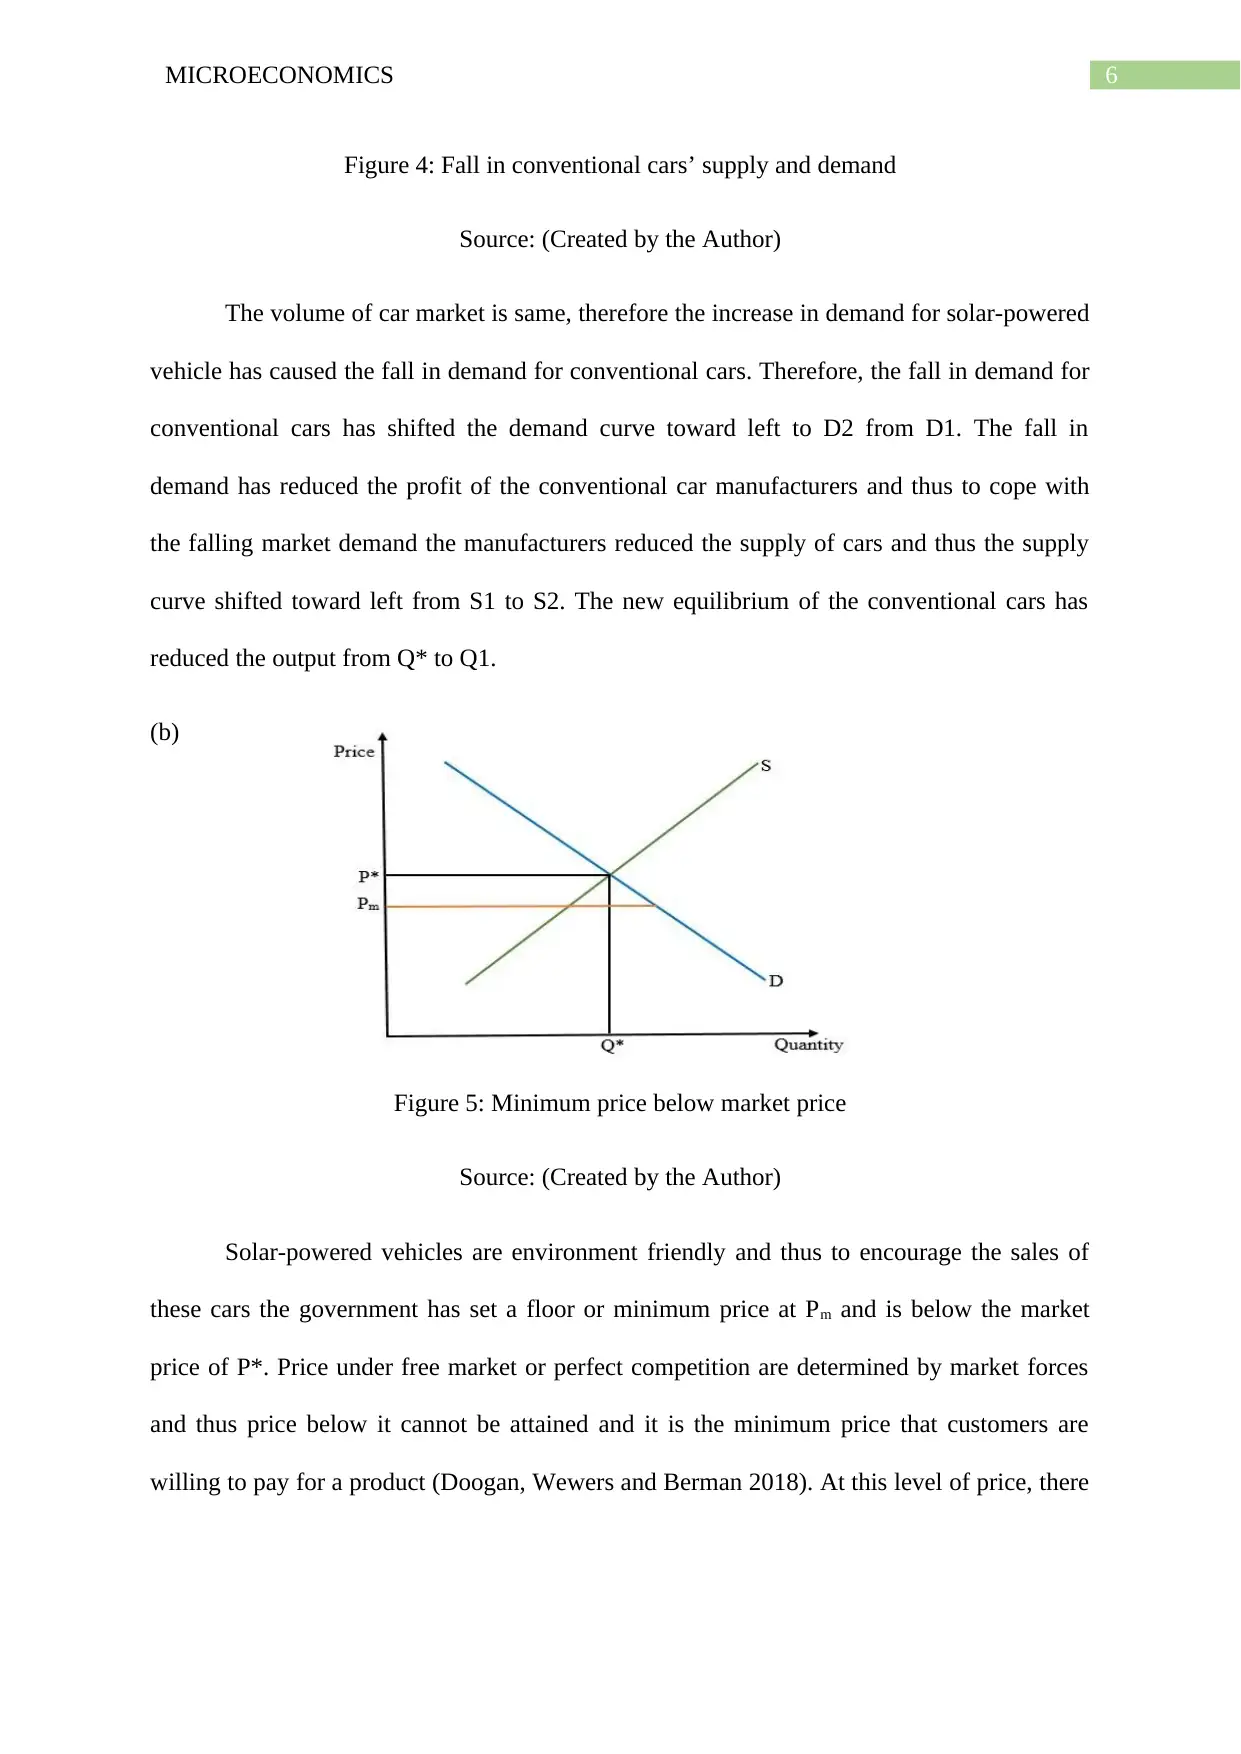
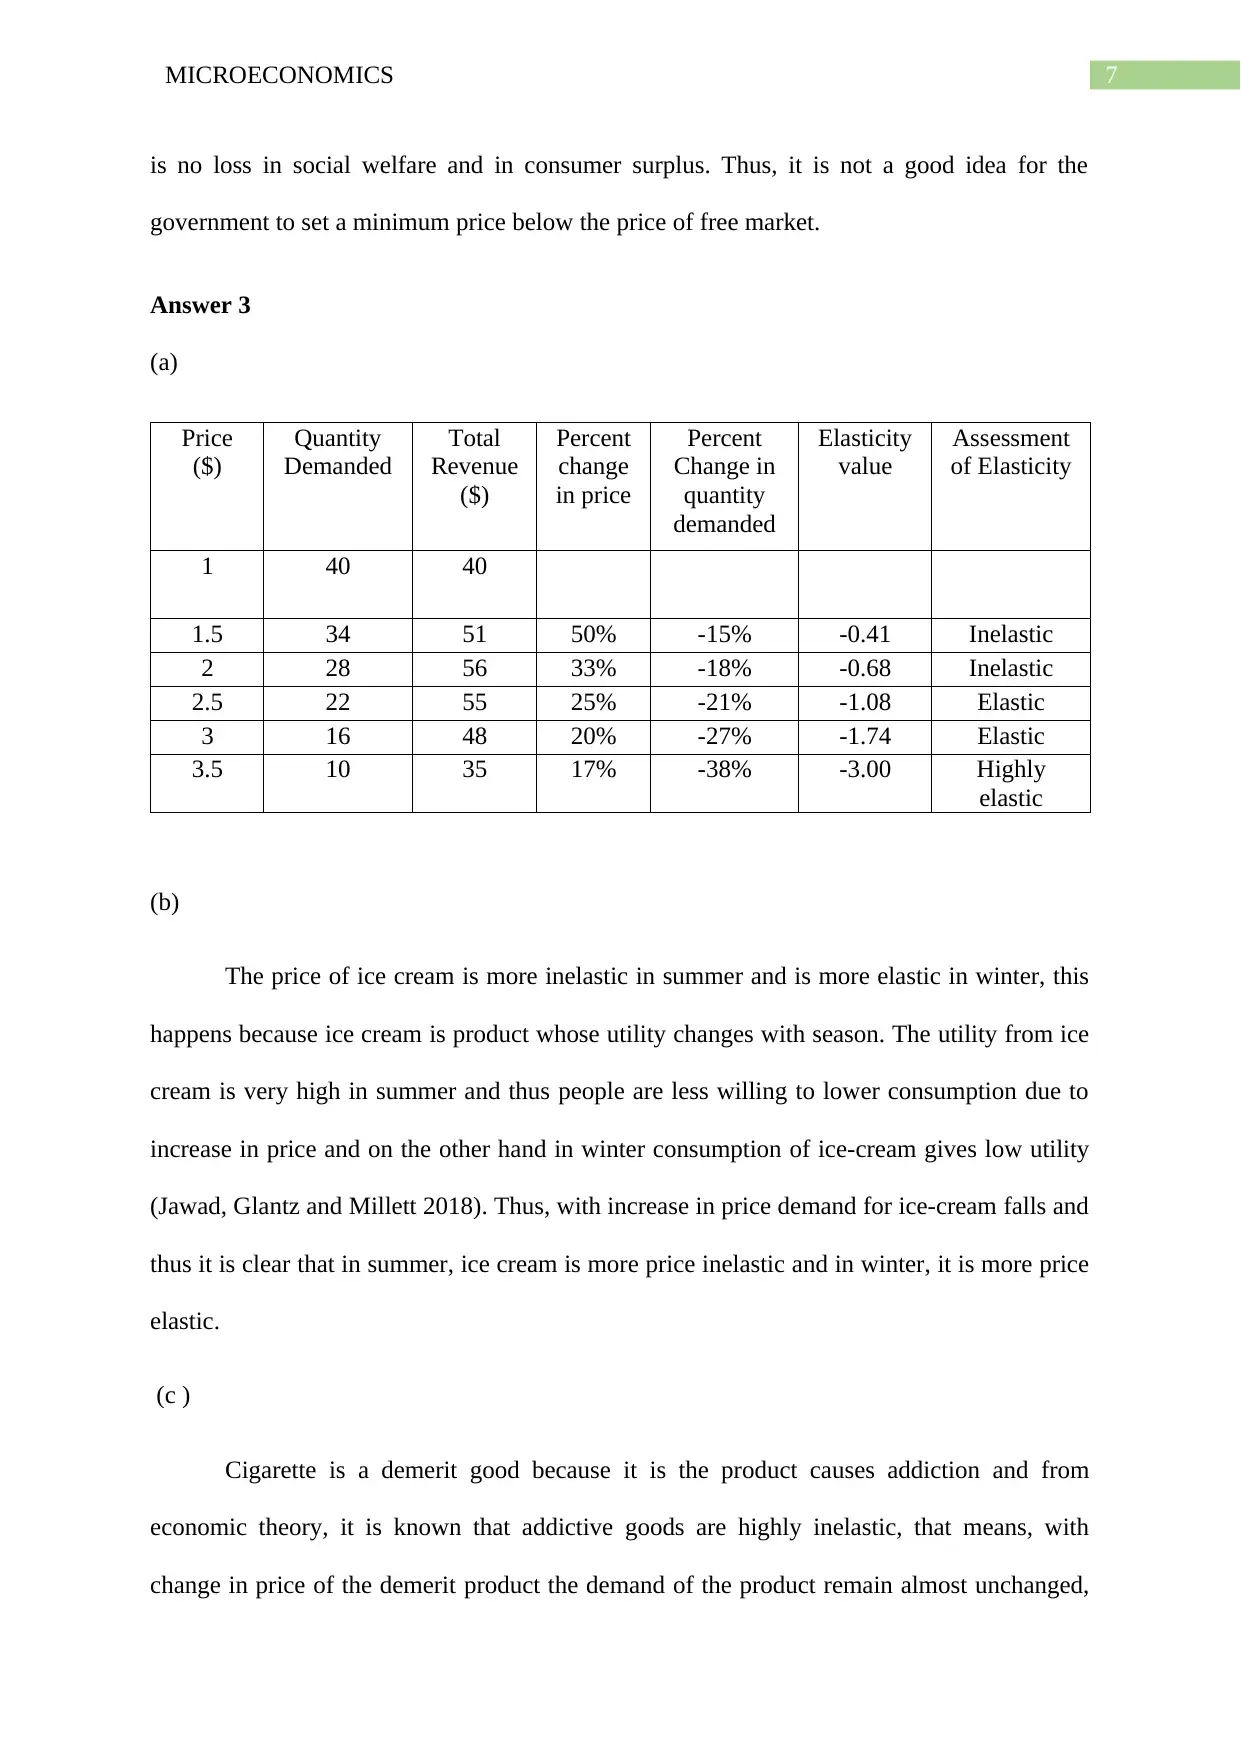
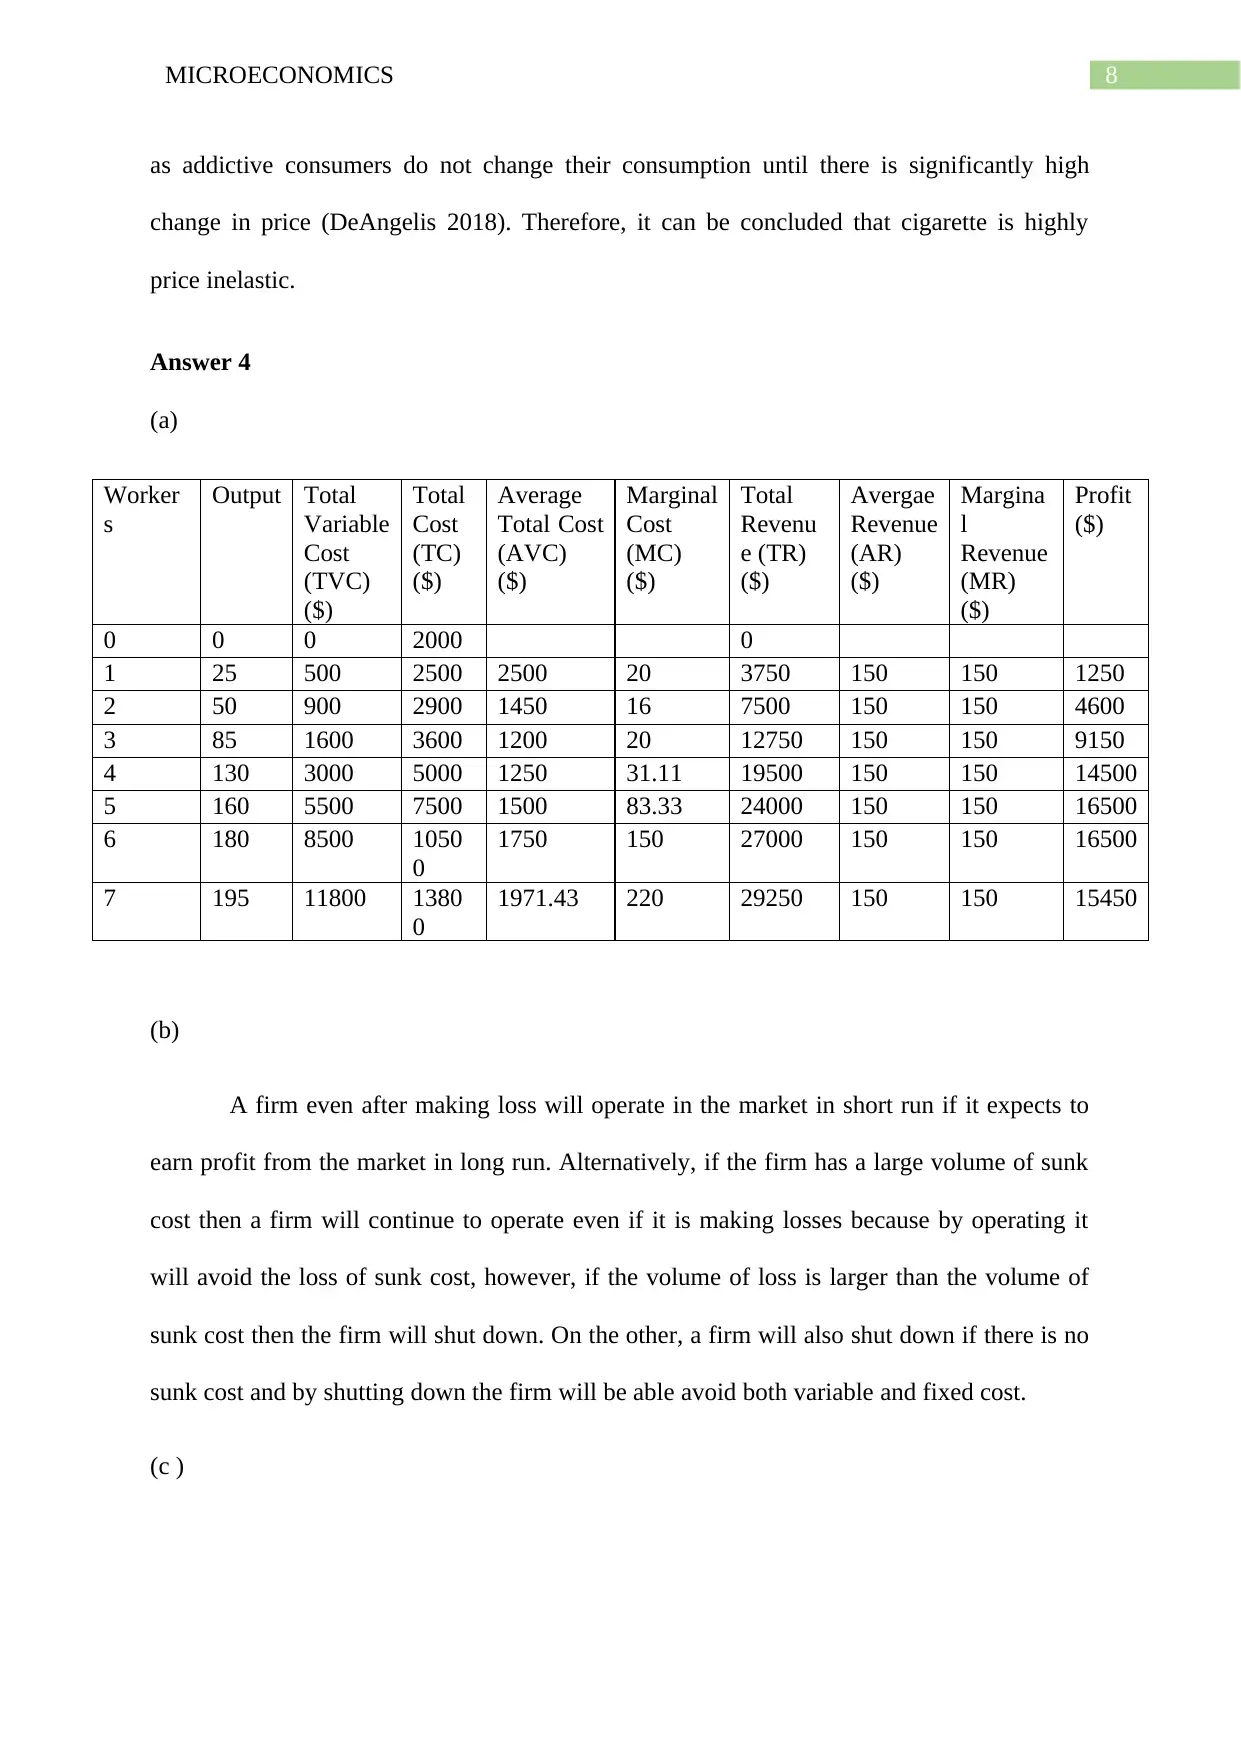
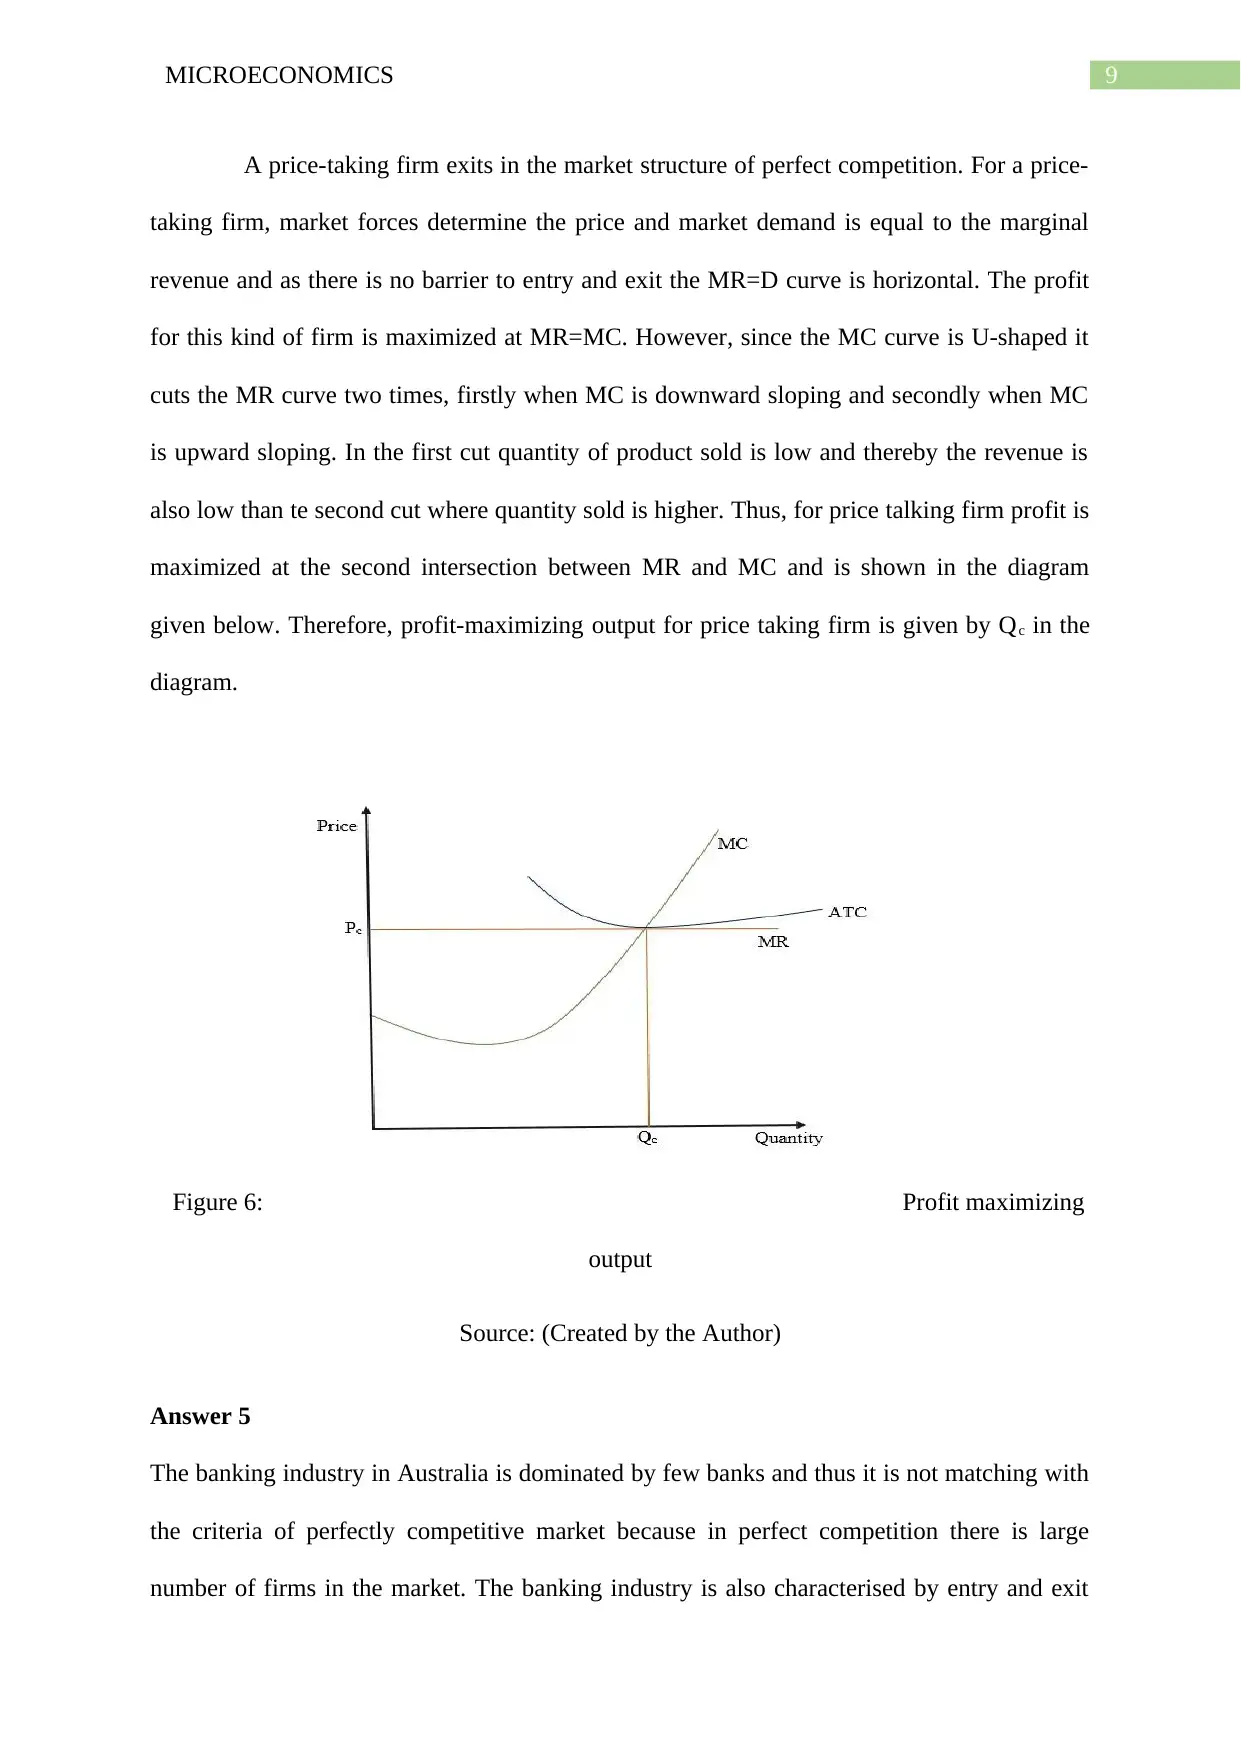
This microeconomics assignment solution analyzes Joan's production possibilities, explaining increasing opportunity cost and constructing a production possibility curve. It further explores market dynamics, examining the effects of supply and demand shifts in solar-powered and conventional car markets, including the impact of government-imposed minimum prices. The assignment delves into elasticity, comparing price elasticity in summer and winter for ice cream and assessing the price elasticity of cigarettes. Cost structures and profit maximization for firms under perfect competition are also examined, along with the market structure of the Australian banking industry and its implications for consumers, comparing it to the telecom industry. The solution provides detailed calculations, graphical representations, and explanations of economic concepts.
Document Page
Running head: MICROECONOMICS
Microeconomics
Name of the Student
Name of the University
Student ID
tabler-icon-diamond-filled.svg

Paraphrase This Document

Need a fresh take? Get an instant paraphrase of this document with our AI Paraphraser
Document Page
1MICROECONOMICS
Table of Contents
Answer 1....................................................................................................................................2
Answer 2....................................................................................................................................5
Answer 3....................................................................................................................................7
Answer 4....................................................................................................................................8
Answer 5..................................................................................................................................10
References................................................................................................................................11
Document Page
2MICROECONOMICS
Answer 1
(a)
Choices
Production
possibilities
Grade (%) Work
(hours per week)
A
B
C
D
E
0
20
40
60
80
60
55
45
30
0
(i)
Figure 1: Production possibility curve of Joan
Source: (Created by the Author)
0 10 20 30 40 50 60 70 80 90
0
10
20
30
40
50
60
70
A
B
C
D
E
Production Possibility Curve
Grade %
Work hours per week
Document Page
3MICROECONOMICS
(ii)
Opportunity cost is the cost a person accrues by opting an option by sacrificing
another feasible option. Now, if this opportunity cost increases with every next choice of an
option then it is known as increasing opportunity cost for the option chosen (Sheng, Qiu and
Zhang 2019). In the table given, it can be observed that as Joan increases her grade by 20%
she loses hours of work at increasing rate, that for first 20% opportunity cost was 5 hours and
for every 205 onwards opportunity cost increased by 10 hours, 15 hours and 30 hours
respectively.
(iii)
Figure 2: Constant Opportunity cost
Source: (Created by the Author)
It has been assumed that if Joan increases her grade by 20% she has to sacrifice 15
hours of work and the opportunity cost will remain same every next 20% increase in grade
percent. It means that from 0 to 20%, 20 to 40%, 40 to 60% and 60 to 80% opportunity cost
will remain same at it will be 15 hours for each increment in %. Therefore, steady and
0 10 20 30 40 50 60 70 80 90
0
10
20
30
40
50
60
70
A
B
C
D
E
Constant Opportunity Cost
Grade %
Work hours per week
tabler-icon-diamond-filled.svg

Paraphrase This Document

Need a fresh take? Get an instant paraphrase of this document with our AI Paraphraser
Document Page
4MICROECONOMICS
constant opportunity cost will generate a PPC with a shape of a straight line, which is the
suitable shape for PPC under this situation.
(iv)
Any combination point inside the PPC is an inefficient point as in these points gives
lower outcome than the points on the PPC, which is easily attainable (Jenyk and Wakefield
2018). Thus, it is better to operate on the PPC and earn optimum outcome than operating
inside PPC.
(v)
Any point of combination outside the PPC cannot be attained ass the skill or resources
available do not allow to operate at that point. Therefore, if Joan wants to operate at a point
outside PPC then that point of operation can only be attained by increasing the skill and
resources such that she can work more in the same amount of time and also can score higher
grade. As a result, the PPC shifts right ward and the point outside the PPC comes on the PPC.
(b)
Scarcity is one of the major fundamental problems of an economy and it is argued that
it give rise to other economic problems (Xenos 2017). Thus, when Joan joined a job with
high salary after remaining unemployed for a year, she will face scarcity problem, as in this
case, resource is the time and it really is limited if Joan has more time she could have invest
the extra time in other activities which she is now sacrificing to do the job. Thus, Joan faces
scarcity problem.
Document Page
5MICROECONOMICS
Answer 2
(a)
(i)
Figure 3: Increase in solar-powered vehicles demand and supply
Source: (Created by the Author)
The cost of production of solar-powered vehicles declined due to innovation in its
manufacturing process. Therefore, with the same amount of factors and cost, more solar-
powered vehicles are manufactured and causing supply to increase and thereby supply curve
moves to rightward from S1 to S2. Thus, with increased supply and fall in price, demand for
the cars has increased causing demand curve to move towards right from D1 to D2. At this
market condition equilibrium price and quantity of the solar-powered vehicles are given by
P* and Q* respectively.
(ii)
Document Page
6MICROECONOMICS
Figure 4: Fall in conventional cars’ supply and demand
Source: (Created by the Author)
The volume of car market is same, therefore the increase in demand for solar-powered
vehicle has caused the fall in demand for conventional cars. Therefore, the fall in demand for
conventional cars has shifted the demand curve toward left to D2 from D1. The fall in
demand has reduced the profit of the conventional car manufacturers and thus to cope with
the falling market demand the manufacturers reduced the supply of cars and thus the supply
curve shifted toward left from S1 to S2. The new equilibrium of the conventional cars has
reduced the output from Q* to Q1.
(b)
Figure 5: Minimum price below market price
Source: (Created by the Author)
Solar-powered vehicles are environment friendly and thus to encourage the sales of
these cars the government has set a floor or minimum price at Pm and is below the market
price of P*. Price under free market or perfect competition are determined by market forces
and thus price below it cannot be attained and it is the minimum price that customers are
willing to pay for a product (Doogan, Wewers and Berman 2018). At this level of price, there
tabler-icon-diamond-filled.svg

Paraphrase This Document

Need a fresh take? Get an instant paraphrase of this document with our AI Paraphraser
Document Page
7MICROECONOMICS
is no loss in social welfare and in consumer surplus. Thus, it is not a good idea for the
government to set a minimum price below the price of free market.
Answer 3
(a)
Price
($)
Quantity
Demanded
Total
Revenue
($)
Percent
change
in price
Percent
Change in
quantity
demanded
Elasticity
value
Assessment
of Elasticity
1 40 40
1.5 34 51 50% -15% -0.41 Inelastic
2 28 56 33% -18% -0.68 Inelastic
2.5 22 55 25% -21% -1.08 Elastic
3 16 48 20% -27% -1.74 Elastic
3.5 10 35 17% -38% -3.00 Highly
elastic
(b)
The price of ice cream is more inelastic in summer and is more elastic in winter, this
happens because ice cream is product whose utility changes with season. The utility from ice
cream is very high in summer and thus people are less willing to lower consumption due to
increase in price and on the other hand in winter consumption of ice-cream gives low utility
(Jawad, Glantz and Millett 2018). Thus, with increase in price demand for ice-cream falls and
thus it is clear that in summer, ice cream is more price inelastic and in winter, it is more price
elastic.
(c )
Cigarette is a demerit good because it is the product causes addiction and from
economic theory, it is known that addictive goods are highly inelastic, that means, with
change in price of the demerit product the demand of the product remain almost unchanged,
Document Page
8MICROECONOMICS
as addictive consumers do not change their consumption until there is significantly high
change in price (DeAngelis 2018). Therefore, it can be concluded that cigarette is highly
price inelastic.
Answer 4
(a)
Worker
s
Output Total
Variable
Cost
(TVC)
($)
Total
Cost
(TC)
($)
Average
Total Cost
(AVC)
($)
Marginal
Cost
(MC)
($)
Total
Revenu
e (TR)
($)
Avergae
Revenue
(AR)
($)
Margina
l
Revenue
(MR)
($)
Profit
($)
0 0 0 2000 0
1 25 500 2500 2500 20 3750 150 150 1250
2 50 900 2900 1450 16 7500 150 150 4600
3 85 1600 3600 1200 20 12750 150 150 9150
4 130 3000 5000 1250 31.11 19500 150 150 14500
5 160 5500 7500 1500 83.33 24000 150 150 16500
6 180 8500 1050
0
1750 150 27000 150 150 16500
7 195 11800 1380
0
1971.43 220 29250 150 150 15450
(b)
A firm even after making loss will operate in the market in short run if it expects to
earn profit from the market in long run. Alternatively, if the firm has a large volume of sunk
cost then a firm will continue to operate even if it is making losses because by operating it
will avoid the loss of sunk cost, however, if the volume of loss is larger than the volume of
sunk cost then the firm will shut down. On the other, a firm will also shut down if there is no
sunk cost and by shutting down the firm will be able avoid both variable and fixed cost.
(c )
Document Page
9MICROECONOMICS
A price-taking firm exits in the market structure of perfect competition. For a price-
taking firm, market forces determine the price and market demand is equal to the marginal
revenue and as there is no barrier to entry and exit the MR=D curve is horizontal. The profit
for this kind of firm is maximized at MR=MC. However, since the MC curve is U-shaped it
cuts the MR curve two times, firstly when MC is downward sloping and secondly when MC
is upward sloping. In the first cut quantity of product sold is low and thereby the revenue is
also low than te second cut where quantity sold is higher. Thus, for price talking firm profit is
maximized at the second intersection between MR and MC and is shown in the diagram
given below. Therefore, profit-maximizing output for price taking firm is given by Qc in the
diagram.
Figure 6: Profit maximizing
output
Source: (Created by the Author)
Answer 5
The banking industry in Australia is dominated by few banks and thus it is not matching with
the criteria of perfectly competitive market because in perfect competition there is large
number of firms in the market. The banking industry is also characterised by entry and exit
tabler-icon-diamond-filled.svg

Paraphrase This Document

Need a fresh take? Get an instant paraphrase of this document with our AI Paraphraser
Document Page
10MICROECONOMICS
barriers. The major banks if collude with each other the banks will then charge high price for
lower amount of product. Hence, the market structure of banking industry in Australia is
close to the monopoly market structure. Therefore, the market structure of the banking
industry is harmful for the consumers due to existence of consumer surplus loss and social
welfare loss in the form of deadweight loss (Levy, Norton and Smith 2016). However, there
are many industries, that share same structure as the banking industry of Australia and one
example of such industry is telecom industry.
Document Page
11MICROECONOMICS
References
DeAngelis, C.A., 2018. Is Public Schooling a Public Good? An Analysis of Schooling
Externalities. Policy Analysis No. 842. Cato Institute.
Doogan, N.J., Wewers, M.E. and Berman, M., 2018. The impact of a federal cigarette
minimum pack price policy on cigarette use in the USA. Tobacco control, 27(2), pp.203-208.
Jawad, M., Lee, J.T., Glantz, S. and Millett, C., 2018. Price elasticity of demand of non-
cigarette tobacco products: a systematic review and meta-analysis. Tobacco control, 27(6),
pp.689-695.
Jenyk, S. and Wakefield, D., 2018. Guns, Butter, and Dr. Seuss: Using Political Cartoons to
Teach the PPC. Journal of Economics Teaching, 2(2), pp.79-91
Levy, H., Norton, E.C. and Smith, J.A., 2016. Tobacco Regulation and Cost-Benefit
Analysis: How Should We Value Foregone Consumer Surplus? (No. w22471). National
Bureau of Economic Research.
Sheng, J., Qiu, H. and Zhang, S., 2019. Opportunity cost, income structure, and energy
structure for landholders participating in payments for ecosystem services: Evidence from
Wolong National Nature Reserve, China. World Development, 117, pp.230-238.
Xenos, N., 2017. Scarcity and modernity. Routledge.
chevron_up_icon
1 out of 13
circle_padding
hide_on_mobile
zoom_out_icon
[object Object]