Economic Analysis of Costadema Ltd: Business Report on Microeconomics
VerifiedAdded on 2022/08/24
|21
|4212
|31
Report
AI Summary
This comprehensive business report analyzes the microeconomic factors affecting Costadema Ltd., a manufacturing company. It explores opportunity cost, price elasticity of demand, and their impact on pricing strategies. The report calculates equilibrium price and quantity, assesses the effects of government price controls and market regulations, and computes revenue, profit, and break-even points. It also evaluates the role of financial institutions during crises and discusses money supply's impact on business funding, imports, and exports. The analysis covers both short-run and long-run costs, offering insights for financial analysts to inform strategic development and understand the effects of economic conditions on the company's future.
Running head: ECONOMIC BUSINESS REPORT
Economic Business Report
Name of the Student
Name of the University
Student ID
Economic Business Report
Name of the Student
Name of the University
Student ID
Paraphrase This Document
Need a fresh take? Get an instant paraphrase of this document with our AI Paraphraser
1ECONOMIC BUSINESS REPORT
Executive Summary
The business report discussed several aspects of economic theories of microeconomics
and macroeconomics and thereby explained how these are relevant to an organization strategy
formulation overall development and sustainability of the organization. The operations of the
organization is highly dependent on the concepts of demand, supply, production cost and other
factors. The impact of financial institution play a vital role behind the development of
organizations in an economy as they are the sole provider of funds and last but not the least,
money supply indicates various movements inside an economy and thus it is important for an
organization for its development.
2ECONOMIC BUSINESS REPORT
Table of Contents
Introduction......................................................................................................................................4
Task I...............................................................................................................................................5
Opportunity Cost and resource allocation...................................................................................5
Price elasticity of the product and its impact on pricing strategy of Costadema Ltd..................6
Task II..............................................................................................................................................7
Relationship between good Y and good X..................................................................................7
Reduced demand function of good Y..........................................................................................7
Calculation of equilibrium price and quantity.............................................................................8
Graphical representation of the equilibrium price and quantity..................................................9
Effect of government decision of fixing price at 8 GBP.............................................................9
Effect of change in regulation of market on demand and supply of the company....................10
Task III...........................................................................................................................................11
Fixed cost...................................................................................................................................11
Variable cost..............................................................................................................................11
Marginal cost.............................................................................................................................11
Revenue function.......................................................................................................................11
Profit function............................................................................................................................12
Computation of breakeven point...............................................................................................12
Significance of breakeven point................................................................................................12
⊘ This is a preview!⊘
Do you want full access?
Subscribe today to unlock all pages.
Trusted by 1+ million students worldwide
3ECONOMIC BUSINESS REPORT
Impact of long run and short run cost on profitability of an organization.................................13
Task IV..........................................................................................................................................14
Evaluation of role of financial institution during financial crisis..............................................14
Role of Westpac during financial crisis.....................................................................................15
Concept of money supply and future strategy of the organization............................................15
Conclusion.....................................................................................................................................16
Reference.......................................................................................................................................18
Paraphrase This Document
Need a fresh take? Get an instant paraphrase of this document with our AI Paraphraser
4ECONOMIC BUSINESS REPORT
Introduction
The report the analyses several economic factors of a medium sized manufacturing
company named Costadema Ltd. The product of the company is costing machines. It is known
from the economic theory that resources are limited and demands are unlimited thus there exists
economic problem of resource allocation and scarcity. The report analyses relevancy of these
economic problem for the company. Along with that the analysis of the impact of the price
elasticity of demand of the product on the pricing strategy of the company under different market
conditions. The further considers the demand and supply function of the company and thereby
calculates its equilibrium price and quantity. It is observed that the government has fixed the
price of the product at 8 GBP and thus the impact of this decision of the government on the
supply and quantity demand of the product is a part of analysis in this report. Emphasis is given
on the influence of change in market regulation too. In addition to the above mentioned
discussion, the report includes the computation of revenue and profit function of the company
and along with focus on the break-even point, region of losses and profits, maximum output is
being given. The financial analysts can refer to the report to become aware of the impact of
different short and long term cost on the profitability of the organization before making any
strategic development in the future. The report further discusses the role of various financial
institutions in the period of financial crisis. With that, it explains the concept of money supply
and its relationship with business funding and its role in the area of exports and imports. This is
done in order to organization understands the importance of uncertain economic conditions that
may affect the future strategies of the company especially in the case of imports and exports.
5ECONOMIC BUSINESS REPORT
Task I
Opportunity Cost and resource allocation
Theory of economics explains the concept of opportunity cost as the cost which accrued
by an individual or firm when it chooses one option over the other (Buchanan 2017). It means
that if there are two mutually exclusive products options available with certain amount of return
for each then a firm manufacturing one product has to sacrifice the possible return from the other
(Zamora et al. 2019). This, foregone amount of return is the opportunity cost to the firm.
Therefore, the calculation of opportunity cost can be done by subtracting the return of option
chosen from rerun of option not chosen. The formula of opportunity cost thus can be given by
Opportunity cost=Returnof option not chosen−Return of option chosen
For example, suppose and firm has a certain amount of resource by which it can either produce
mobile phones or cars. The return from manufacturing of cars is 100 GBP and that of mobile
phones is 75GBP. The firm choses to produce mobile phones and thus makes by using the above
formula it can be calculated that the opportunity cost of the firm is 25 GBP (Yang et al. 2018).
Therefore, it can be inferred that the firm made a bad decision by choosing the option of
manufacturing mobile phones as the opportunity cost is positive. Thus, opportunity cost helps to
understand in which option a firm should invest to make profit (Xenos 2017). Therefore,
opportunity cost is highly relevant to business organizations. Opportunity cost in business is
termed under implicit cost. The performance of a business depends on the risk and return of
investment it has made (Lemley 2019). Thus, when choosing one option it is necessary for a firm
to understand the risk and return associated with it and should consider the similar things for the
alternative option available (Simonsen 2018). Therefore, the business decision of a firm depends
on the opportunity cost of the options available and the firm should choose the one with lowest
⊘ This is a preview!⊘
Do you want full access?
Subscribe today to unlock all pages.
Trusted by 1+ million students worldwide
6ECONOMIC BUSINESS REPORT
opportunity cost as it will provide the highest benefit (Herrera and Botero 2016). It should be
noted that less the cost more is the profit.
Price elasticity of the product and its impact on pricing strategy of Costadema Ltd.
Price elasticity of a product is the response of its quantity demanded to the change of its
price. According to general economic theory with fall in price quantity demanded of product
falls and vice versa (Kowalski 2016). However, it has been observed that the fall or rise in
demand with rise or fall in price is not same for every product or in every case. This varying
response of demand to the change in price brings in the concept of price elasticity (Geneus
2018). In popular economics, price elasticity related to demand is termed as price elasticity of
demand. The formula of price elasticity of demand is given by
Price elasticty of demand (PED)=
∆ Demand
Demand
∆ Price
Price
Price elasticity of demand can be categorized in 5 different parts depending in the responsiveness
of the demand or the value of the elasticity (Liang et al. 2017). The types of price elasticity are
perfectly elastic, relatively elastic, unit elastic, relatively inelastic and perfectly inelastic.
Perfectly inelastic: In case of perfectly inelastic, there is no change in quantity demanded with
change in price. (PED=0)
Relatively inelastic: The percentage change in demand is lower than the percentage change
price. (PED<1
Unit elastic: The percentage change in demand is equal to the percentage change in price.
(PED=1)
Paraphrase This Document
Need a fresh take? Get an instant paraphrase of this document with our AI Paraphraser
7ECONOMIC BUSINESS REPORT
Relatively elastic: Percentage change in demand is higher than percentage change in price.
(PED=1)
Perfectly elastic: Percentage change in demand is maximum with minimum percentage change
in price. (PED=∞)
Therefore, it is beneficial for Costadema Ltd to have knowledge about price elasticity
because if the value of PED is lower than one then the company could raise price without
considering the change in demand as with increase in price total revenue and thereby the profit of
the company will increase (Manganelli 2016). However, if the value PED is greater than one
then increasing price would be harmful as it would mower revenue and profit for the company.
Therefore, it can be inferred that price elasticity plays a vital role in making price strategy of an
organization.
Task II
Relationship between good Y and good X
The relationship between the good Y and good X can be derived from the demand
function of good Y. The demand function of good Y is given as
Qd Y =100−10 PY + 20 PX +0.1 M
It is evident from the equation that with rise in price (PX) of good X the demand for good
Y increases. Therefore, from the concept of microeconomics it can be said that good Y and good
X are substitute to each other because in case of substitute goods the rise in price of one good
increases the demand for the other good.
8ECONOMIC BUSINESS REPORT
Reduced demand function of good Y
It is given that, M=20,000 and PX=10, so the reduced demand function can be written as
Qd Y =100−10 PY + 20(10)+ 0.1(20000)
¿ , Qd Y =100−10 PY +200+ 2000
¿ , Qd Y =2300−10 PY
Calculation of equilibrium price and quantity
Reduced demand function:
Qd Y =2300−10 PY
Supply function:
Qs Y =1300+ 90 P
¿ , Qs Y =1300+ 90 PY
At equilibrium, demand and supply are equal. Therefore,
Qd Y =Qs Y
¿ , 2300−10 PY =1300+90 PY
¿ , 2300−1300=10 PY +90 PY
¿ , 1000=100 PY
¿ , PY =10
Hence, equilibrium price is 10GBP.
Therefore, at price 10 GBP of good Y the equilibrium quantity is given by
⊘ This is a preview!⊘
Do you want full access?
Subscribe today to unlock all pages.
Trusted by 1+ million students worldwide
9ECONOMIC BUSINESS REPORT
Qd Y =2300−10 PY
¿ , Qd Y =2300−10(10)
¿ , Qd Y =2300−100
¿ , Qd Y =2200
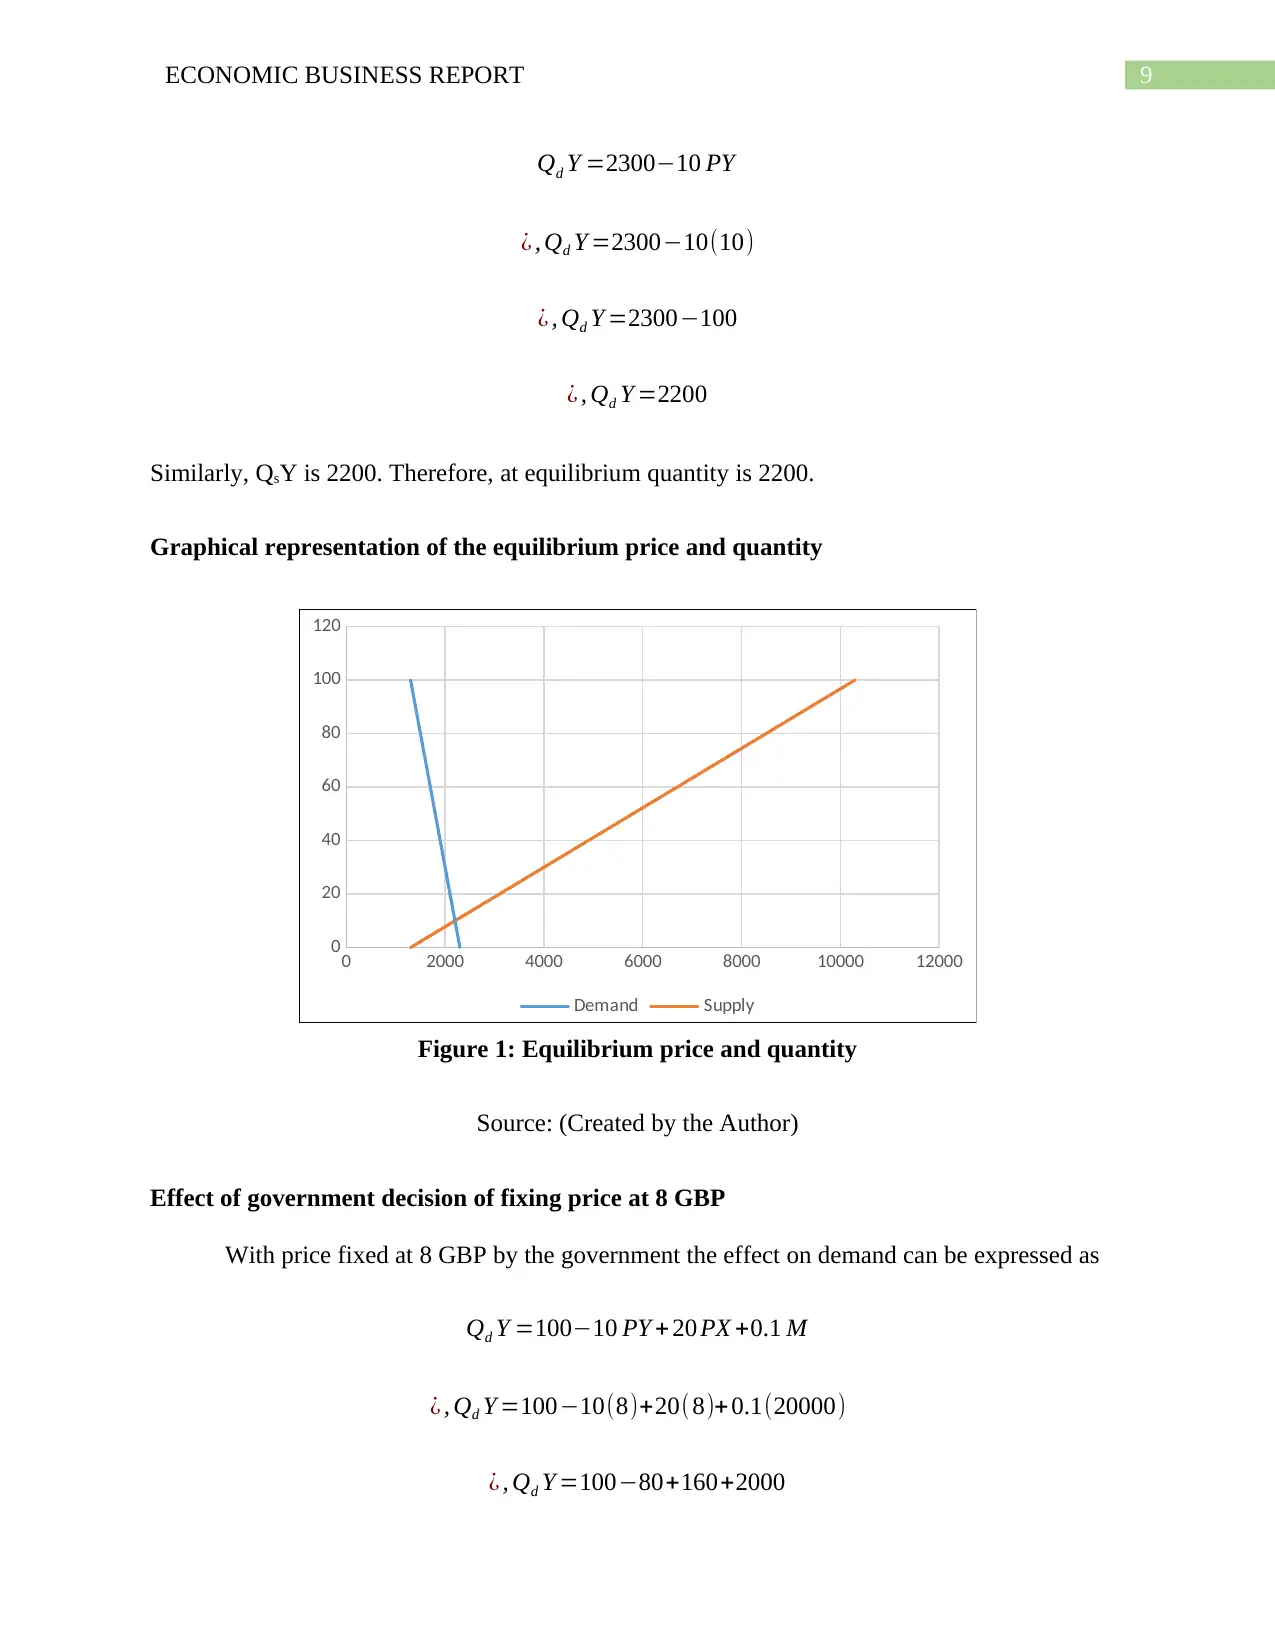
Similarly, QsY is 2200. Therefore, at equilibrium quantity is 2200.
Graphical representation of the equilibrium price and quantity
Figure 1: Equilibrium price and quantity
Source: (Created by the Author)
Effect of government decision of fixing price at 8 GBP
With price fixed at 8 GBP by the government the effect on demand can be expressed as
Qd Y =100−10 PY + 20 PX +0.1 M
¿ , Qd Y =100−10(8)+20(8)+ 0.1(20000)
¿ , Qd Y =100−80+160+2000
0 2000 4000 6000 8000 10000 12000
0
20
40
60
80
100
120
Demand Supply
Qd Y =2300−10 PY
¿ , Qd Y =2300−10(10)
¿ , Qd Y =2300−100
¿ , Qd Y =2200
Similarly, QsY is 2200. Therefore, at equilibrium quantity is 2200.
Graphical representation of the equilibrium price and quantity
Figure 1: Equilibrium price and quantity
Source: (Created by the Author)
Effect of government decision of fixing price at 8 GBP
With price fixed at 8 GBP by the government the effect on demand can be expressed as
Qd Y =100−10 PY + 20 PX +0.1 M
¿ , Qd Y =100−10(8)+20(8)+ 0.1(20000)
¿ , Qd Y =100−80+160+2000
0 2000 4000 6000 8000 10000 12000
0
20
40
60
80
100
120
Demand Supply
Paraphrase This Document
Need a fresh take? Get an instant paraphrase of this document with our AI Paraphraser
10ECONOMIC BUSINESS REPORT
¿ , Qd Y =100−80+160+2000
¿ , Qd Y =2180
Similarly, effect on supply can be expressed as
Qs Y =1300+90 P
¿ , Qs Y =1300+ 90(8)
¿ , Qs Y =1300+720
¿ , Qs Y =2020
Therefore, it can be observed that with fall in price both the supply and demand falls from
equilibrium point (Kriesler 2016). It can be further observed that there is a shortage of supply in
comparison to the quantity demanded.
However, equilibrium price is
Qd Y =Qs Y
¿ , 2260−10 PY =1300+90 PY
¿ , 10 PY + 90 PY =2260−1300
¿ , 100 PY =960
¿ , PY =9.6
Effect of change in regulation of market on demand and supply of the company
In general, market demand and supply is determined by the free market forces but in
many cases where there is very low market competitiveness such that a firm or few firms
11ECONOMIC BUSINESS REPORT
charging high price and making supernormal profit (Kregel 2017). This causes exploitation of
the consumers and thereby by making, the market allocation and productivity wise inefficient
then government intervenes and regulate the market by imposing price ceiling (Doda 2016). It
means that, firms cannot impose price over a certain limit fixed by the government.
Alternatively, there are cases when the government imposes price floor where the companies
cannot price blow the point set by the government in order to limit consumption. Therefore, in
the previous case excess demand occurs and in the latter excess supply occurs (Basu and Pak
2017). Hence, it can be inferred that with change in market regulation the demand and supply
moves from the free market equilibrium point market runs under demand and supply
disequilibrium due to existence of market regulation.
Task III
The cost function is given as
C ( Q ) =4000+150 Q
Fixed cost
As per economic theory, it can be said that the fixed cost is 4000.
Variable cost
Given the cost function, economic theory suggest that the variable cost is 15 if the
quantity produced is 1 and it will increase by 150 with every unit increase in quantity.
Marginal cost
dC ( Q )
dQ = d (4000+ 150Q)
dQ
¿ , Marginal cost ( MC)=150
⊘ This is a preview!⊘
Do you want full access?
Subscribe today to unlock all pages.
Trusted by 1+ million students worldwide
1 out of 21
Related Documents


Your All-in-One AI-Powered Toolkit for Academic Success.
+13062052269
info@desklib.com
Available 24*7 on WhatsApp / Email
![[object Object]](/_next/static/media/star-bottom.7253800d.svg)
Unlock your academic potential
Copyright © 2020–2026 A2Z Services. All Rights Reserved. Developed and managed by ZUCOL.