Microeconomics Assignment: Demand, Supply, and Market Structures

Verified

Added on  2020/03/23

|8
|1220
|108
Homework Assignment
AI Summary
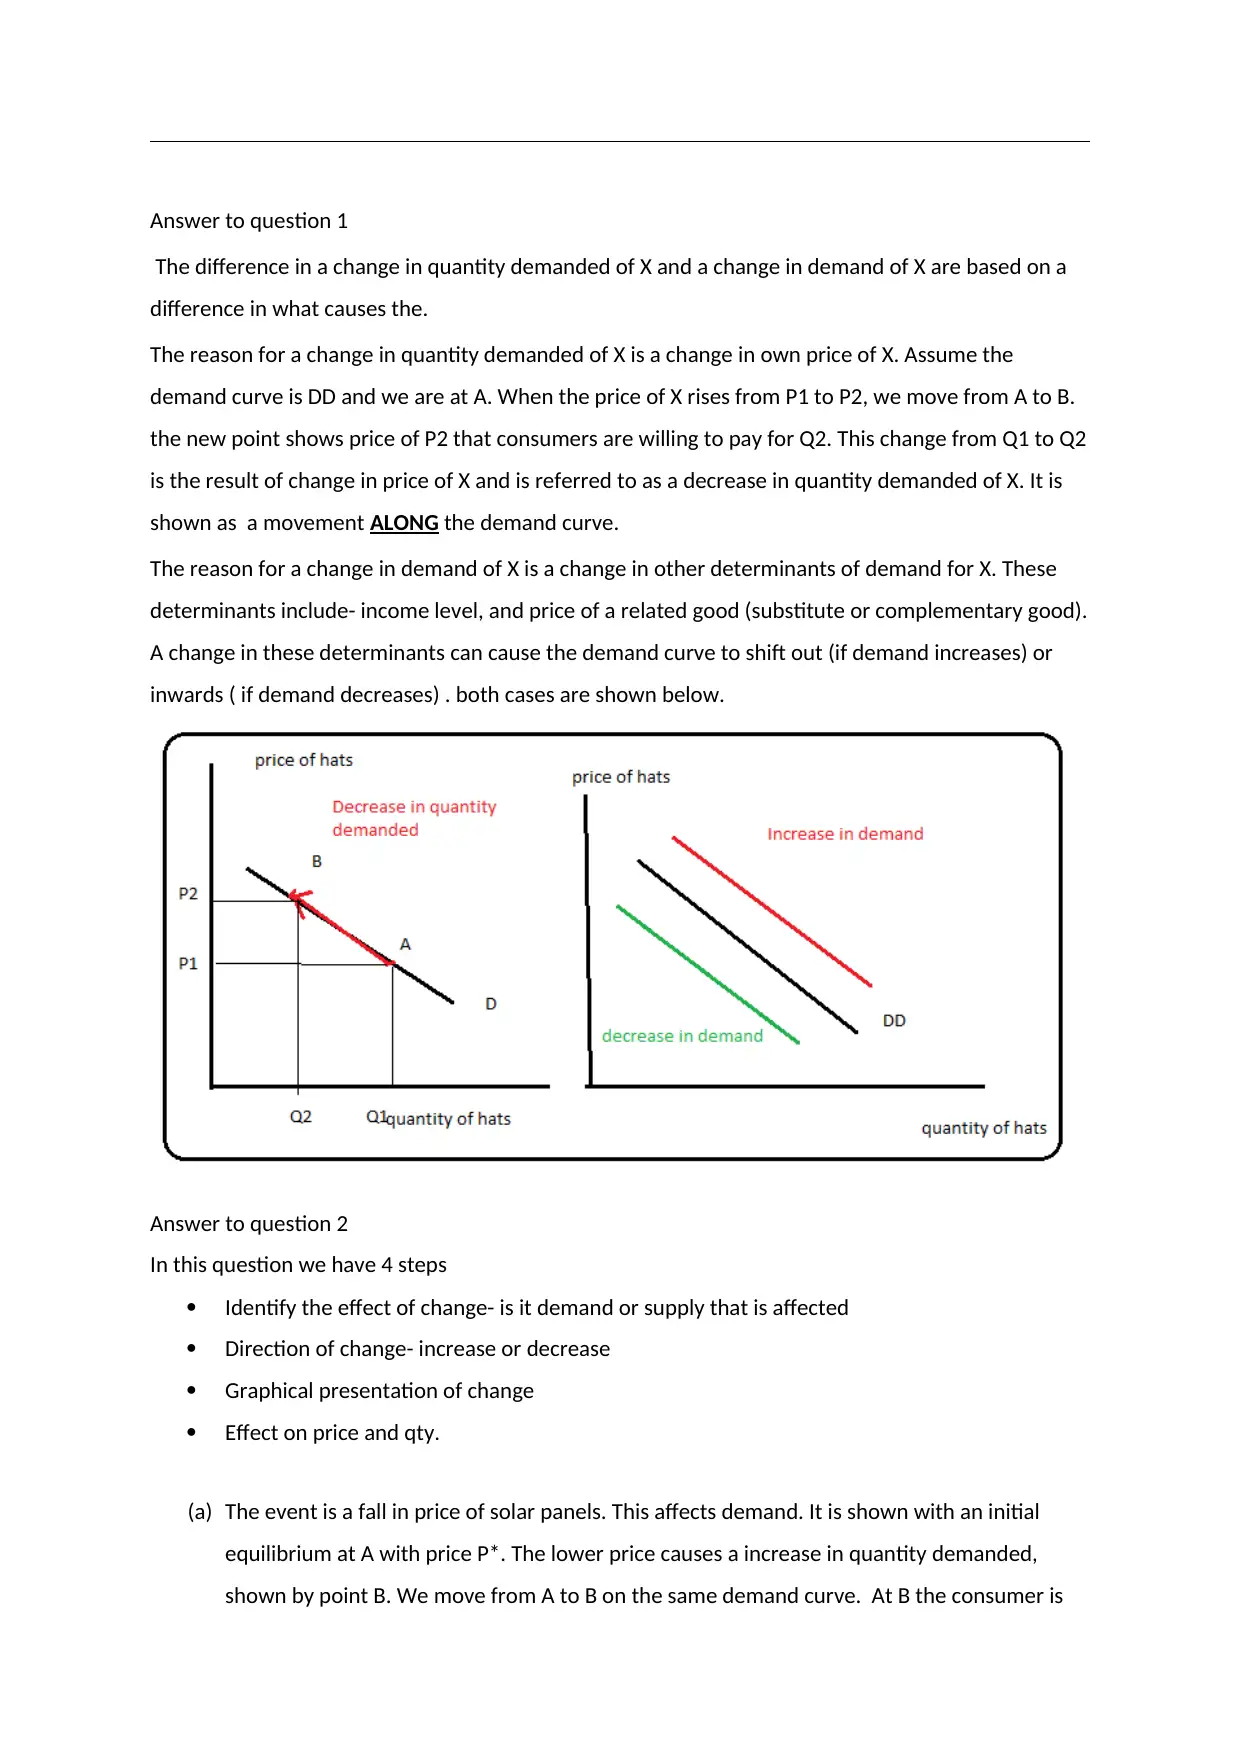
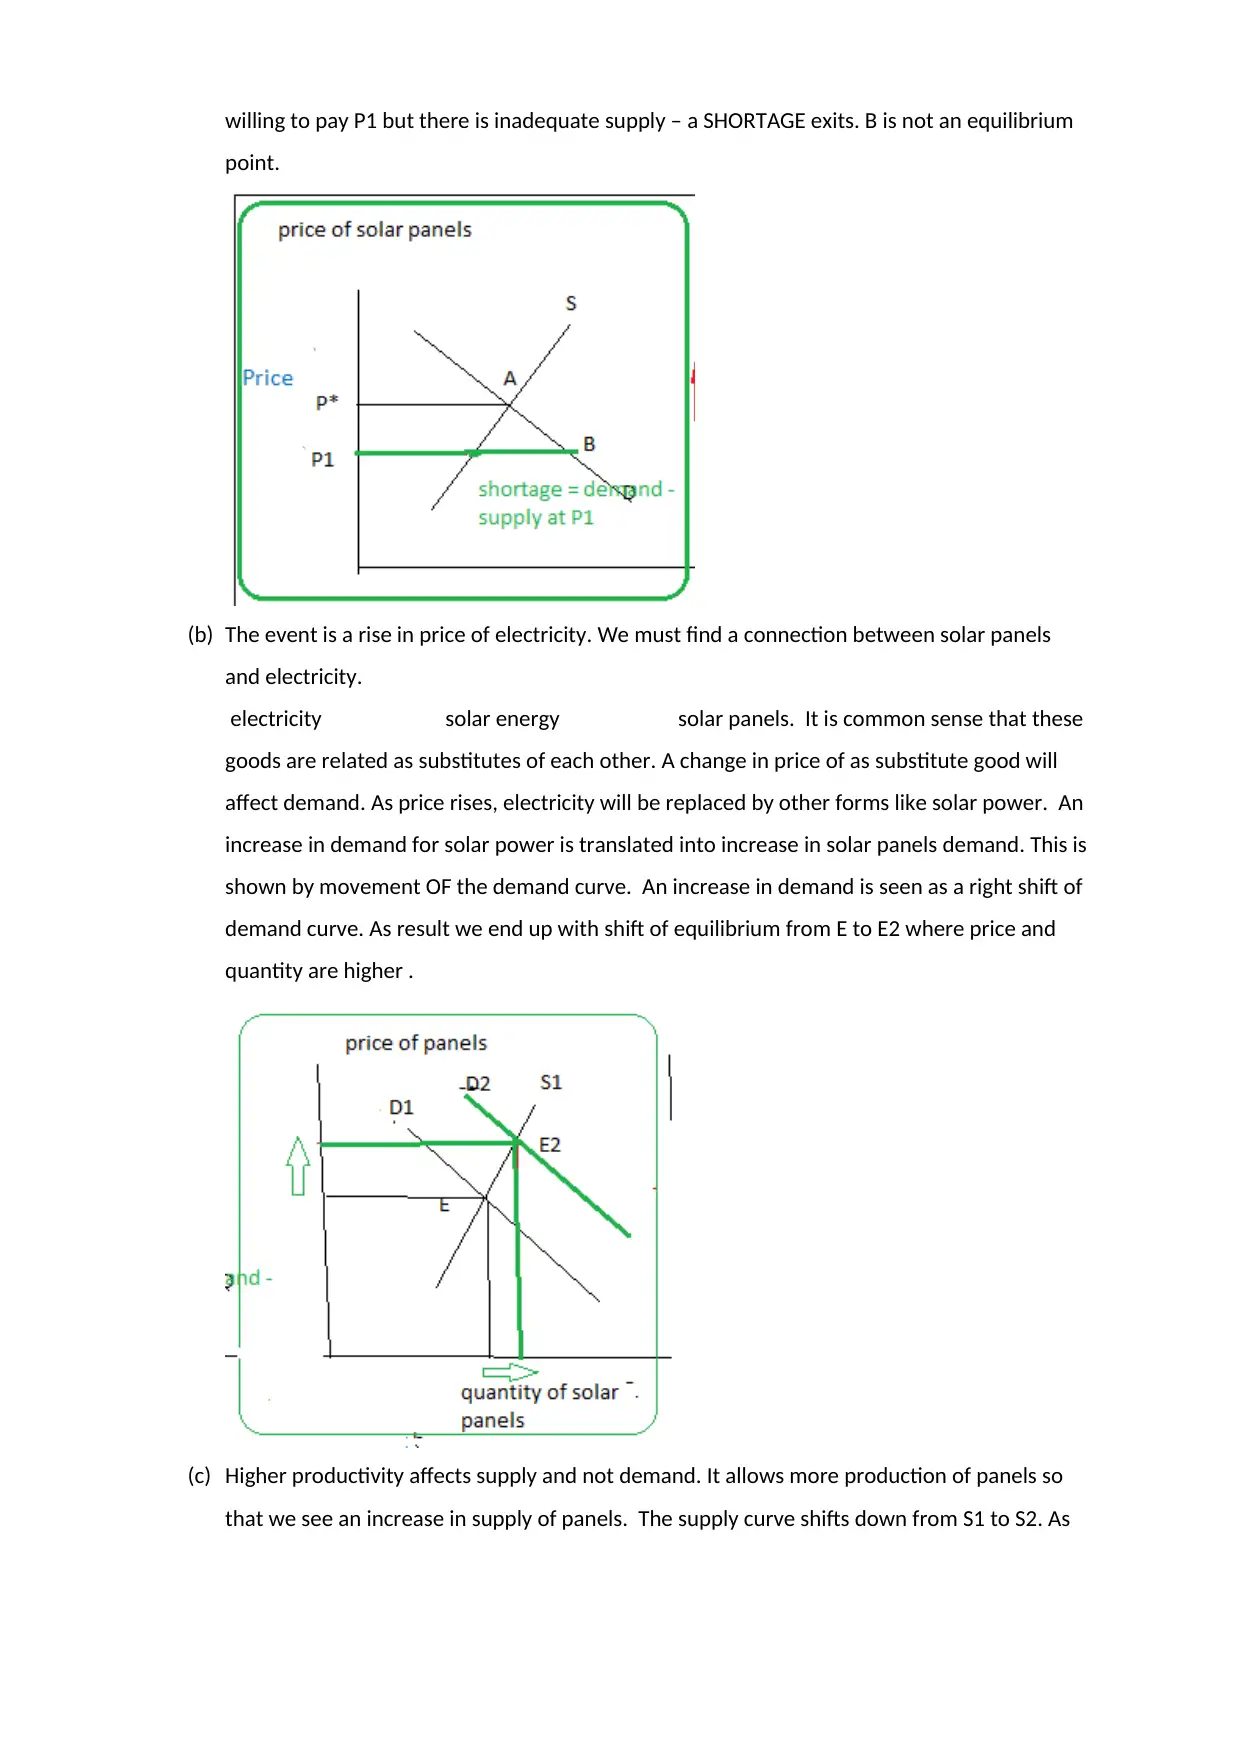
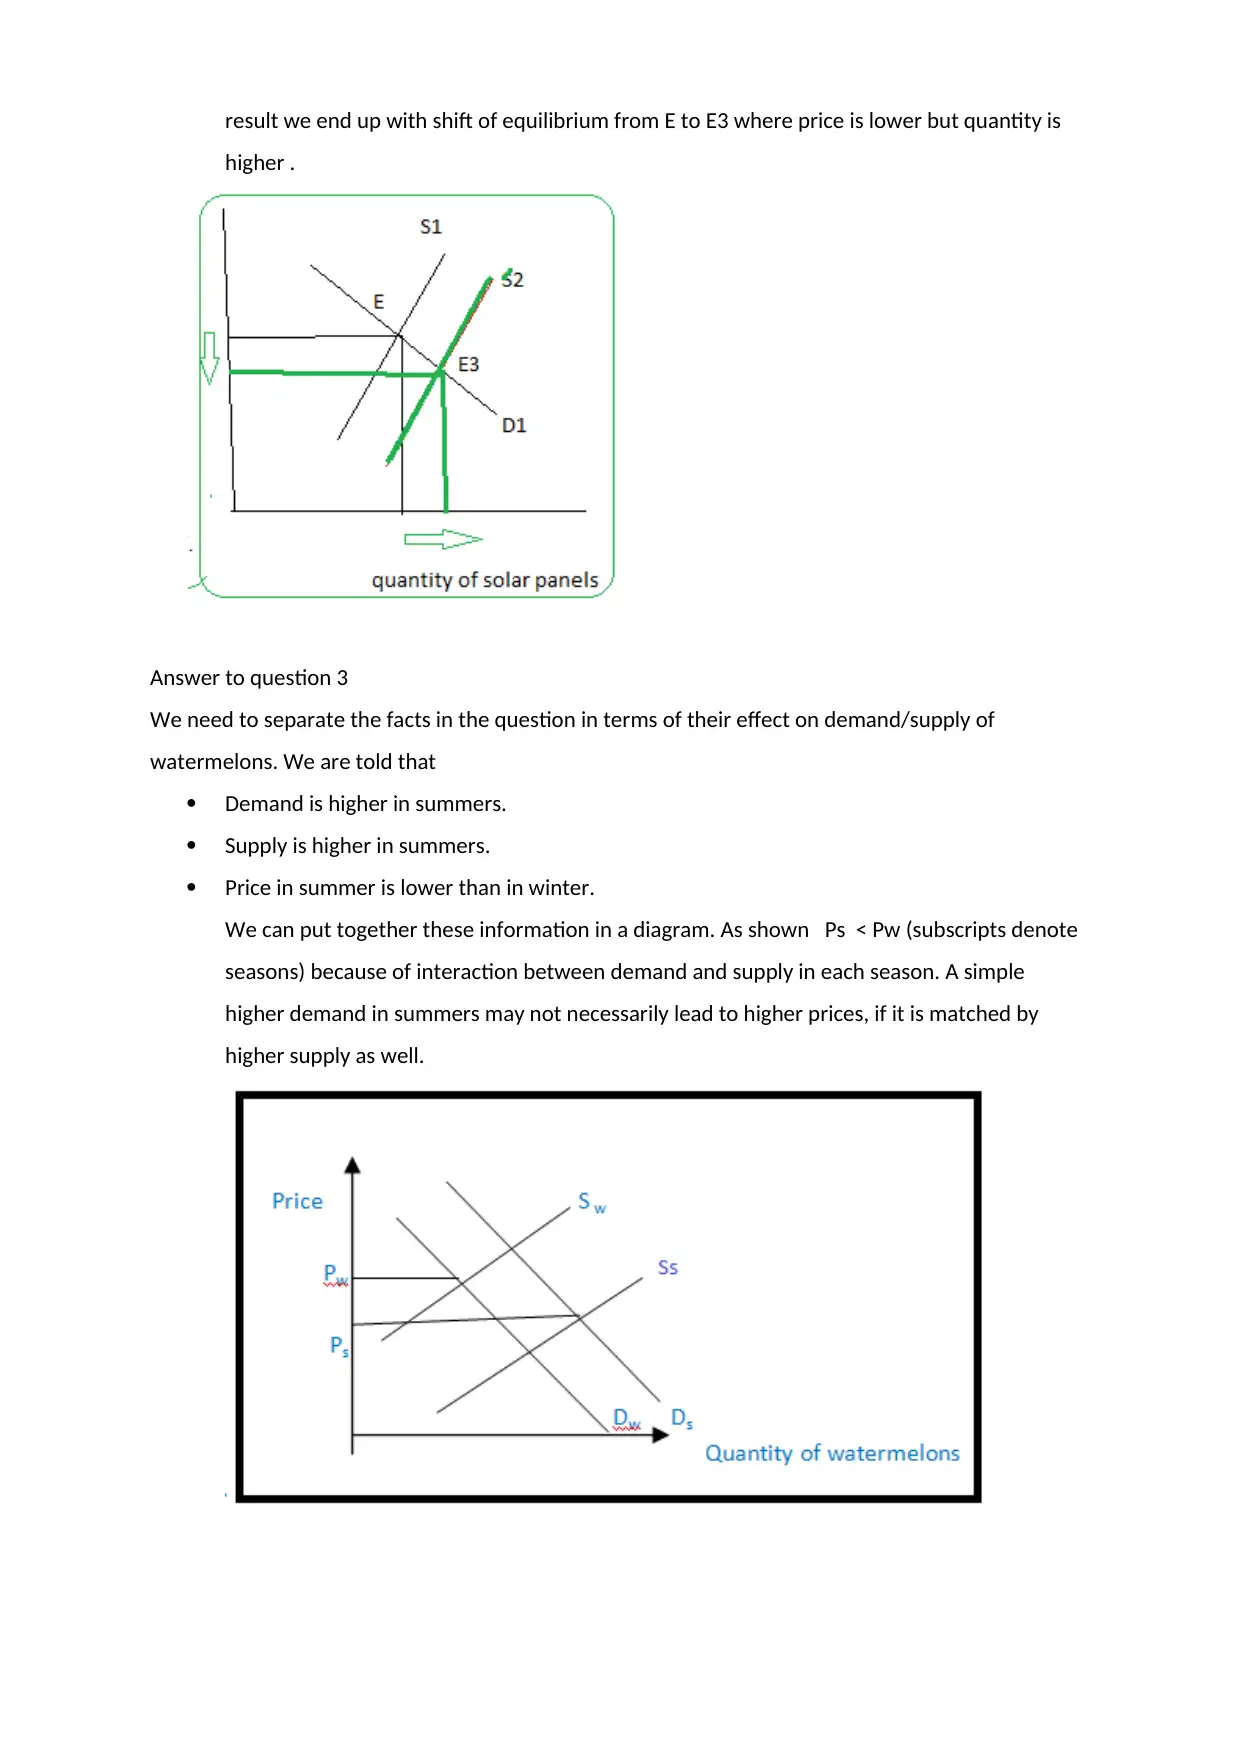
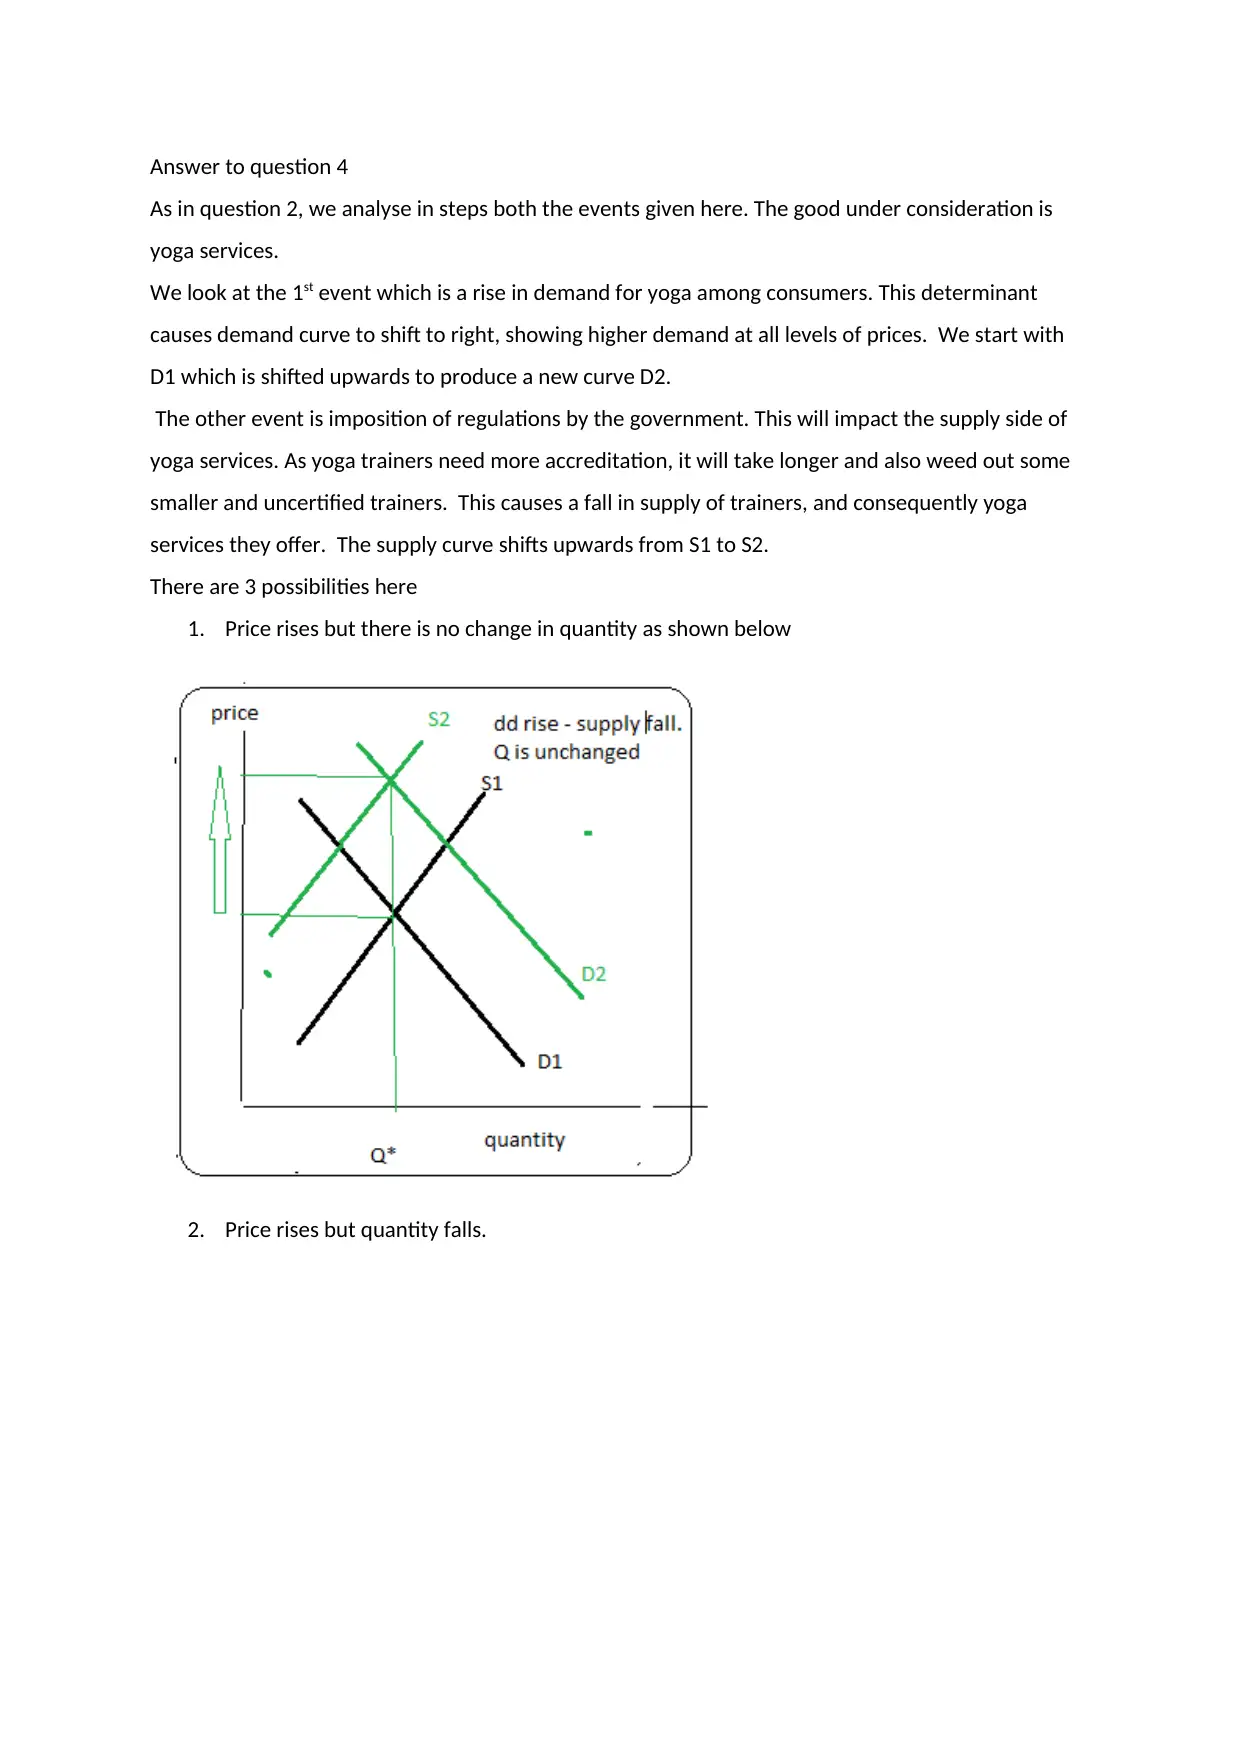
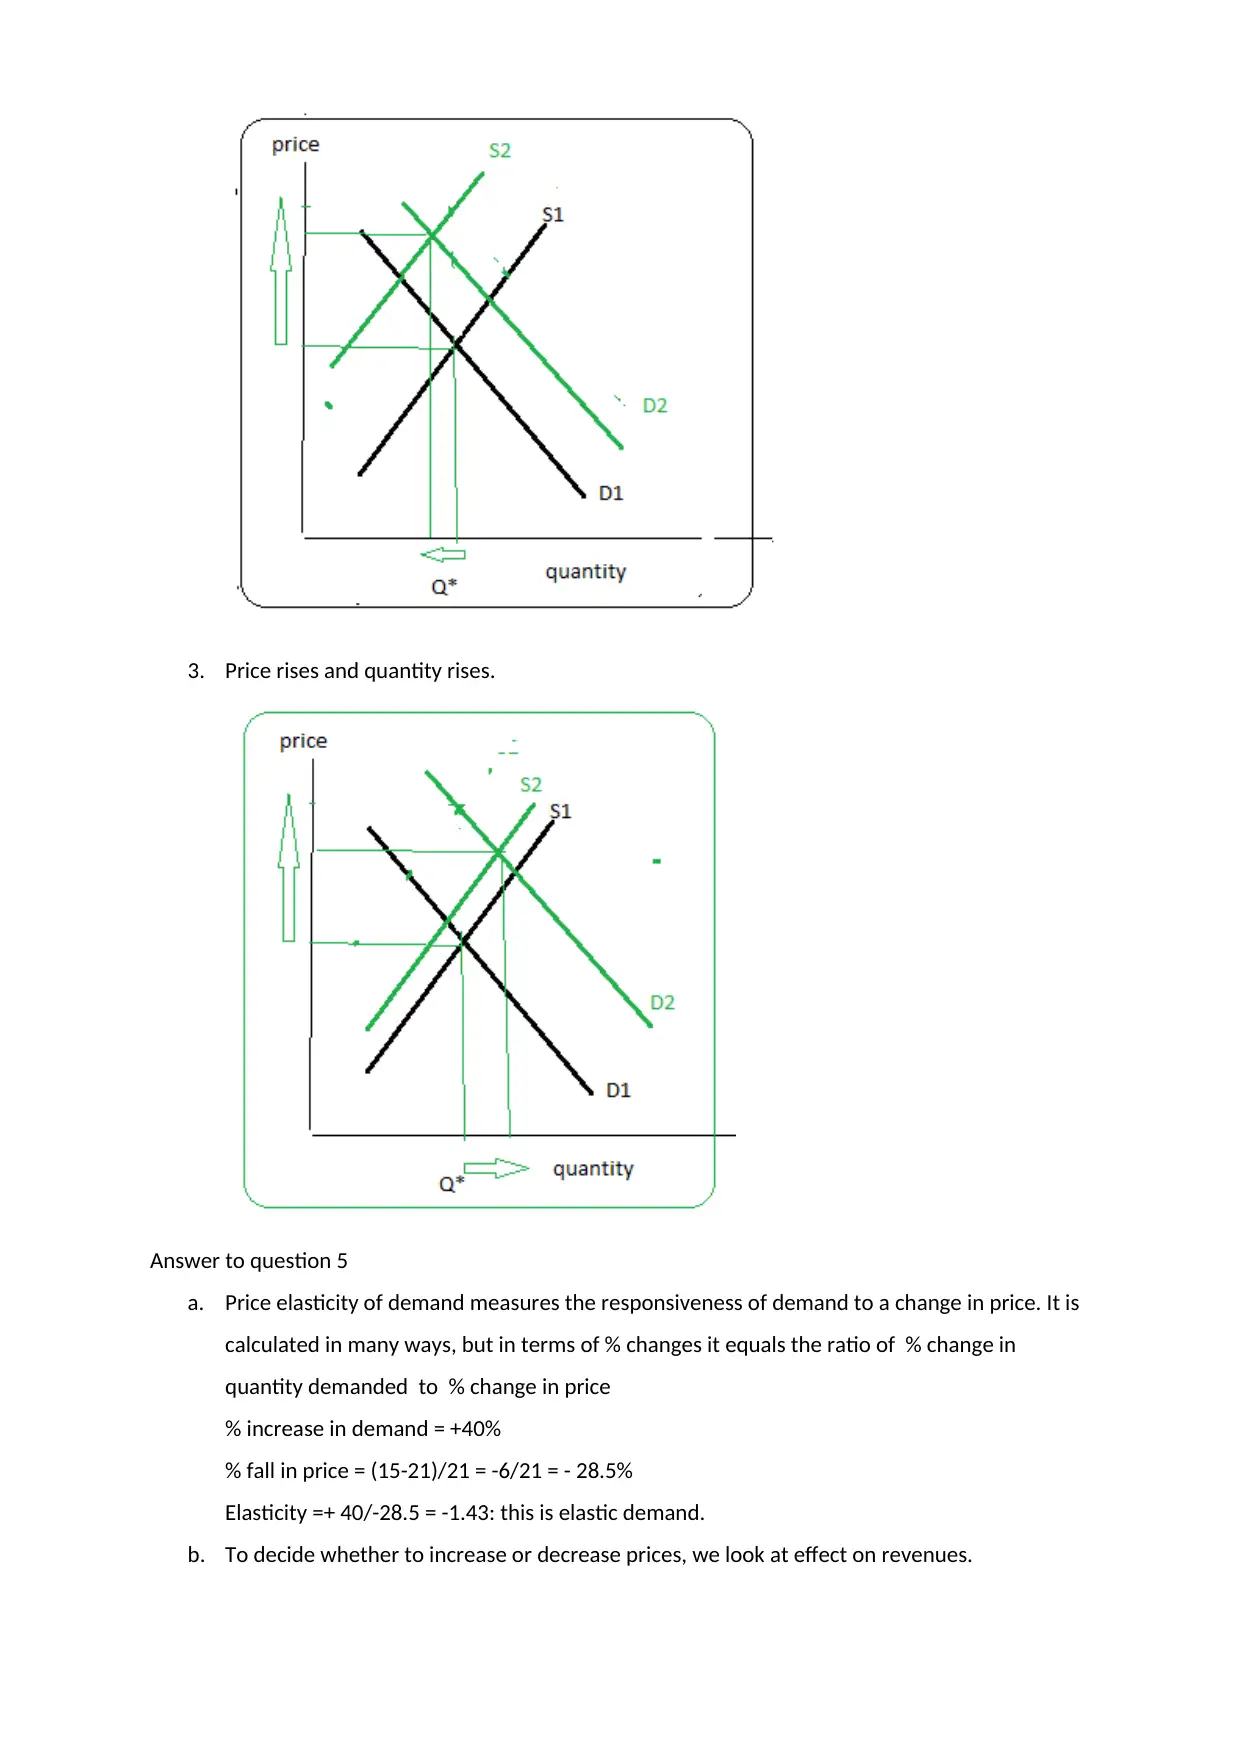
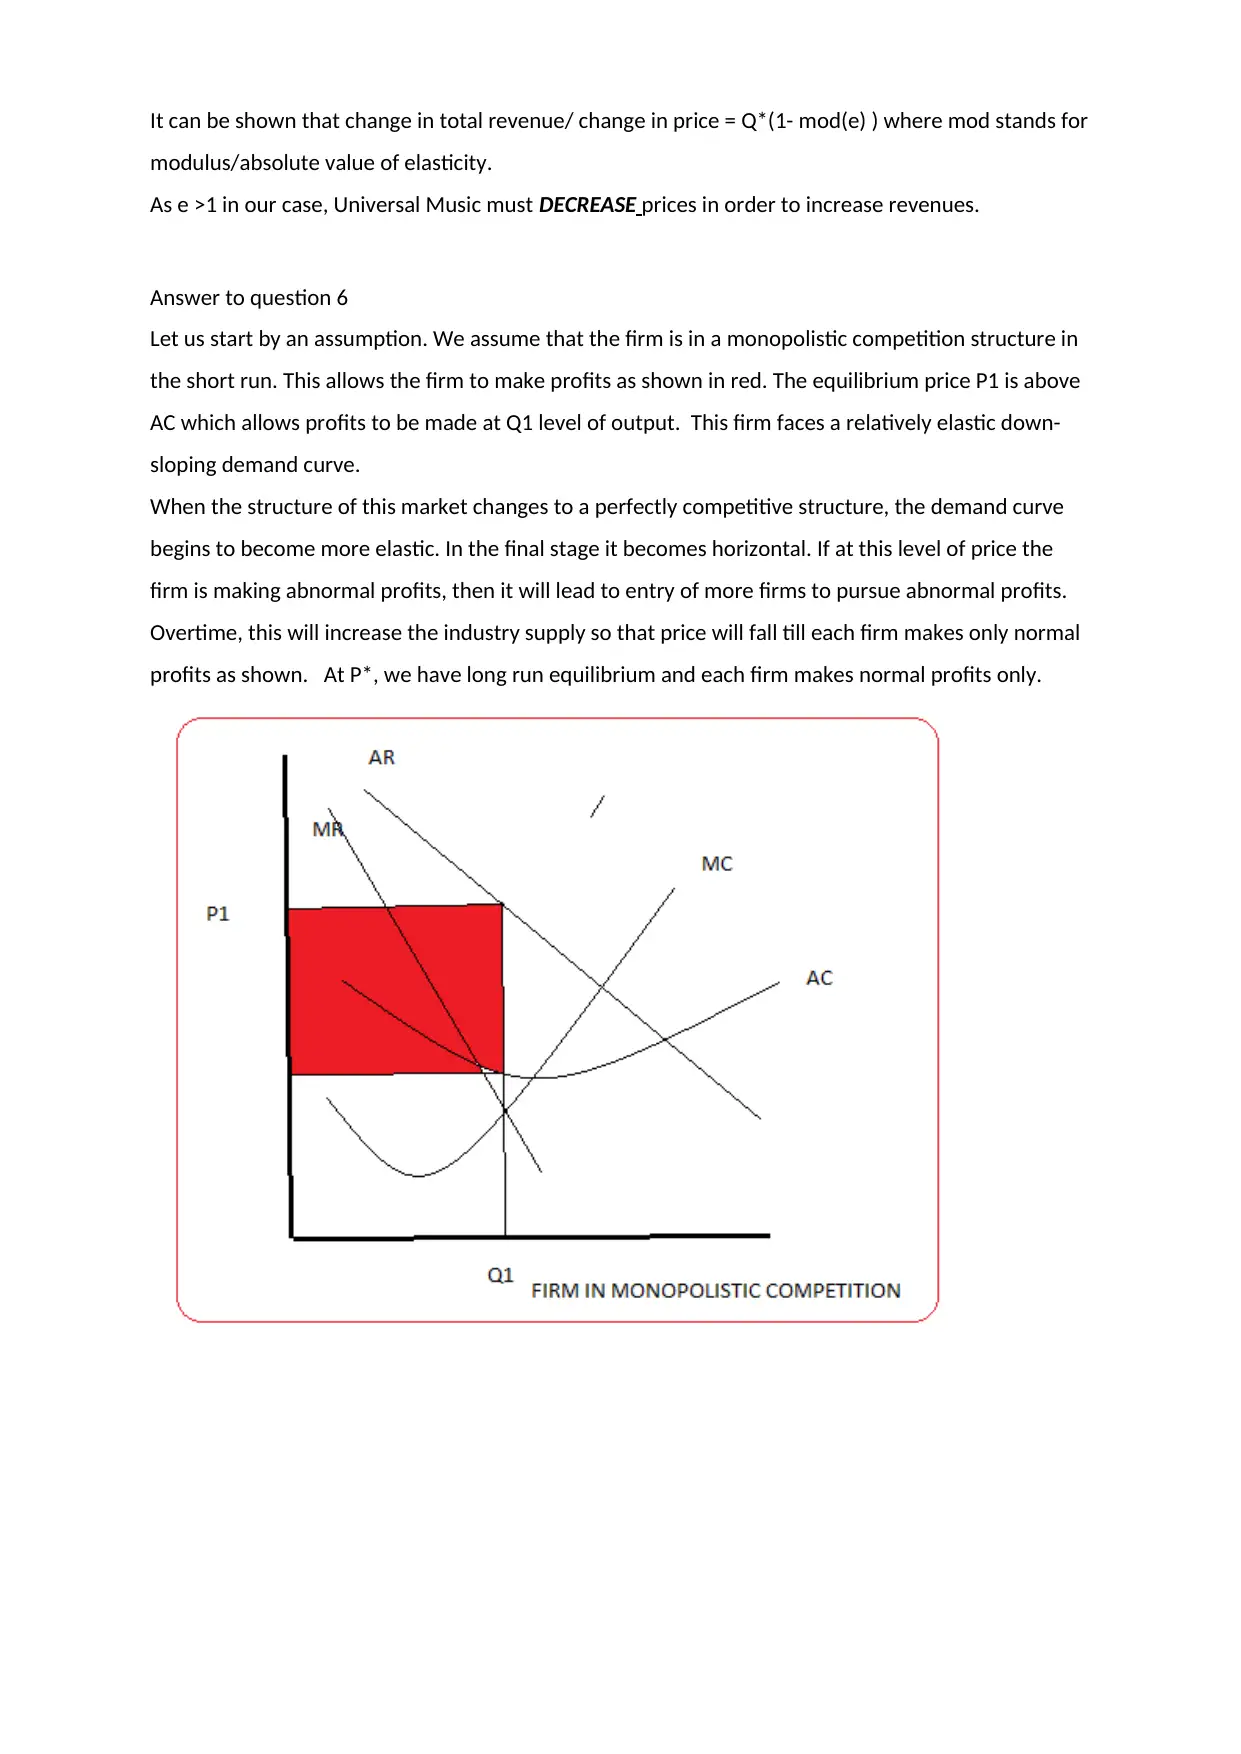
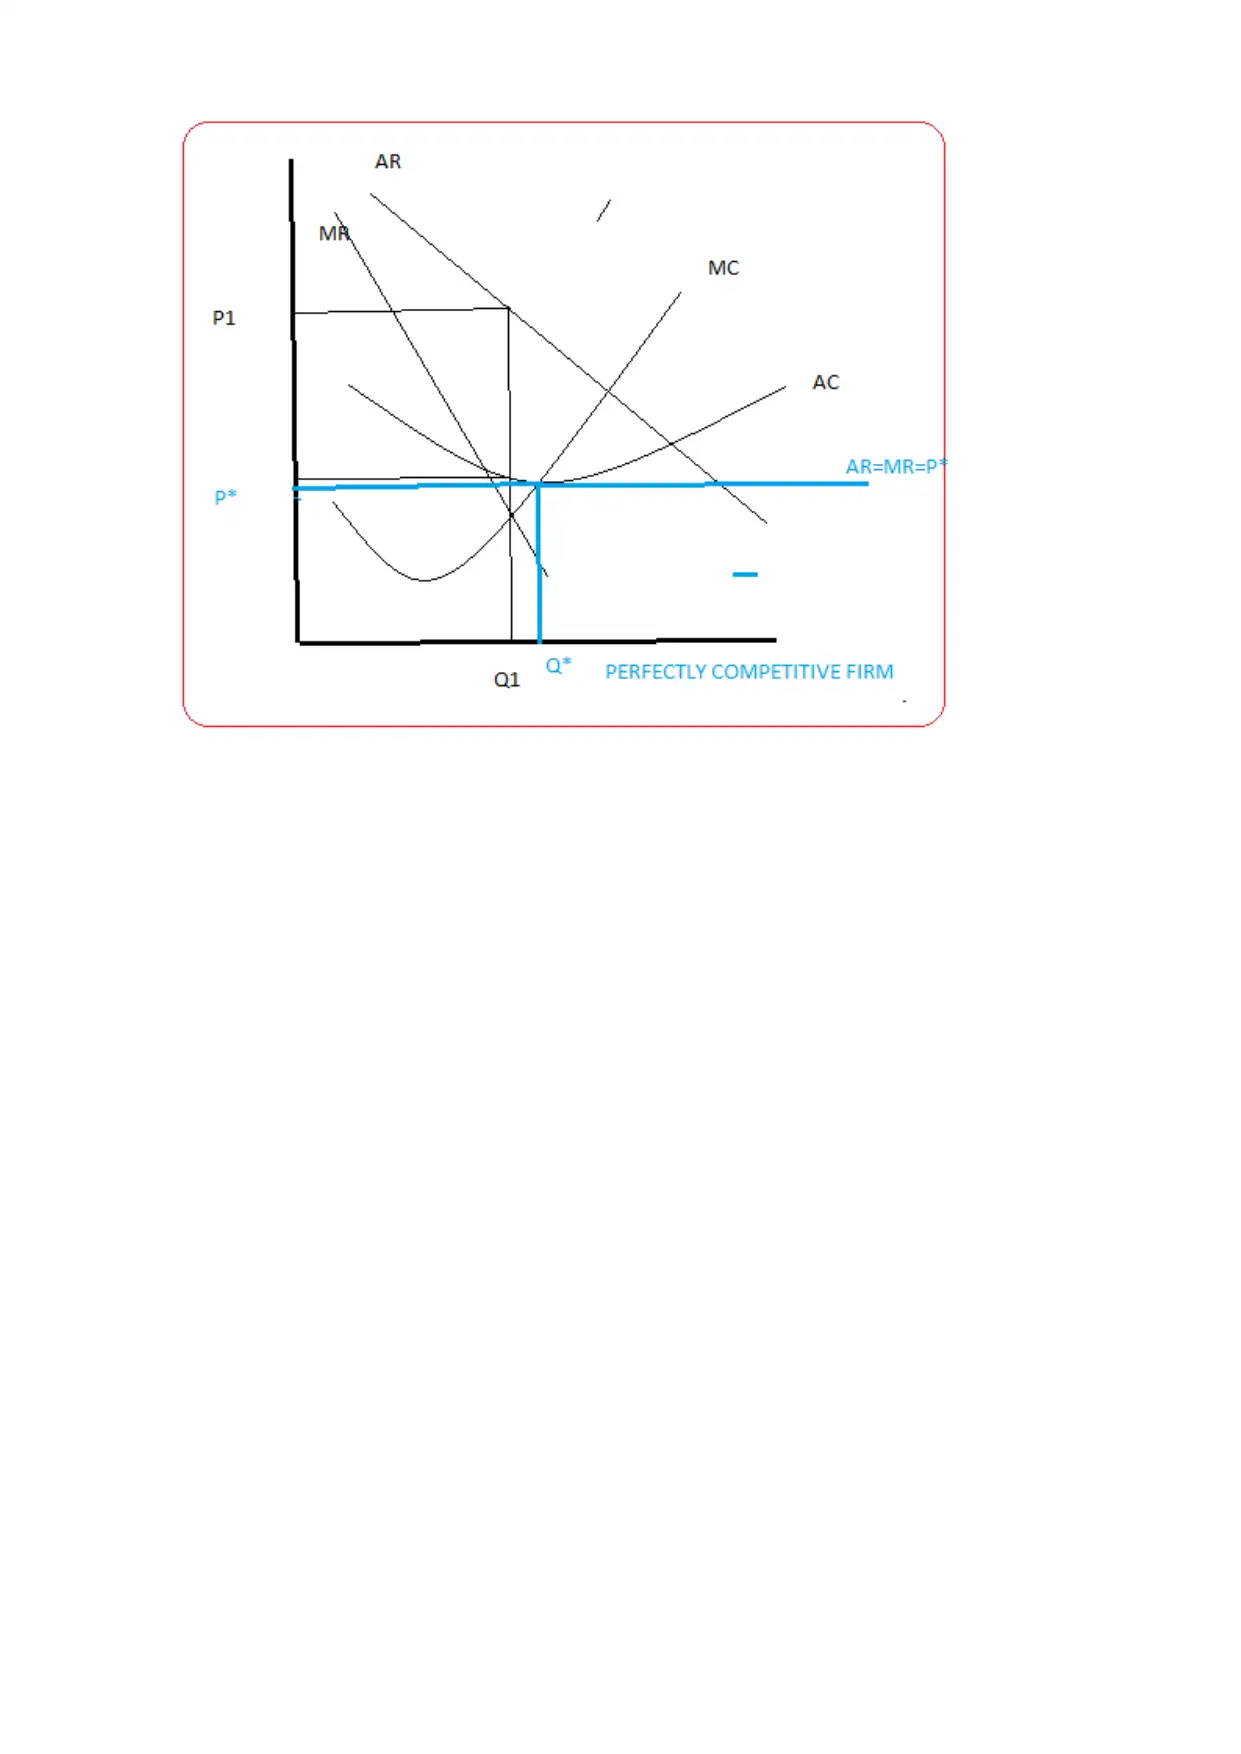
This economics assignment delves into several key concepts of microeconomics. The first section differentiates between changes in quantity demanded and changes in demand, explaining the factors influencing each and illustrating them with graphical representations. The second question analyzes the impact of various events, such as a fall in solar panel prices and a rise in electricity prices, on the demand and supply of solar panels, using step-by-step analysis and graphical presentations. The assignment then examines the interaction of demand and supply in the watermelon market during summer and winter. The fourth question explores the effects of increased demand and government regulations on yoga services, presenting different scenarios. The fifth question calculates and interprets the price elasticity of demand and its implications for revenue maximization. Finally, the assignment concludes with an analysis of a firm operating in a monopolistic competition market structure, transitioning to a perfectly competitive market, and the resulting long-run equilibrium. The document includes relevant diagrams and references to support the analysis.
Document Page
Answer to question 1
The difference in a change in quantity demanded of X and a change in demand of X are based on a
difference in what causes the.
The reason for a change in quantity demanded of X is a change in own price of X. Assume the
demand curve is DD and we are at A. When the price of X rises from P1 to P2, we move from A to B.
the new point shows price of P2 that consumers are willing to pay for Q2. This change from Q1 to Q2
is the result of change in price of X and is referred to as a decrease in quantity demanded of X. It is
shown as a movement ALONG the demand curve.
The reason for a change in demand of X is a change in other determinants of demand for X. These
determinants include- income level, and price of a related good (substitute or complementary good).
A change in these determinants can cause the demand curve to shift out (if demand increases) or
inwards ( if demand decreases) . both cases are shown below.
Answer to question 2
In this question we have 4 steps
Identify the effect of change- is it demand or supply that is affected
Direction of change- increase or decrease
Graphical presentation of change
Effect on price and qty.
(a) The event is a fall in price of solar panels. This affects demand. It is shown with an initial
equilibrium at A with price P*. The lower price causes a increase in quantity demanded,
shown by point B. We move from A to B on the same demand curve. At B the consumer is
tabler-icon-diamond-filled.svg

Paraphrase This Document

Need a fresh take? Get an instant paraphrase of this document with our AI Paraphraser
Document Page
willing to pay P1 but there is inadequate supply – a SHORTAGE exits. B is not an equilibrium
point.
(b) The event is a rise in price of electricity. We must find a connection between solar panels
and electricity.
electricity solar energy solar panels. It is common sense that these
goods are related as substitutes of each other. A change in price of as substitute good will
affect demand. As price rises, electricity will be replaced by other forms like solar power. An
increase in demand for solar power is translated into increase in solar panels demand. This is
shown by movement OF the demand curve. An increase in demand is seen as a right shift of
demand curve. As result we end up with shift of equilibrium from E to E2 where price and
quantity are higher .
(c) Higher productivity affects supply and not demand. It allows more production of panels so
that we see an increase in supply of panels. The supply curve shifts down from S1 to S2. As
Document Page
result we end up with shift of equilibrium from E to E3 where price is lower but quantity is
higher .
Answer to question 3
We need to separate the facts in the question in terms of their effect on demand/supply of
watermelons. We are told that
Demand is higher in summers.
Supply is higher in summers.
Price in summer is lower than in winter.
We can put together these information in a diagram. As shown Ps < Pw (subscripts denote
seasons) because of interaction between demand and supply in each season. A simple
higher demand in summers may not necessarily lead to higher prices, if it is matched by
higher supply as well.
Document Page
Answer to question 4
As in question 2, we analyse in steps both the events given here. The good under consideration is
yoga services.
We look at the 1st event which is a rise in demand for yoga among consumers. This determinant
causes demand curve to shift to right, showing higher demand at all levels of prices. We start with
D1 which is shifted upwards to produce a new curve D2.
The other event is imposition of regulations by the government. This will impact the supply side of
yoga services. As yoga trainers need more accreditation, it will take longer and also weed out some
smaller and uncertified trainers. This causes a fall in supply of trainers, and consequently yoga
services they offer. The supply curve shifts upwards from S1 to S2.
There are 3 possibilities here
1. Price rises but there is no change in quantity as shown below
2. Price rises but quantity falls.
tabler-icon-diamond-filled.svg

Paraphrase This Document

Need a fresh take? Get an instant paraphrase of this document with our AI Paraphraser
Document Page
3. Price rises and quantity rises.
Answer to question 5
a. Price elasticity of demand measures the responsiveness of demand to a change in price. It is
calculated in many ways, but in terms of % changes it equals the ratio of % change in
quantity demanded to % change in price
% increase in demand = +40%
% fall in price = (15-21)/21 = -6/21 = - 28.5%
Elasticity =+ 40/-28.5 = -1.43: this is elastic demand.
b. To decide whether to increase or decrease prices, we look at effect on revenues.
Document Page
It can be shown that change in total revenue/ change in price = Q*(1- mod(e) ) where mod stands for
modulus/absolute value of elasticity.
As e >1 in our case, Universal Music must DECREASE prices in order to increase revenues.
Answer to question 6
Let us start by an assumption. We assume that the firm is in a monopolistic competition structure in
the short run. This allows the firm to make profits as shown in red. The equilibrium price P1 is above
AC which allows profits to be made at Q1 level of output. This firm faces a relatively elastic down-
sloping demand curve.
When the structure of this market changes to a perfectly competitive structure, the demand curve
begins to become more elastic. In the final stage it becomes horizontal. If at this level of price the
firm is making abnormal profits, then it will lead to entry of more firms to pursue abnormal profits.
Overtime, this will increase the industry supply so that price will fall till each firm makes only normal
profits as shown. At P*, we have long run equilibrium and each firm makes normal profits only.
Document Page
tabler-icon-diamond-filled.svg

Paraphrase This Document

Need a fresh take? Get an instant paraphrase of this document with our AI Paraphraser
Document Page
References
Anon., n.d. perfect Competition. [Online] Available
athttp://www.economicshelp.org/microessays/markets/perfect-competition/ [Accessed 16
Sep 2017].
Econ.ohio-state.edu, n.d. Elasticity. [Online] Available
athttp://www.econ.ohio-state.edu/jpeck/H200/EconH200L5.pdf [Accessed 19 Sep 2017].
Open.lib.umn.edu, n.d. Perfect Comnpetition in the Long run. [Online] Available at:
https://open.lib.umn.edu/principleseconomics/chapter/9-3-perfect-competition-in-the-
long-run/ [Accessed 15 Sep 2017].
chevron_up_icon
1 out of 8
circle_padding
hide_on_mobile
zoom_out_icon
[object Object]