University Microeconomics Assignment Solution: BUECO5903
VerifiedAdded on 2022/09/01
|14
|2398
|17
Homework Assignment
AI Summary
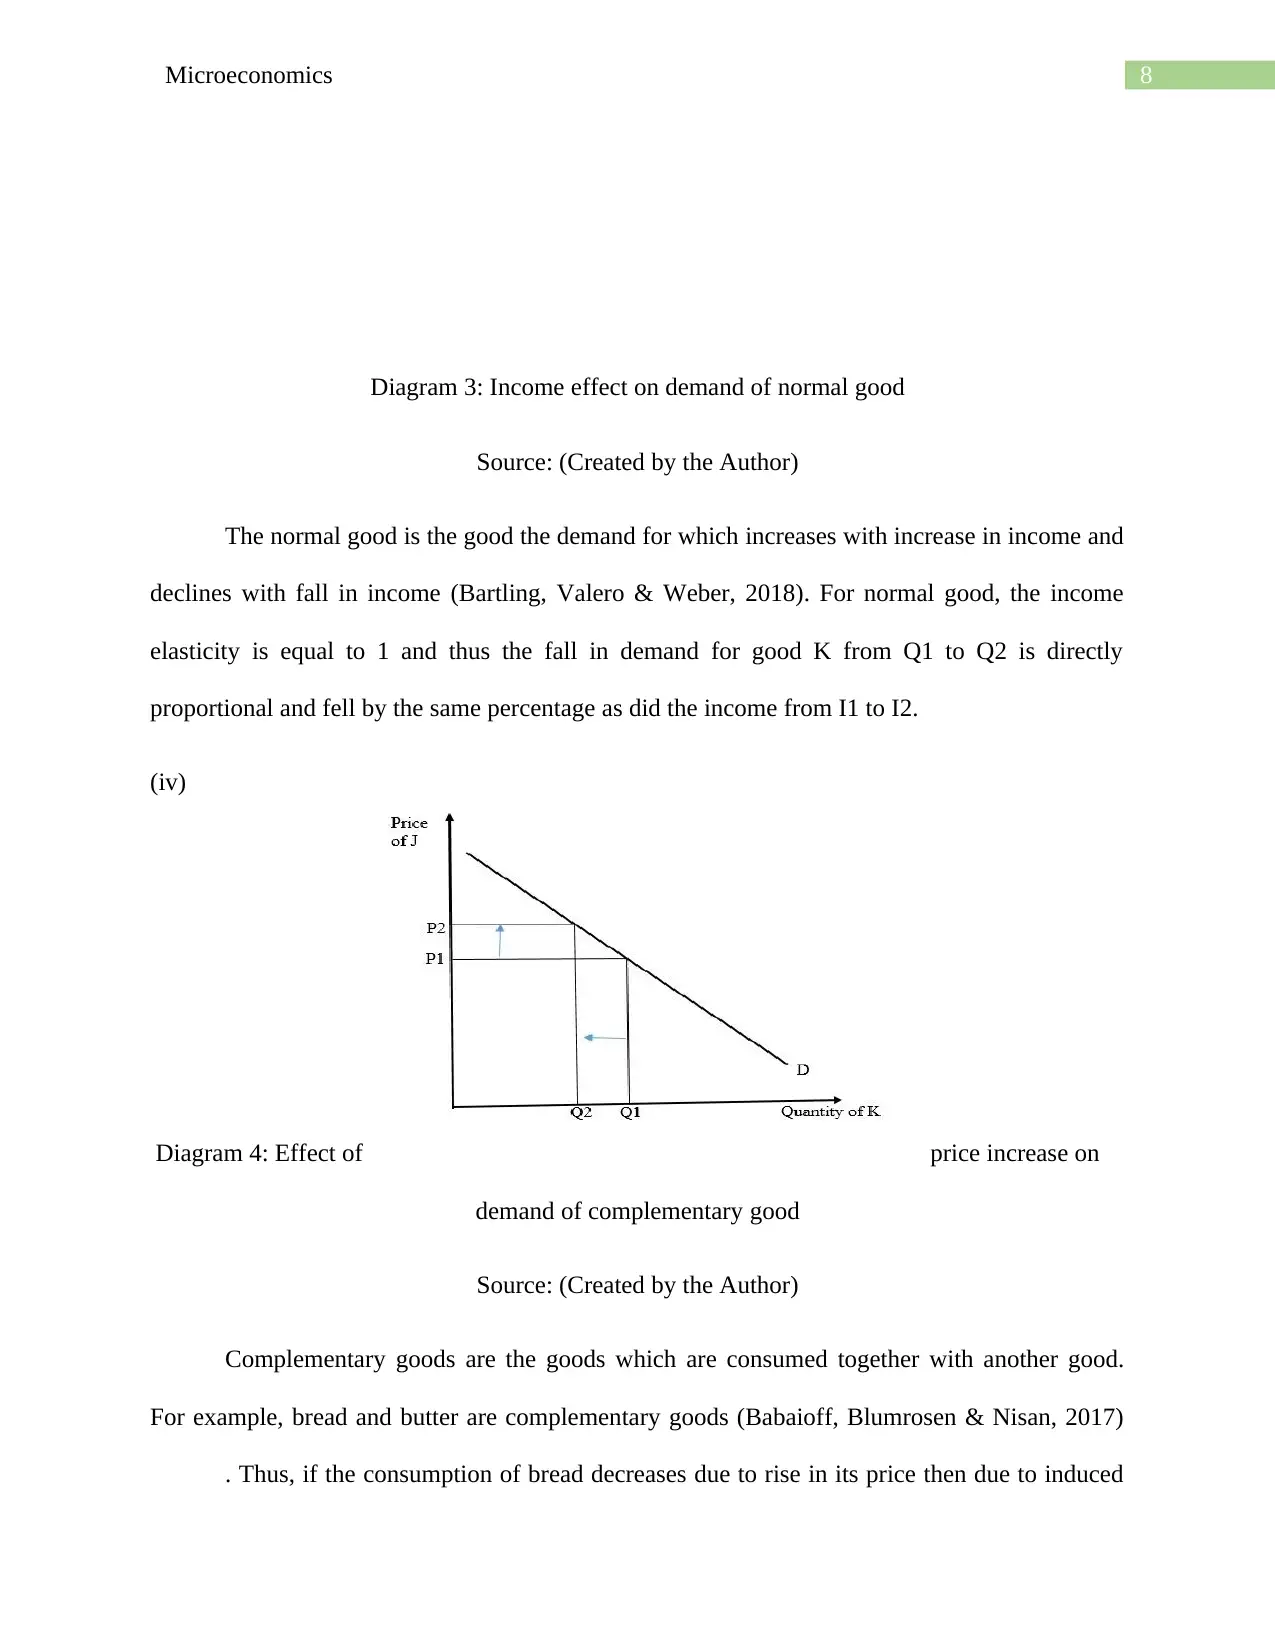
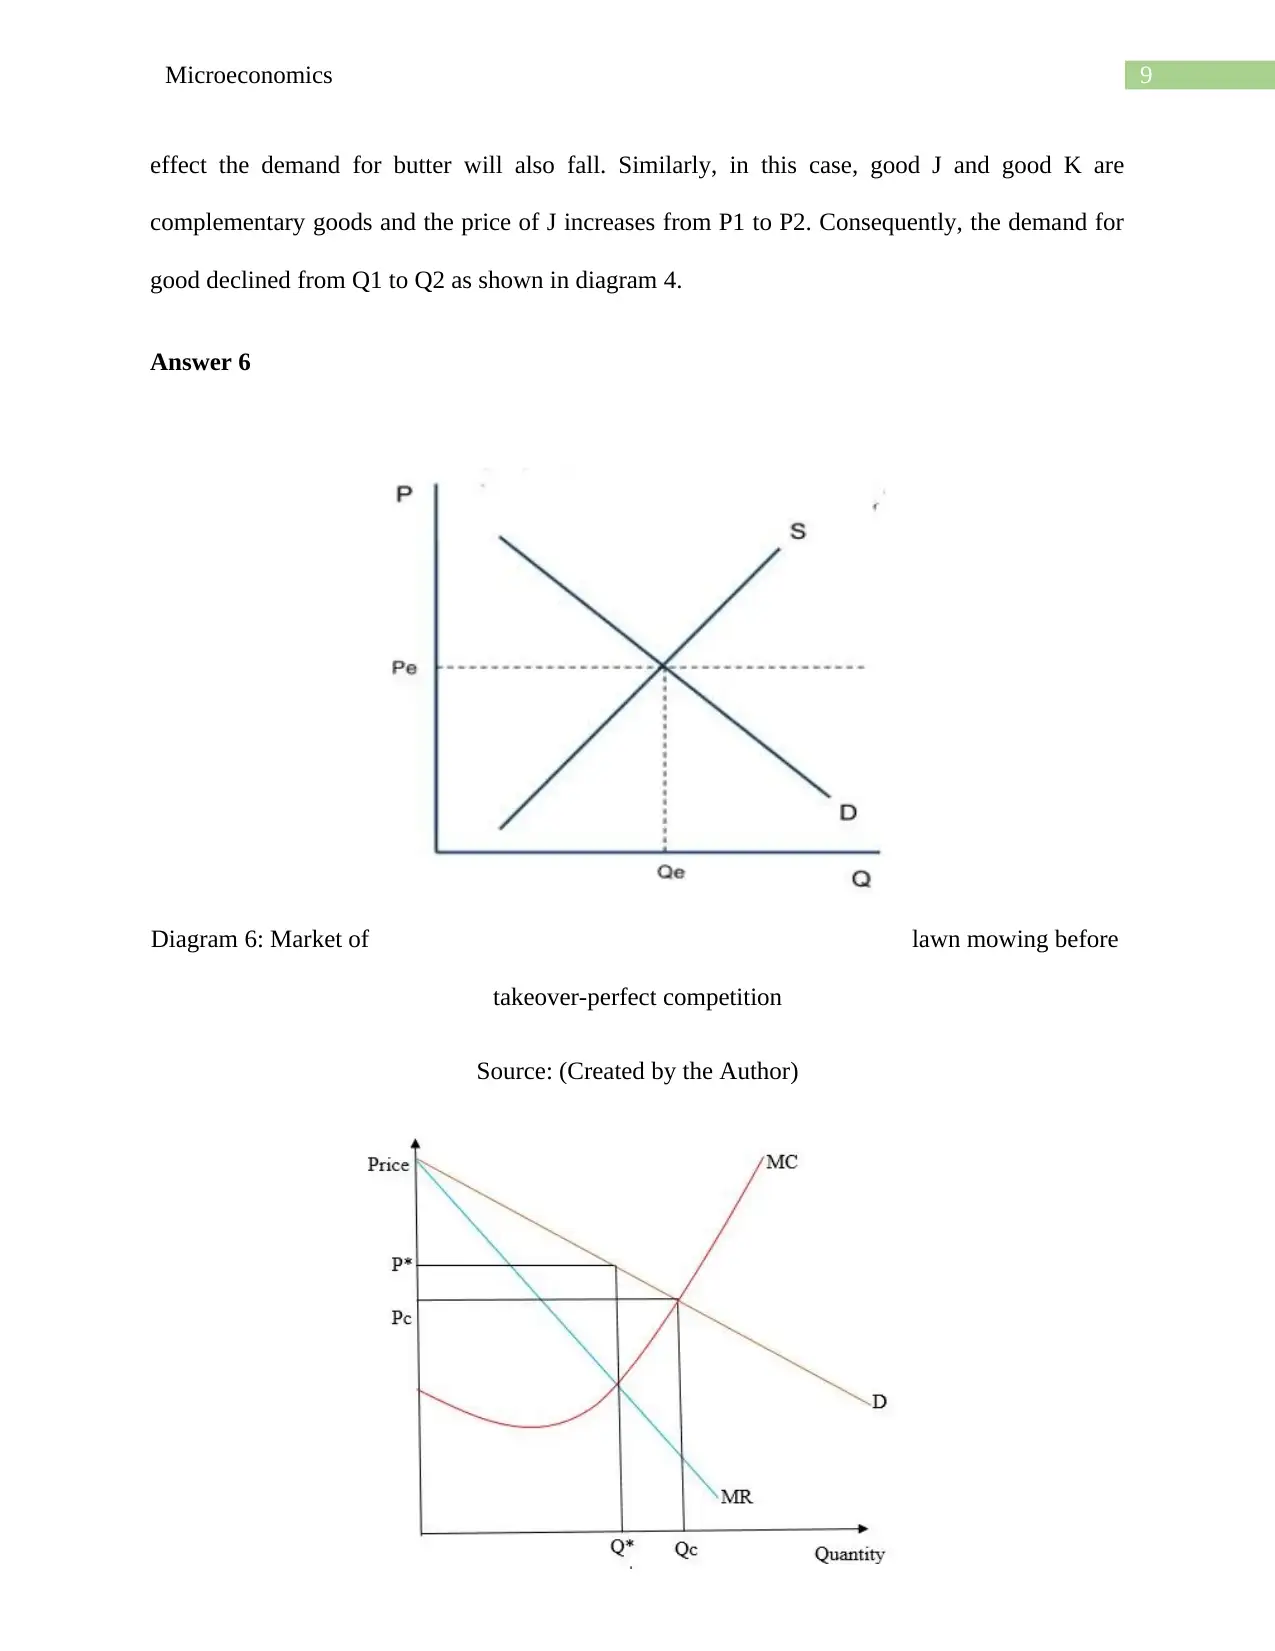
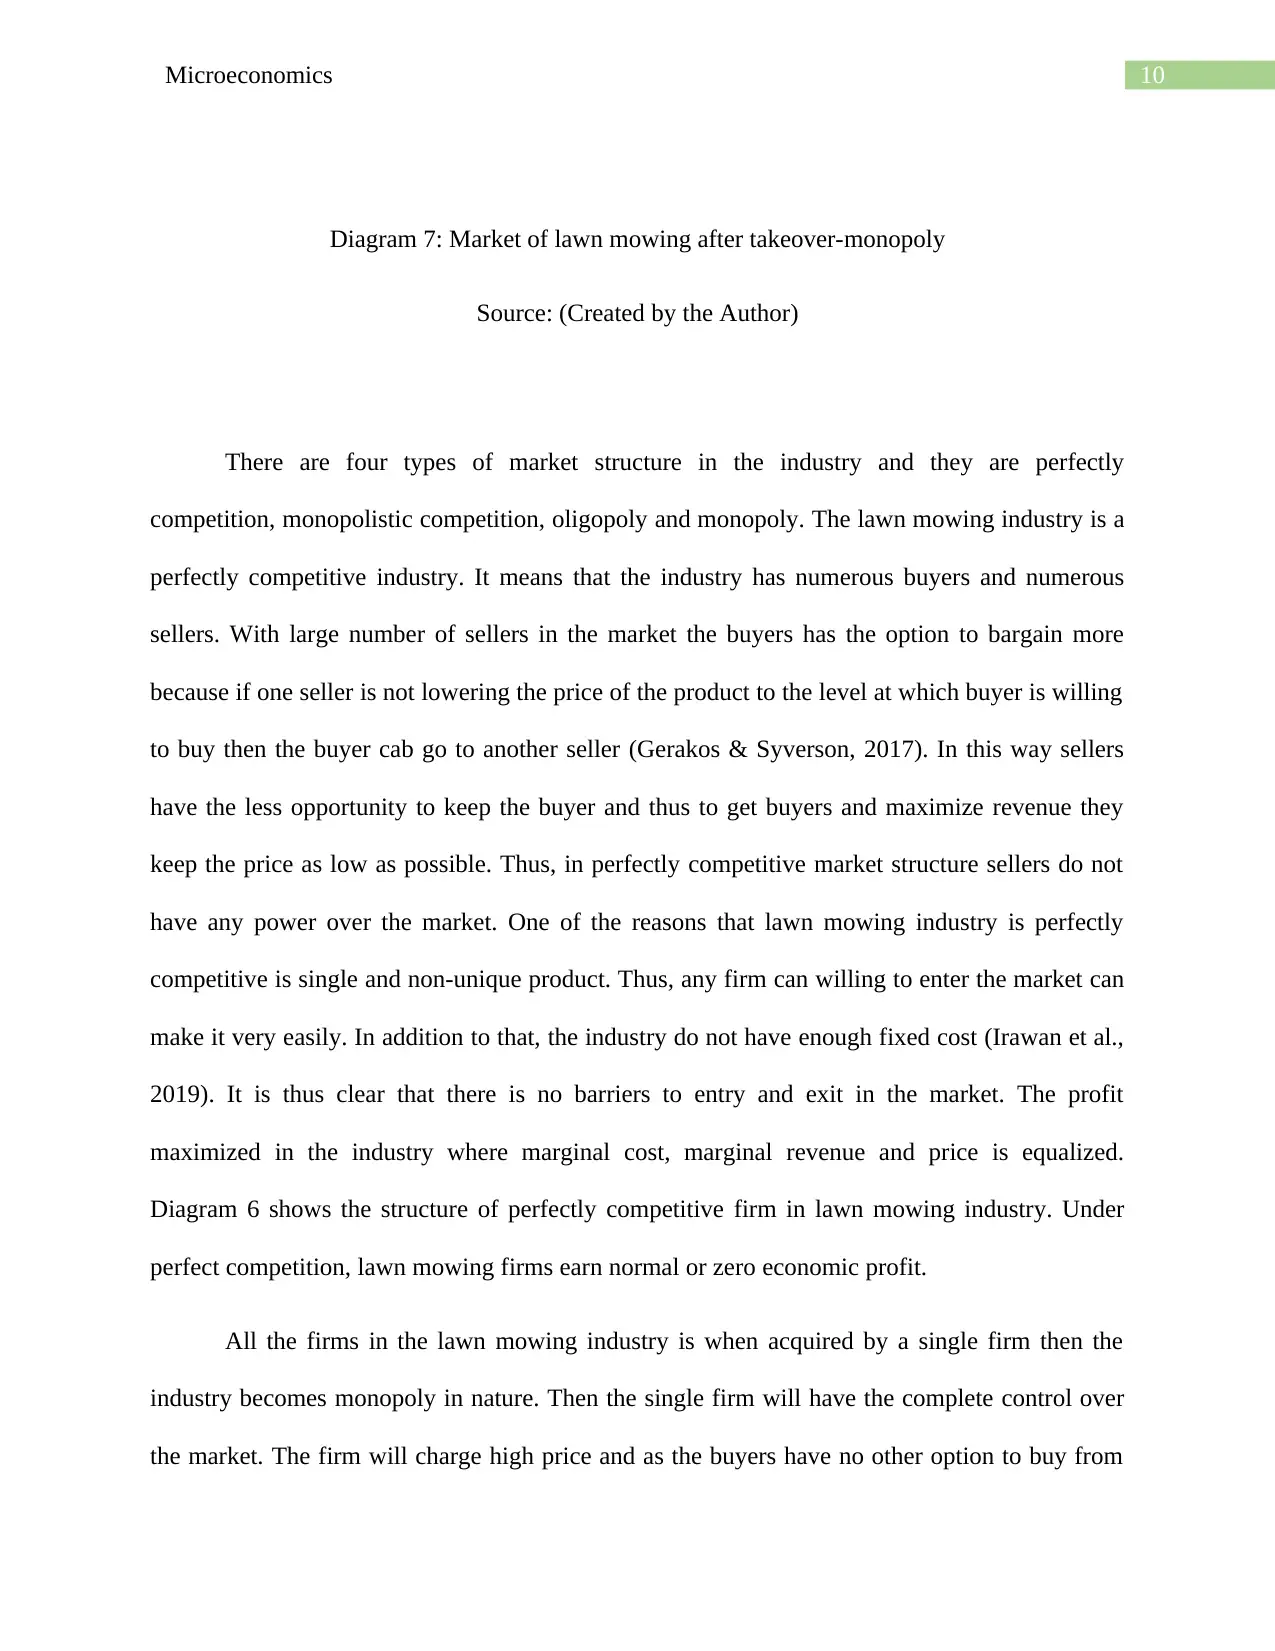
This assignment solution addresses key microeconomic concepts through the analysis of several problems. The first question explores cross-price elasticity, determining the relationship between two products and calculating the price adjustments needed to maintain sales volume. The second question distinguishes between accounting and economic profit, analyzes the impact of increased demand on industry profits, and examines long-run market adjustments. The solution then delves into the effects of income and price changes on demand for different types of goods, including inferior, substitute, normal, and complementary goods, using diagrams to illustrate these effects. Finally, the assignment compares market structures, specifically perfect competition and monopoly, within the context of the lawn mowing industry, examining price, output, and profit implications, and discussing the sustainability of a monopoly in this context. The solution incorporates diagrams and references to support the analysis.
Contribute Materials
Your contribution can guide someone’s learning journey. Share your
documents today.

Running head: Microeconomics
Microeconomics
Name of the Student
Name of the University ‘
Student ID
Microeconomics
Name of the Student
Name of the University ‘
Student ID
Secure Best Marks with AI Grader
Need help grading? Try our AI Grader for instant feedback on your assignments.

1Microeconomics
Table of Contents
Answer 1..........................................................................................................................................2
Answer 2..........................................................................................................................................4
Answer 4..........................................................................................................................................5
Answer 6..........................................................................................................................................8
Reference.......................................................................................................................................11

2Microeconomics
Answer 1
(i) Cross price elasticity shows the change in quantity demanded of a product due to change in
price of another product.
Stop Deca y' s Cross price elasticity=
QSD 2−QSD 1
QSD 2 +QSD 1
2
PDF 2−PDF 1
PDF 2 + PDF 1
2
¿ , Stop Deca y' s Cross price elasticity=
1500
14500
2
5
65
2
¿ , Stop Deca y' s Cross price elasticity=−1.35
The cross price elasticity of Stop Decay’s electric tooth brush found to be -1.35 which means it is
highly elastic and it can be inferred from the result that two concerned products are substitute
products.
(ii)
Price elasticity of demand=
QSD 2−QSD 1
QSD 2 +QSD 1
2
PSD 2−PSD 1
PSD 2 + PSD 1
2

3Microeconomics
¿ ,−1.5=
8000−6500
8000+6500
2
PSD 2−25
PSD 2+ 25
2
¿ ,−1.5=
1500
14500
PSD 2−25
PSD 2 +25
¿ , PSD 2=21.77
Stop Decay need to lessen its price to $21.77.
(iii)
Revenue before price change=25 ×6500
¿ , Revenue before price change=$ 162500
Revenue after price change=21.77 ×8000
¿ , Revenue after price change=$ 174160
(iv) In part (iii) after decrease in price of Stop Decay’s electric toothbrush the total revenue has
improved and owing to that the outcome is desirable. The aspects that are required to consider
are level of the profit margin, the part of marginal cost (MC) curve in which the concerned firm
is operating (Bush et al., 2018). It means that if the firm is operating at the profit maximizing
condition that is MC=MR or not and if the firm is operating in an oligopoly market then it should
at least earn super normal profit and if the firm is in perfectly competitive market then it should
¿ ,−1.5=
8000−6500
8000+6500
2
PSD 2−25
PSD 2+ 25
2
¿ ,−1.5=
1500
14500
PSD 2−25
PSD 2 +25
¿ , PSD 2=21.77
Stop Decay need to lessen its price to $21.77.
(iii)
Revenue before price change=25 ×6500
¿ , Revenue before price change=$ 162500
Revenue after price change=21.77 ×8000
¿ , Revenue after price change=$ 174160
(iv) In part (iii) after decrease in price of Stop Decay’s electric toothbrush the total revenue has
improved and owing to that the outcome is desirable. The aspects that are required to consider
are level of the profit margin, the part of marginal cost (MC) curve in which the concerned firm
is operating (Bush et al., 2018). It means that if the firm is operating at the profit maximizing
condition that is MC=MR or not and if the firm is operating in an oligopoly market then it should
at least earn super normal profit and if the firm is in perfectly competitive market then it should
Secure Best Marks with AI Grader
Need help grading? Try our AI Grader for instant feedback on your assignments.

4Microeconomics
at least earn normal profit. The other important conditions are market demand, factor prices and
change in technology of production or any kind of innovation in the market.
at least earn normal profit. The other important conditions are market demand, factor prices and
change in technology of production or any kind of innovation in the market.

5Microeconomics
Answer 2
(a) The accounting profit is the amount of profit earned by a firm after deducting explicit cost
from total revenue. Explicit cost includes direct cost to the firm such as cost of raw material,
labour cost and equipment cost. On the other hand, economic profit is the profit earned by the
firm after deducting implicit cost from accounting profit (Kong et al., 2019). The implicit cost is
not direct cost but the cost borne by a firm when it sacrifices any alternative opportunity for
making profit from the current investment (Kim & Tejeda, 2018). The normal profit is known as
zero economic profit that means if the difference between accounting profit and total implicit
cost is equal to zero then the firm is earning normal profit (Kregel, 2017). Normal profit is also
the amount of profit required by a firm to survive in the market.
(b)
(i) The cost of the emu meat is unchanged but the due to some reasons the consumption of emu
meat has increased and consequently the demand for the product has increased. The producers of
emu meat will perceive that if they increase the supply they can earn more profit keeping the
price unchanged. Thus, with increased amount of demand the profit of the industry will increase
given the cost of production.
(c) As the amount of demand has increased, the scope of profit has increased too. Due to this
reason new firms are willing to enter the industry and thus with low barriers to entry there is low
there will be significant amount of entry in the industry (Oliveira, 2017). New firms will keep on
entering the industry as long as the profit of eh firms come down to zero economic profit from
supernormal profit.

6Microeconomics
(d) In the long run, there will be no fixed cost and as the cost are variable then the firms will be
able to abandon any capital that increases the cost of the firms of the industry. Apart from that,
there will be technological innovation and thus there is no barriers to entry and exit (Iwasaki,
Maurel & Meunier, 2016). Due to this reason, until the profit reaches zero economic or normal
profit level firms enter the industry. Thus, in the long run there will be normal profit in the
industry.
(e) In the long run, there is no barriers to entry and exit in the industry due to non-existence of
fixed cost and thus as long as positive profit is there firms keep on entering the industry.
Therefore, in the long run firms only earn the profit that will just let them to survive in the
industry.
Answer 4
(i)
Diagram 1: Income effect on inferior
good
Source: (Created by the Author)
A good whose consumption is lowered or stopped as the income of consumer increases is
called an inferior good (Ghosh. Ali & Ghosh, 2016). It means that if the income of a consumer
Paraphrase This Document
Need a fresh take? Get an instant paraphrase of this document with our AI Paraphraser

7Microeconomics
increases from I to I* as shown in diagram 1 then the consumer lowers the consumption of
inferior good from Q to Q*. For example, public transport is an inferior good because as the
income of people increase they will buy car and travel on it rather than on a bus.
(ii)
Diagram 2: Effect of price fall on demand
of substitute good
Source: (Created by the Author)
Substitute goods are the goods which are similar and identical to a particular good such
that the utility gained by the substitute good is same as the main good. For example, tea is a
substitute good of coffee (Rosato, 2016). Both are hot drinks and act as beverage. Thus, if the
price of coffee increases than the price of tea then people would consume less coffee and
increases the consumption of tea. Similarly, if the price of L decreases from P1 to P2such that it
becomes more affordable given the price of good M, then the consumption of good M decreases
from Q1 to Q2 as shown in diagram 2.
(iii)

8Microeconomics
Diagram 3: Income effect on demand of normal good
Source: (Created by the Author)
The normal good is the good the demand for which increases with increase in income and
declines with fall in income (Bartling, Valero & Weber, 2018). For normal good, the income
elasticity is equal to 1 and thus the fall in demand for good K from Q1 to Q2 is directly
proportional and fell by the same percentage as did the income from I1 to I2.
(iv)
Diagram 4: Effect of price increase on
demand of complementary good
Source: (Created by the Author)
Complementary goods are the goods which are consumed together with another good.
For example, bread and butter are complementary goods (Babaioff, Blumrosen & Nisan, 2017)
. Thus, if the consumption of bread decreases due to rise in its price then due to induced

9Microeconomics
effect the demand for butter will also fall. Similarly, in this case, good J and good K are
complementary goods and the price of J increases from P1 to P2. Consequently, the demand for
good declined from Q1 to Q2 as shown in diagram 4.
Answer 6
Diagram 6: Market of lawn mowing before
takeover-perfect competition
Source: (Created by the Author)
Secure Best Marks with AI Grader
Need help grading? Try our AI Grader for instant feedback on your assignments.

10Microeconomics
Diagram 7: Market of lawn mowing after takeover-monopoly
Source: (Created by the Author)
There are four types of market structure in the industry and they are perfectly
competition, monopolistic competition, oligopoly and monopoly. The lawn mowing industry is a
perfectly competitive industry. It means that the industry has numerous buyers and numerous
sellers. With large number of sellers in the market the buyers has the option to bargain more
because if one seller is not lowering the price of the product to the level at which buyer is willing
to buy then the buyer cab go to another seller (Gerakos & Syverson, 2017). In this way sellers
have the less opportunity to keep the buyer and thus to get buyers and maximize revenue they
keep the price as low as possible. Thus, in perfectly competitive market structure sellers do not
have any power over the market. One of the reasons that lawn mowing industry is perfectly
competitive is single and non-unique product. Thus, any firm can willing to enter the market can
make it very easily. In addition to that, the industry do not have enough fixed cost (Irawan et al.,
2019). It is thus clear that there is no barriers to entry and exit in the market. The profit
maximized in the industry where marginal cost, marginal revenue and price is equalized.
Diagram 6 shows the structure of perfectly competitive firm in lawn mowing industry. Under
perfect competition, lawn mowing firms earn normal or zero economic profit.
All the firms in the lawn mowing industry is when acquired by a single firm then the
industry becomes monopoly in nature. Then the single firm will have the complete control over
the market. The firm will charge high price and as the buyers have no other option to buy from

11Microeconomics
and thus they will have to pay the high price. The market has high barriers to entry and exit.
Thus, no new firm will dare to enter the industry in fear of making high loss. The demand curve
in perfect competition is horizontal but is downward sloping in monopoly (Merhav, 2017). It is
the reason of high price in monopoly market than the perfect competition. A firm in the
monopoly market structure earns super normal profit. The amount of quantity traded in
monopoly market is lower than the perfectly competitive market.
Therefore, from the above discussion on perfectly competitive lawn mowing industry and
monopoly lawn mowing industry it can be inferred that the price in monopoly market is higher
than perfectly competitive market but the output produced is higher in the case of perfectly
completive lawn mowing industry (Herrera & Botero, 2016). The low productivity but high price
in monopoly market along with existence of super normal profit it is evident that the resource
allocation is inefficient in the lawn mowing industry under monopoly market structure in
comparison to perfectly competition.
The lawing mowing industry has a non-unique single product and thus replication of the
product is very easy and apart from that production of the product does not require any
significant amount of investment and thus fixed cost requirement is low too. Therefore, it is hard
for the single firm to keep the monopoly market structure in the lawn mowing industry. Thus,
monopoly market structure of the industry would not survive.

12Microeconomics
Reference
Babaioff, M., Blumrosen, L., & Nisan, N. (2017). Selling complementary goods: Dynamics,
efficiency and revenue. arXiv preprint arXiv:1706.00219.
Bartling, B., Valero, V., & Weber, R. A. (2018). Is social responsibility a normal good?.
Bush, J. L., Bush, H. M., Coker, A. L., Brancato, C. J., Clear, E. R., & Recktenwald, E. A.
(2018). Total and marginal cost analysis for a high school based bystander
intervention. Journal of school violence, 17(2), 152-163.
Gerakos, J., & Syverson, C. (2017). Audit firms face downward-sloping demand curves and the
audit market is far from perfectly competitive. Review of Accounting Studies, 22(4),
1582-1594.
Ghosh, D. K., Ali, H. E., & Ghosh, D. (2016). Is a Necessary Good Necessarily an Inferior
Good? Slutsky Equation is Re-examined. Frontiers in Finance & Economics, 13(1).
Herrera, J. G., & Botero, J. F. (2016). Resource allocation in NFV: A comprehensive
survey. IEEE Transactions on Network and Service Management, 13(3), 518-532.
Irawan, C. A., Luis, M., Salhi, S., & Imran, A. (2019). The incorporation of fixed cost and
multilevel capacities into the discrete and continuous single source capacitated facility
location problem. Annals of Operations Research, 275(2), 367-392.
Iwasaki, I., Maurel, M., & Meunier, B. (2016). Firm entry and exit during a crisis period:
Evidence from Russian regions. Russian Journal of Economics, 2(2), 162-191.
Kim, M. K., & Tejeda, H. (2018). Implicit Cost of the 2010 Foot-and-Mouth Disease in
Korea. Studies in Agricultural Economics, 120(1316-2018-5020), 166-173.
Paraphrase This Document
Need a fresh take? Get an instant paraphrase of this document with our AI Paraphraser

13Microeconomics
Kong, J., Kim, S. T., Kang, B. O., & Jung, J. (2019). Determining the size of energy storage
system to maximize the economic profit for photovoltaic and wind turbine generators in
South Korea. Renewable and Sustainable Energy Reviews, 116, 109467.
Kregel, J. A. (2017). Rate of profit, distribution and growth: two views. Routledge.
Merhav, M. (2017). Technological dependence, monopoly, and growth. Elsevier.
Oliveira, A. V. (2017). An empirical model of low-cost carrier entry. In Low Cost Carriers (pp.
89-112). Routledge.
Rosato, A. (2016). Selling substitute goods to loss‐averse consumers: limited availability,
bargains, and rip‐offs. The RAND Journal of Economics, 47(3), 709-733.
1 out of 14
Related Documents

Your All-in-One AI-Powered Toolkit for Academic Success.
+13062052269
info@desklib.com
Available 24*7 on WhatsApp / Email
Unlock your academic potential
© 2024 | Zucol Services PVT LTD | All rights reserved.