Economics Assessment: Micro and Macro Analysis of Australian Economy

Verified

Added on  2023/03/31

|10
|1388
|132
Homework Assignment
AI Summary
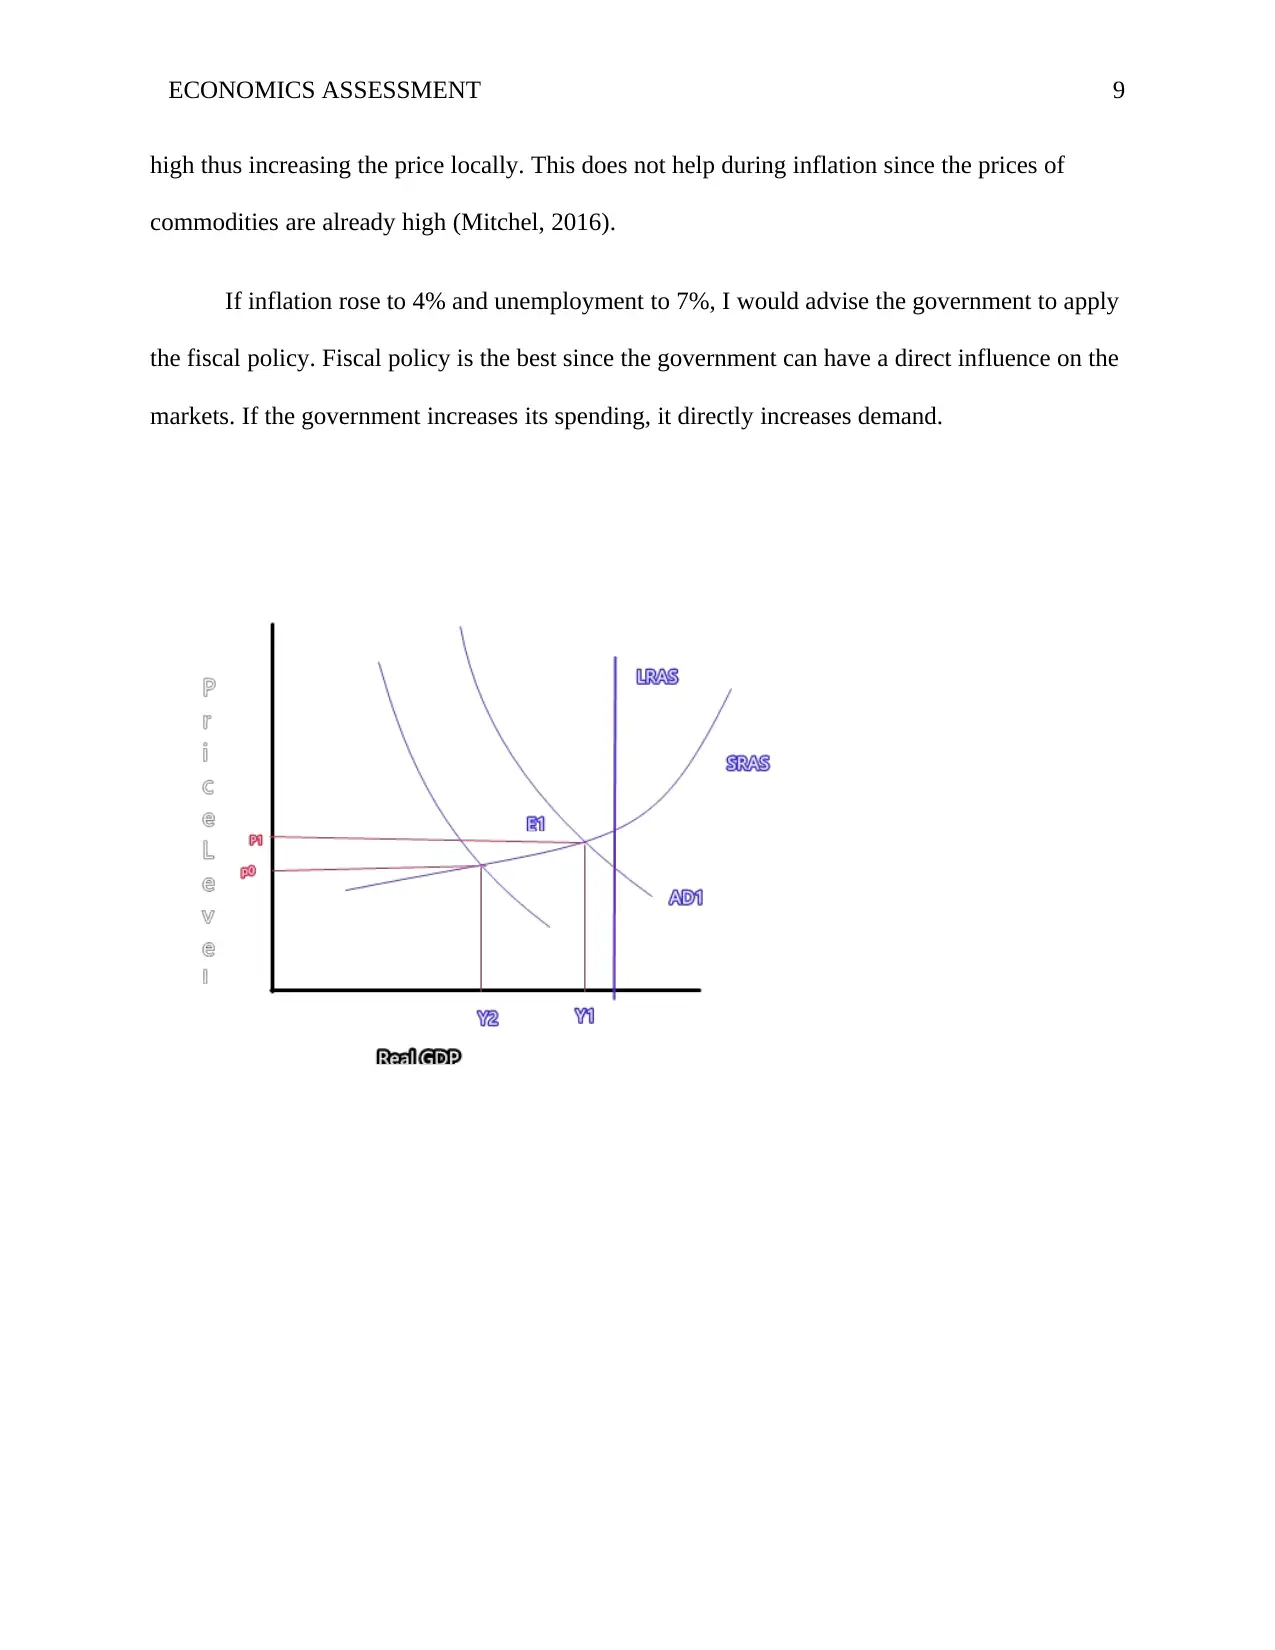
This economics assessment examines the Australian banking industry, market structures, and the impact of the global financial crisis from a microeconomic perspective, including the effects of collusion and government interventions to promote competition. The macroeconomics section analyzes discretionary fiscal policy, aggregate demand, and the state of the Australian economy in 2014 and beyond, including the impact of fiscal policies, RBA monetary policy, and external factors like global market conditions and inflation. The assessment includes diagrams and references, providing a comprehensive analysis of economic concepts and their application to the Australian context.
Document Page
Running head: ECONOMICS ASSESMENT 1
MICROECONOMICS AND MACROECONOMICS
NAME
PROFESOR
INSTITUTION
tabler-icon-diamond-filled.svg

Paraphrase This Document

Need a fresh take? Get an instant paraphrase of this document with our AI Paraphraser
Document Page
ECONOMICS ASSESSMENT 2
Part A: microeconomics
Question 1
The Australia banking industry is among one of the biggest in the world with some banks
having branches overseas. Australian banks operate on an oligopoly market structure. The
industry has four major banks that control 85% of the market share. These banks include
common wealth bank of Australia, Australia and New Zealand Banking Group, national
Australia Bank and Westpac Banking Cooperation (The Structure of the Australian Financial
System, 2006). There are other smaller banking institutions in the country but they do not have
so much influence on the market.
The global financial crisis had a negative effect on the competition in the banking sector.
Competition prior the global financial crisis was far more than after. Even though there was still
the dominance of the major banks, the smaller banks also offered competition. After the financial
crisis, most of these smaller institutions exited the market and those that remained had a slow
growth. Most of these institutions especially the non-banking ones mostly depended on
securitization markets for funding. The securitization markets closed after the financial crisis.
Question 2
If the four biggest banks in Australia decide to collude to change a high price on banking
products, they will act like a monopoly. The banks can hold down the industry output, charge a
higher price on products and divide the profits among themselves. The banks will produce a
monopoly output and charge a corresponding price. Their marginal revenue (MR) will be equal
Document Page
ECONOMICS ASSESSMENT 3
to their marginal cost (MC) (Collusion or Competition?). In this situation, customers will have to
bare the high cost of products while the banks enjoy high profits.
The graph below represents the effect of the bank’s collision.
When the banks collude, their MR=MC just like in a monopoly. . Just as in a monopoly, these
banks would be anonymously dictating the prices of their products thus fully controlling the
market. This means that consumers will have to spend more to acquire services at a high price
which otherwise would have been acquired at lower prices.
Question 3
After the financial crisis, most of the small financial institutions either withdrew from the
market or lowered down their activities. This meant that the diversity in the market had gone
Document Page
ECONOMICS ASSESSMENT 4
down and there was no competition in the market. In order to increase competition in the market
the government has been encouraging competition in the market. This is being achieved by
Opening the door for new banking institution and a more diverse service. This will mean more
and better choices for the consumers, and at affordable prices.
The government also plans to minimize regulatory barriers to new and innovative
entrants into the market. The prohibition on the term ‘bank’ by ADIs with less than $50 million
in capital will also be lifted by legislation to allow them and other ADIs to benefit from the
reputational advantages of the term.
As demonstrated in the above graph, this is very necessary. If the government does not
encourage competition, then the market will be at a risk of being in a monopoly like type where
the biggest banks dictate the products and prices in the market. This reduces innovation in the
market which is helps in diversifying products offered by banks thus increasing competition
which results to low prices which helps in customer satisfaction.
Question 4
New businesses enter a market during periods where the existing firms are making
economic profits. When existing firms make economic profits, other prospect firms are enticed
into entering the market. Further entry is ended when existing firms make zero economic profits.
Figure 1
tabler-icon-diamond-filled.svg

Paraphrase This Document

Need a fresh take? Get an instant paraphrase of this document with our AI Paraphraser
Document Page
ECONOMICS ASSESSMENT 5
economic profits Category 2 Category 3 Category 4
0
2
4
6
8
10
12
market entry
end of entry
Column1
Part B: macroeconomics
Question 1:
Discretional fiscal policy is a change in government spending and taxes. Aggregate
demand = consumption + investments + Government expenditure + Net exports. An increase in
any of the factors above will lead to an increase in demand. This policy is used to shrink or
expand the economy when need be. If the economy slows down, the government can lower taxes
on goods and services. This increases expenditure and thus increasing the aggregate demand.
The government can also increase its expenditure and therefore directly increasing the demand
(Agarwal, 2019).
Figure 2
Document Page
ECONOMICS ASSESSMENT 6
expenditure
0
1
2
3
4
5
6
7
8
9
Aggregate Demand
Column1
Column2
Question 3 figure 3
Document Page
ECONOMICS ASSESSMENT 7
In 2014 the economy was far from achieving full employment. The above figure 3 shows
an AD/AS model explaining this. In an ADL/AS model, high employment is represented when
the level of output y2 at equilibrium E0 is relatively far from the potential GDP. This represents
an economy in recession and its way below the full employment level of the GDP (OpenStax).
During this period the economy was in a correction phase of business cycle. The period
was characterized by a slow economic growth, low employment rates and as shown from the
above AD/AS diagram, prices and aggregate demand were falling ( Phases of Business Cycles in
Australia).
Question 3
The economy has been on a slow down since the last half of 2018. This has been due to
low housing prices. This has limited the number of new houses and also the consumers are not
spending as much. In light of these factors, the government has cut on taxes, and increased its
spending on the transport and infrastructure in the fast growing cities (Guttmann, 2019). This
fiscal policy is good for the economy because it will increase the aggregate demand therefore
increasing prices. As diagram 2 shows, as expenditure grows, the aggregate demand grows too.
This will encourage investors to pump invest thus creating employment and increasing
household income which leads to an increase in spending.
Question 4
The economy growth has been slow since the last half of 2018 into 2019. This has been
due to the slowing down of the global financial markets, slow domestic expenditure, decrease in
foreign investment demand disruption of exports by weather conditions and drought.
tabler-icon-diamond-filled.svg

Paraphrase This Document

Need a fresh take? Get an instant paraphrase of this document with our AI Paraphraser
Document Page
ECONOMICS ASSESSMENT 8
The RBA has managed the inflation by lowering interest rates, the bank has also held the
cash rate steady at 1.5%. This this policy is good to the economy in the long run. The low
interest rates will encourage investors to acquire loans (Minutes of the Monetary Policy Meeting
of the Reserve Bank Board, 2019). An increase in investments increases employment which
hence an increase in wages and expenditure therefore increasing aggregate demand which results
to a stronger economy.
Figure 4 i
The graph (figure 4) above shows an increase in aggregate demand (AD) increases when
expenditure increases thus increasing output.
Question 5
A lower dollar would have a negative effect on inflation. This will mostly affect products
that are imported into the country. If the dollar is low then the price of importing products will be
Document Page
ECONOMICS ASSESSMENT 9
high thus increasing the price locally. This does not help during inflation since the prices of
commodities are already high (Mitchel, 2016).
If inflation rose to 4% and unemployment to 7%, I would advise the government to apply
the fiscal policy. Fiscal policy is the best since the government can have a direct influence on the
markets. If the government increases its spending, it directly increases demand.
Document Page
ECONOMICS ASSESSMENT
10
References
Phases of Business Cycles in Australia. n.d.. Retrieved from The University of Melborne:
https://melbourneinstitute.unimelb.edu.au/publications/macroeconomic-reports/phases-
of-business-cycles-in-australia
Agarwal, P. 2019, 4 11. Discretionary Fiscal Policy. Retrieved from Inteligent Economist:
https://www.intelligenteconomist.com/discretionary-fiscal-policy
Collusion or Competition? n.d.. Retrieved from lumencandela :
https://courses.lumenlearning.com/wmopen-microeconomics/chapter/collusion-or-
competition/
Guttmann, D. R. 2019, 5 1. Australia Economy is a Tale of Two Halves. Retrieved from Deloite
Insights: https://www2.deloitte.com/insights/us/en/economy/asia-pacific/australia-
economic-outlook.html
Minutes of the Monetary Policy Meeting of the Reserve Bank Board. 2019, 4 2. Retrieved from
Reserve Bank of Australia:
https://www.rba.gov.au/monetary-policy/rba-board-minutes/2019/2019-04-02.html
Mitchel, B. 2016, 7 27. Australian inflation rate – trending down and reflecting a weak economy.
Retrieved from Macroeconomic research, teaching and advocacy:
http://bilbo.economicoutlook.net/blog/?p=34061
OpenStax. n.d.. PRINCIPALS OF ECONOMICSThe Aggregate Demand/Aggregate Supply
Model. In OpenStax, PRINCIPALS OF ECONOMICS (p. Chapter 24.4). Creative
Commons Attribution 4.0 International Licence.
The Structure of the Australian Financial System. 2006, 3 Retrieved from Reserve Bank of
Australia: https://www.rba.gov.au/publications/fsr/2006/mar/struct-aus-fin-sys.html
chevron_up_icon
1 out of 10
circle_padding
hide_on_mobile
zoom_out_icon
[object Object]