Microeconomics and Macroeconomics Assignment for ECOM4000 Students
VerifiedAdded on 2022/08/18
|12
|1761
|20
Homework Assignment
AI Summary
This assignment delves into microeconomic and macroeconomic principles, offering solutions to various economic scenarios. Part A examines market structures, specifically focusing on the oligopoly in the Australian retail industry, comparing Coles and Woolworths. It analyzes pricing decisions, price wars, and the impact on vegetable farmers in a perfectly competitive market. Part B shifts to macroeconomic concepts, analyzing business cycles in Spain, including the recession of 2013 and the boom phase of 2014. The assignment further calculates unemployment rates and explores factors driving India's economic growth, including energy prices and private consumption. It concludes by identifying GDP growth as a key indicator and the role of monetary policy in managing economic growth.
Running head: MICROECONOMICS AND MACROECONOMICS
Microeconomics and Macroeconomics
Name of the Student
Name of the University
Student ID
Microeconomics and Macroeconomics
Name of the Student
Name of the University
Student ID
Paraphrase This Document
Need a fresh take? Get an instant paraphrase of this document with our AI Paraphraser
1MICROECONOMICS AND MACROECONOMICS
Table of Contents
Part A...............................................................................................................................................2
Answer 1......................................................................................................................................2
Answer 2......................................................................................................................................2
Answer 3......................................................................................................................................3
Answer 4......................................................................................................................................3
Part B...............................................................................................................................................4
Answer 1......................................................................................................................................4
Answer 2......................................................................................................................................5
Answer 3......................................................................................................................................6
Answer 4......................................................................................................................................7
Answer 5......................................................................................................................................7
Answer 6......................................................................................................................................8
Reference.........................................................................................................................................9
2MICROECONOMICS AND MACROECONOMICS
Part A
Answer 1
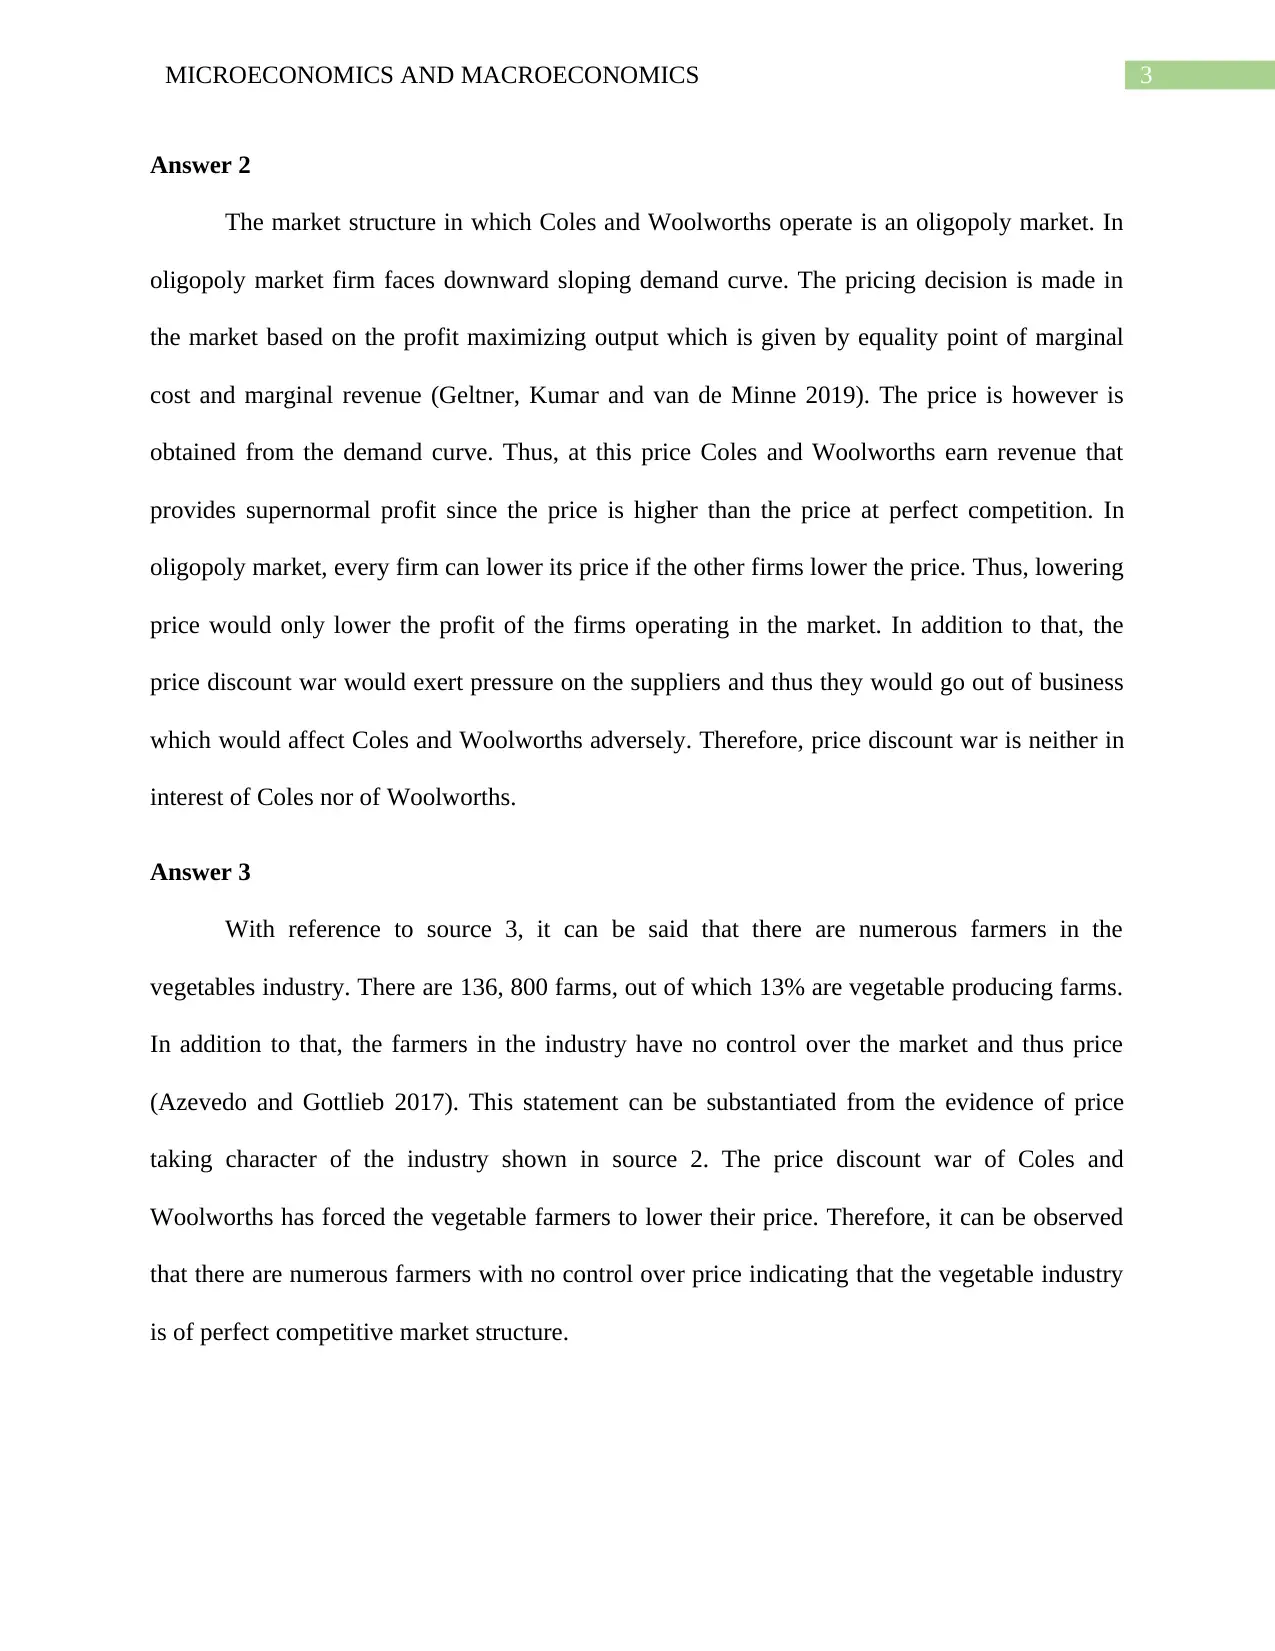
Coles and Woolworths are two big super markets that operate in Australia. They operate
in the retail industry. The retail industry is majorly dominated by four super market companies
and they are Coles, Woolworths, Aldi and IGA. Coles and Woolworths together captures over
60% of the retail market share (Eichner 2019). Therefore, it is evident that there are few firms in
the industry and the firms have market power as they are able to control price. Thus, it can be
said that the markets structure in which Coles and Woolworths operate is of oligopoly in nature
since according to theory of market structure in oligopoly there are few firms with market power
and thus has control over price. The graphical illustration of the market structure is given in
figure 1.
Figure 1: Oligopoly retain industry in Australia
Source: (Created by the Author)
Part A
Answer 1
Coles and Woolworths are two big super markets that operate in Australia. They operate
in the retail industry. The retail industry is majorly dominated by four super market companies
and they are Coles, Woolworths, Aldi and IGA. Coles and Woolworths together captures over
60% of the retail market share (Eichner 2019). Therefore, it is evident that there are few firms in
the industry and the firms have market power as they are able to control price. Thus, it can be
said that the markets structure in which Coles and Woolworths operate is of oligopoly in nature
since according to theory of market structure in oligopoly there are few firms with market power
and thus has control over price. The graphical illustration of the market structure is given in
figure 1.
Figure 1: Oligopoly retain industry in Australia
Source: (Created by the Author)
⊘ This is a preview!⊘
Do you want full access?
Subscribe today to unlock all pages.
Trusted by 1+ million students worldwide
3MICROECONOMICS AND MACROECONOMICS
Answer 2
The market structure in which Coles and Woolworths operate is an oligopoly market. In
oligopoly market firm faces downward sloping demand curve. The pricing decision is made in
the market based on the profit maximizing output which is given by equality point of marginal
cost and marginal revenue (Geltner, Kumar and van de Minne 2019). The price is however is
obtained from the demand curve. Thus, at this price Coles and Woolworths earn revenue that
provides supernormal profit since the price is higher than the price at perfect competition. In
oligopoly market, every firm can lower its price if the other firms lower the price. Thus, lowering
price would only lower the profit of the firms operating in the market. In addition to that, the
price discount war would exert pressure on the suppliers and thus they would go out of business
which would affect Coles and Woolworths adversely. Therefore, price discount war is neither in
interest of Coles nor of Woolworths.
Answer 3
With reference to source 3, it can be said that there are numerous farmers in the
vegetables industry. There are 136, 800 farms, out of which 13% are vegetable producing farms.
In addition to that, the farmers in the industry have no control over the market and thus price
(Azevedo and Gottlieb 2017). This statement can be substantiated from the evidence of price
taking character of the industry shown in source 2. The price discount war of Coles and
Woolworths has forced the vegetable farmers to lower their price. Therefore, it can be observed
that there are numerous farmers with no control over price indicating that the vegetable industry
is of perfect competitive market structure.
Paraphrase This Document
Need a fresh take? Get an instant paraphrase of this document with our AI Paraphraser
4MICROECONOMICS AND MACROECONOMICS
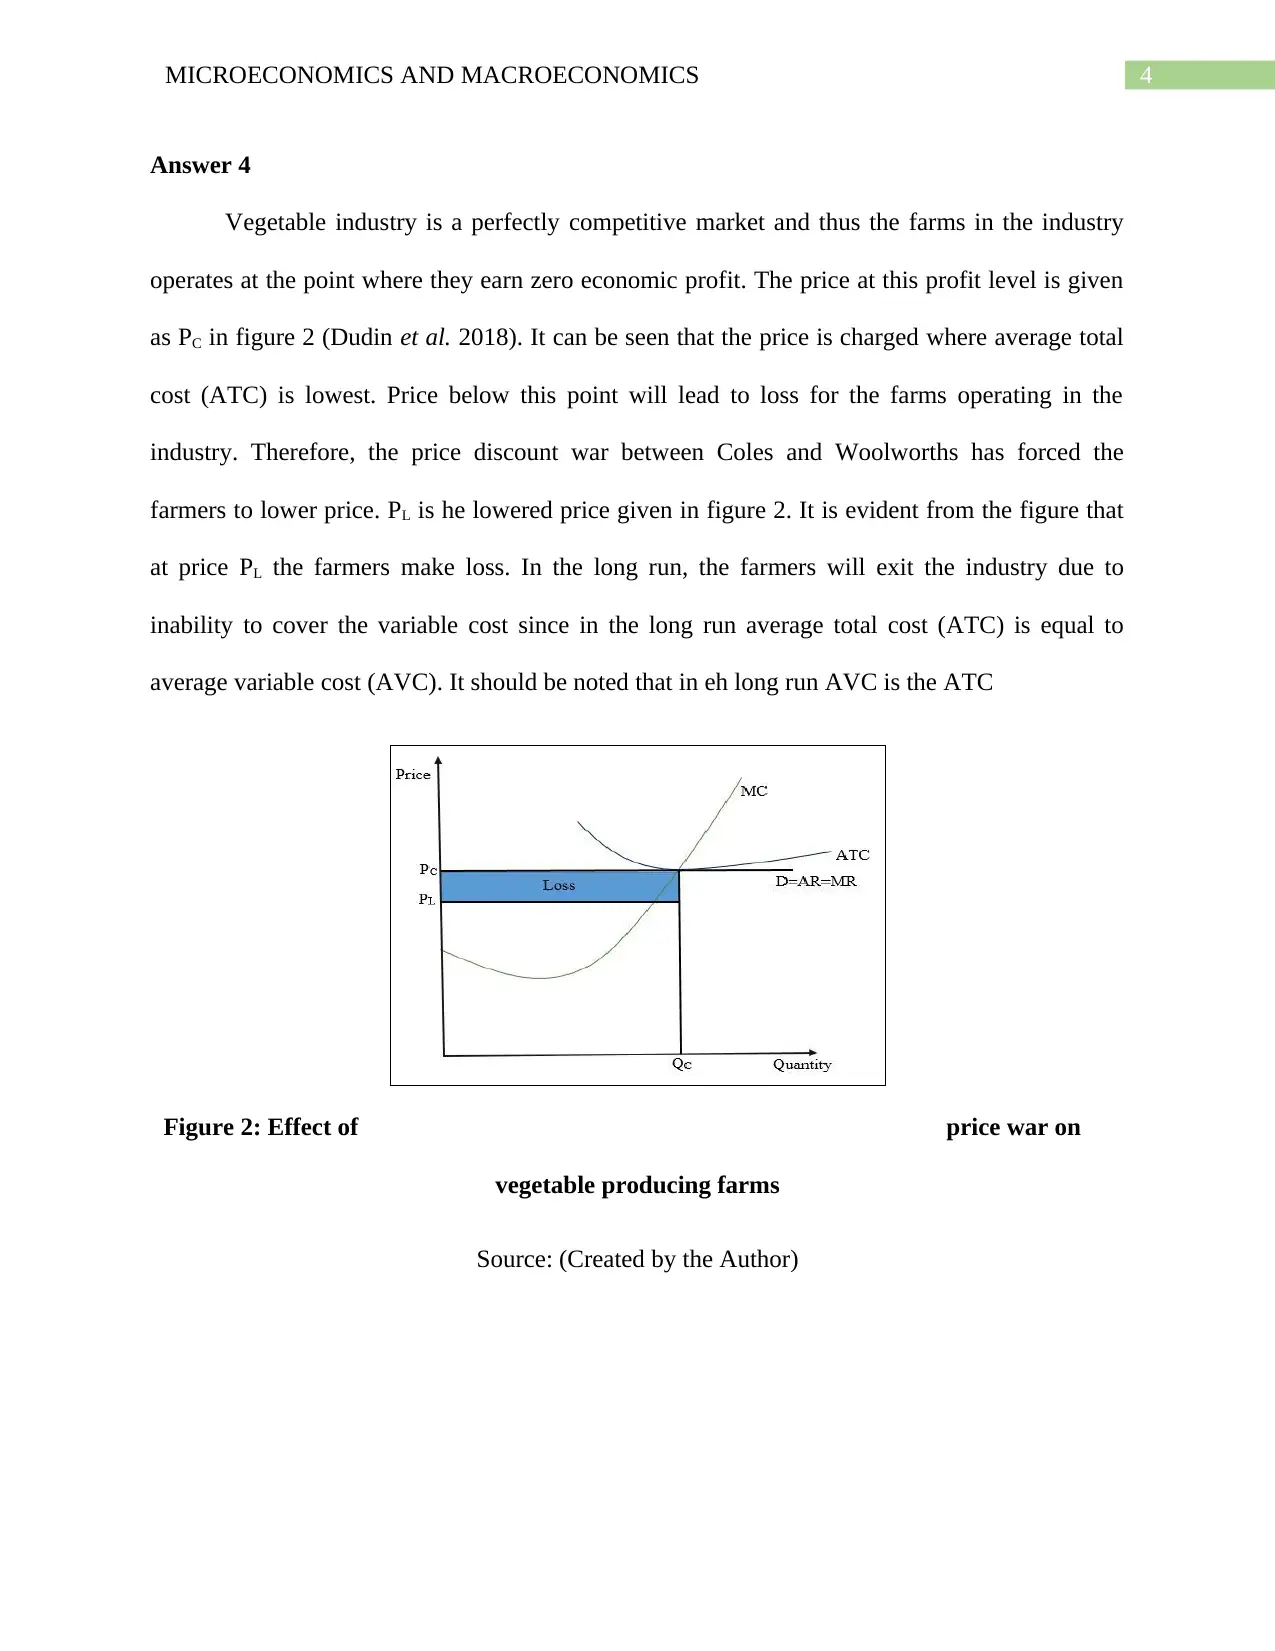
Answer 4
Vegetable industry is a perfectly competitive market and thus the farms in the industry
operates at the point where they earn zero economic profit. The price at this profit level is given
as PC in figure 2 (Dudin et al. 2018). It can be seen that the price is charged where average total
cost (ATC) is lowest. Price below this point will lead to loss for the farms operating in the
industry. Therefore, the price discount war between Coles and Woolworths has forced the
farmers to lower price. PL is he lowered price given in figure 2. It is evident from the figure that
at price PL the farmers make loss. In the long run, the farmers will exit the industry due to
inability to cover the variable cost since in the long run average total cost (ATC) is equal to
average variable cost (AVC). It should be noted that in eh long run AVC is the ATC
Figure 2: Effect of price war on
vegetable producing farms
Source: (Created by the Author)
5MICROECONOMICS AND MACROECONOMICS
Part B
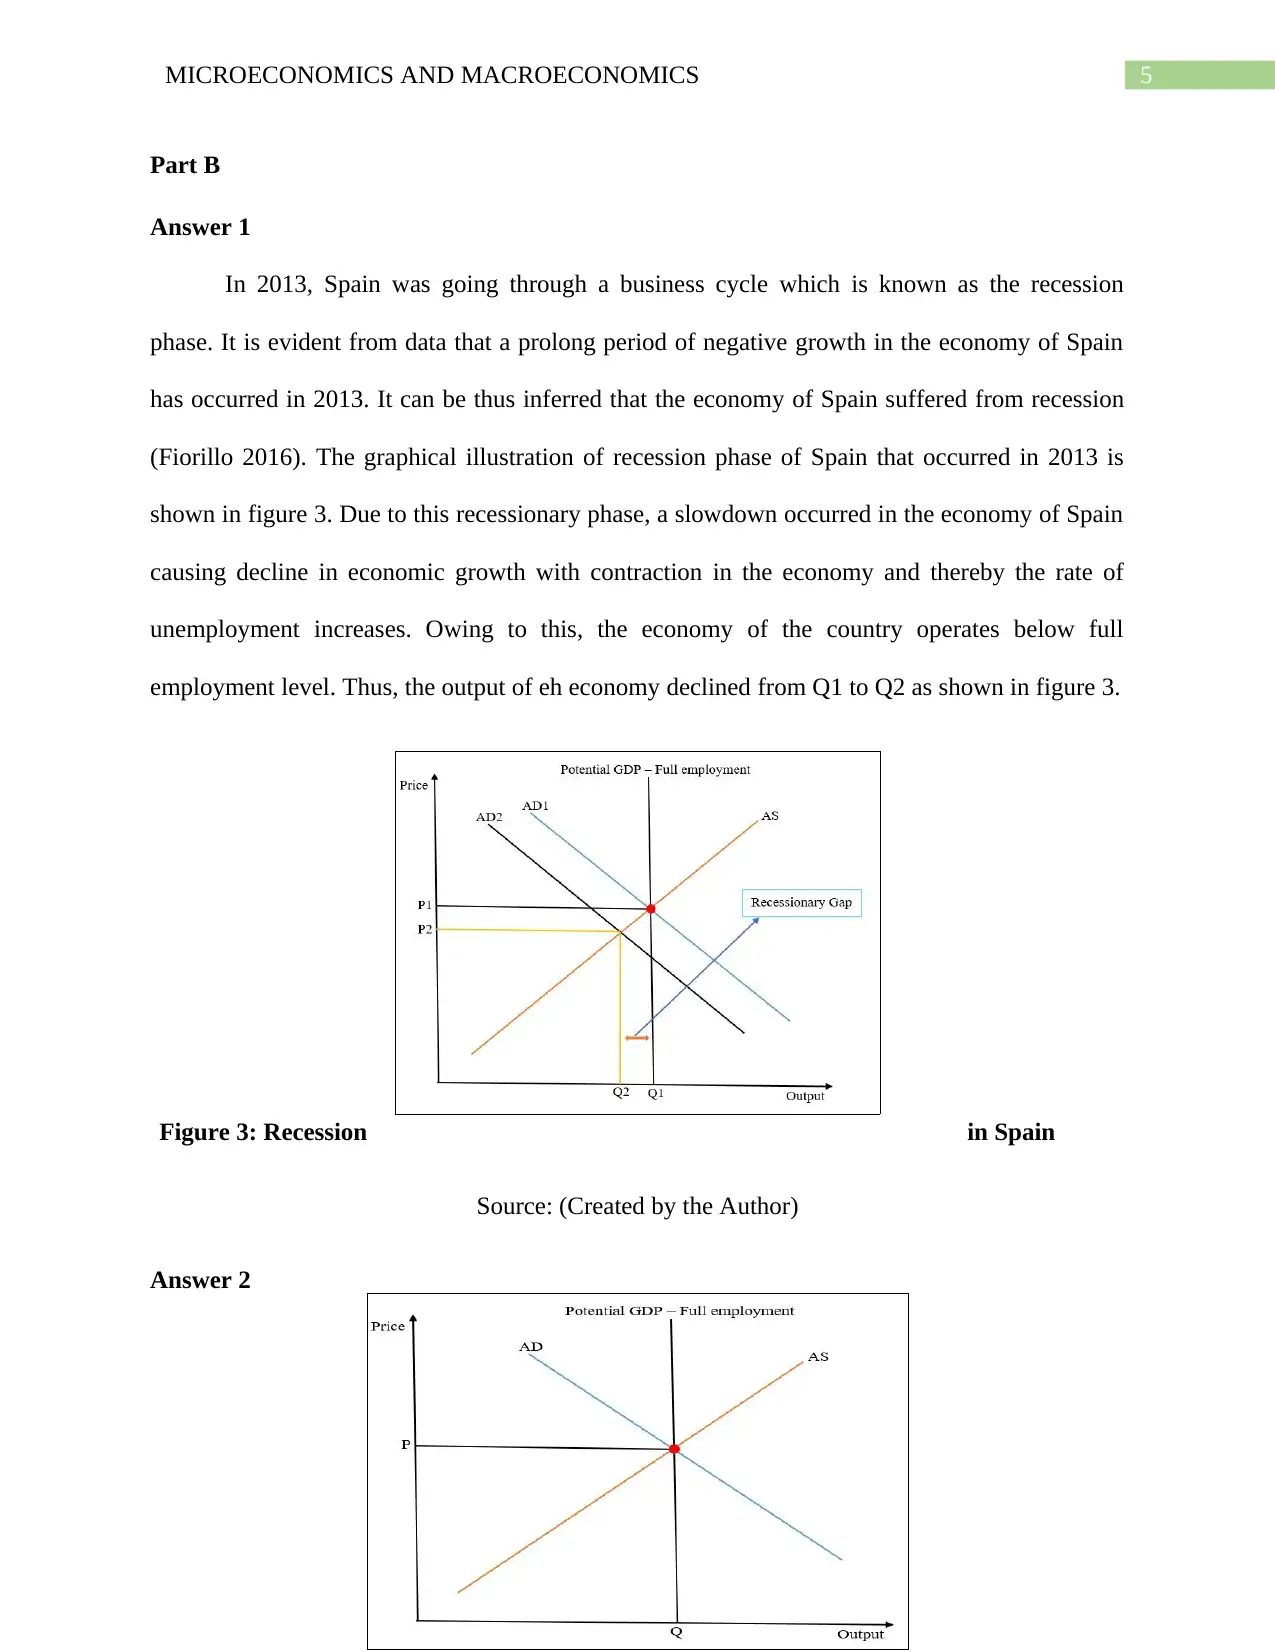
Answer 1
In 2013, Spain was going through a business cycle which is known as the recession
phase. It is evident from data that a prolong period of negative growth in the economy of Spain
has occurred in 2013. It can be thus inferred that the economy of Spain suffered from recession
(Fiorillo 2016). The graphical illustration of recession phase of Spain that occurred in 2013 is
shown in figure 3. Due to this recessionary phase, a slowdown occurred in the economy of Spain
causing decline in economic growth with contraction in the economy and thereby the rate of
unemployment increases. Owing to this, the economy of the country operates below full
employment level. Thus, the output of eh economy declined from Q1 to Q2 as shown in figure 3.
Figure 3: Recession in Spain
Source: (Created by the Author)
Answer 2
Part B
Answer 1
In 2013, Spain was going through a business cycle which is known as the recession
phase. It is evident from data that a prolong period of negative growth in the economy of Spain
has occurred in 2013. It can be thus inferred that the economy of Spain suffered from recession
(Fiorillo 2016). The graphical illustration of recession phase of Spain that occurred in 2013 is
shown in figure 3. Due to this recessionary phase, a slowdown occurred in the economy of Spain
causing decline in economic growth with contraction in the economy and thereby the rate of
unemployment increases. Owing to this, the economy of the country operates below full
employment level. Thus, the output of eh economy declined from Q1 to Q2 as shown in figure 3.
Figure 3: Recession in Spain
Source: (Created by the Author)
Answer 2
⊘ This is a preview!⊘
Do you want full access?
Subscribe today to unlock all pages.
Trusted by 1+ million students worldwide
6MICROECONOMICS AND MACROECONOMICS
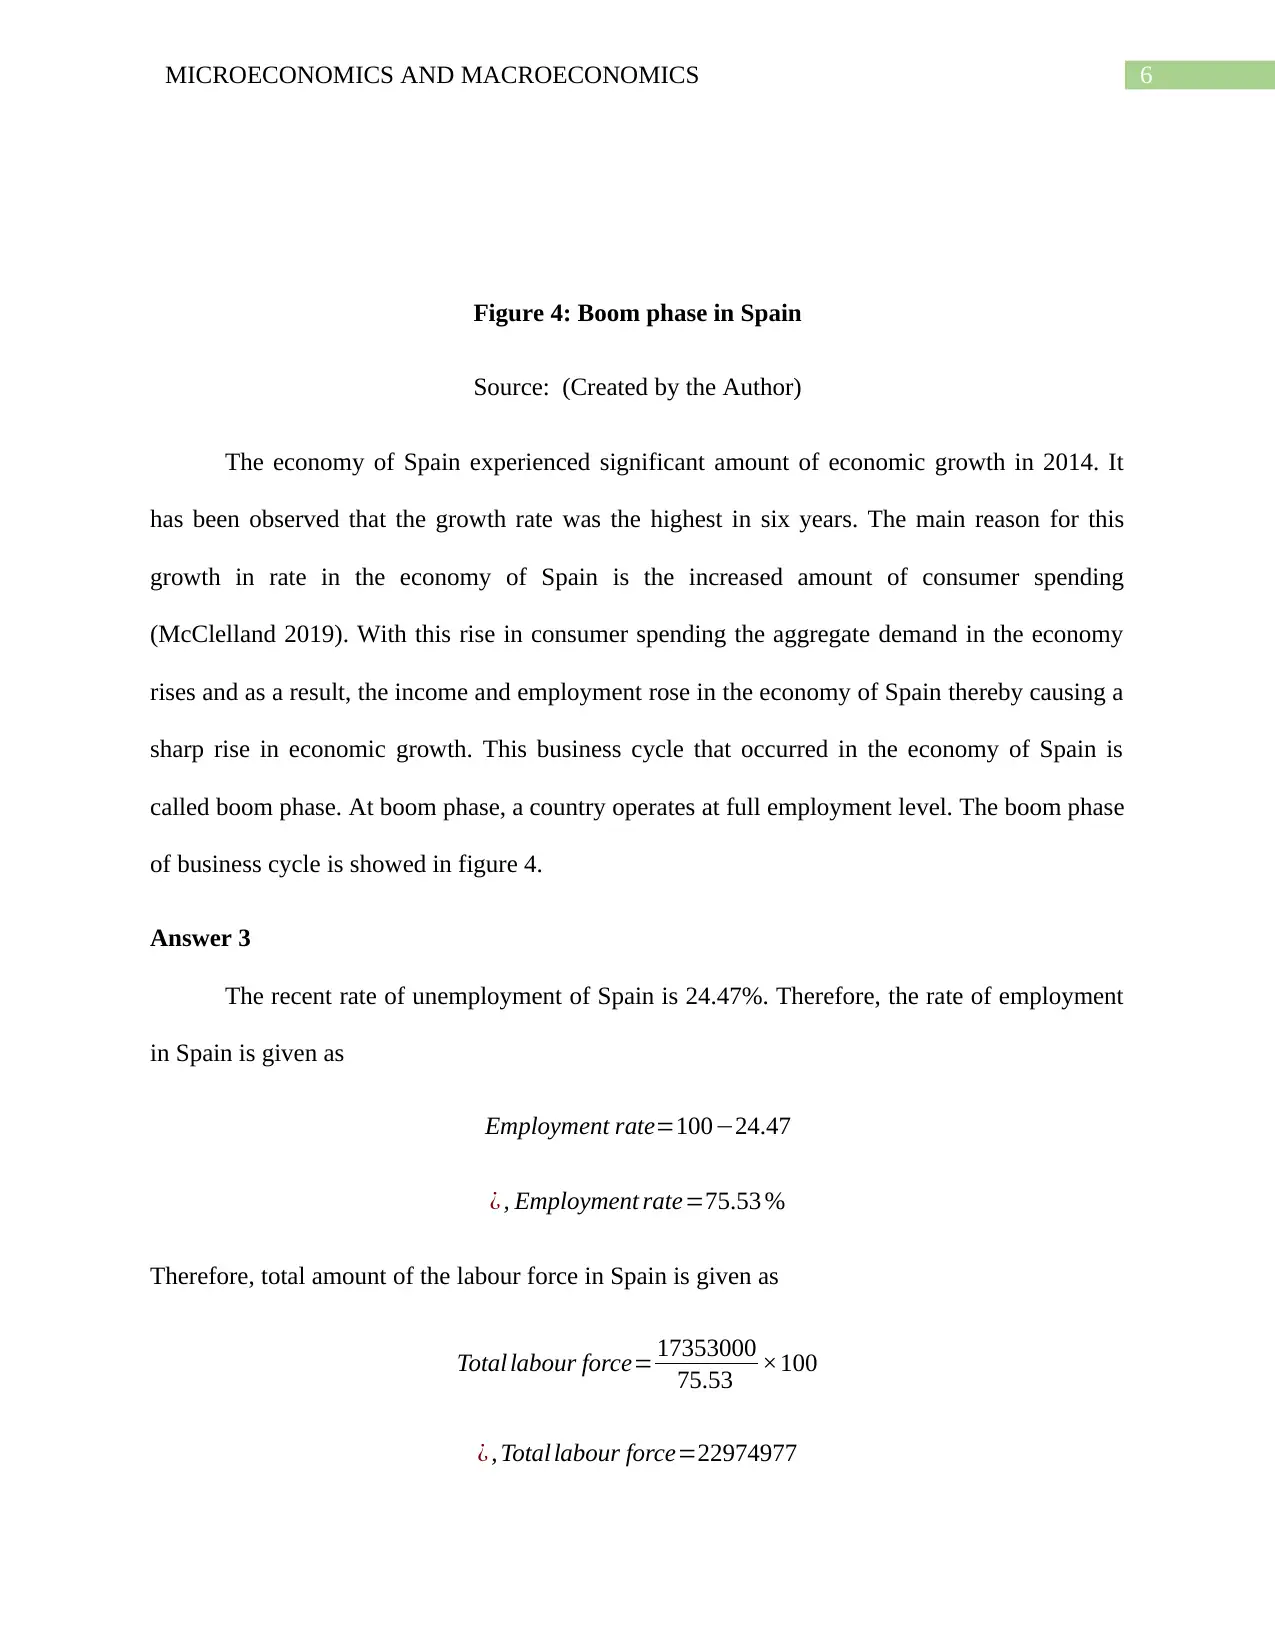
Figure 4: Boom phase in Spain
Source: (Created by the Author)
The economy of Spain experienced significant amount of economic growth in 2014. It
has been observed that the growth rate was the highest in six years. The main reason for this
growth in rate in the economy of Spain is the increased amount of consumer spending
(McClelland 2019). With this rise in consumer spending the aggregate demand in the economy
rises and as a result, the income and employment rose in the economy of Spain thereby causing a
sharp rise in economic growth. This business cycle that occurred in the economy of Spain is
called boom phase. At boom phase, a country operates at full employment level. The boom phase
of business cycle is showed in figure 4.
Answer 3
The recent rate of unemployment of Spain is 24.47%. Therefore, the rate of employment
in Spain is given as
Employment rate=100−24.47
¿ , Employment rate=75.53 %
Therefore, total amount of the labour force in Spain is given as
Total labour force= 17353000
75.53 ×100
¿ , Total labour force=22974977
Paraphrase This Document
Need a fresh take? Get an instant paraphrase of this document with our AI Paraphraser
7MICROECONOMICS AND MACROECONOMICS
Therefore, the number of people that are unemployed in Spain is given as
Number of unemployed people= 24.47 ×22974977
100
¿ , Number of unemployed people=5621977
Therefore, the number of people that are unemployed in Spain is 5621977.
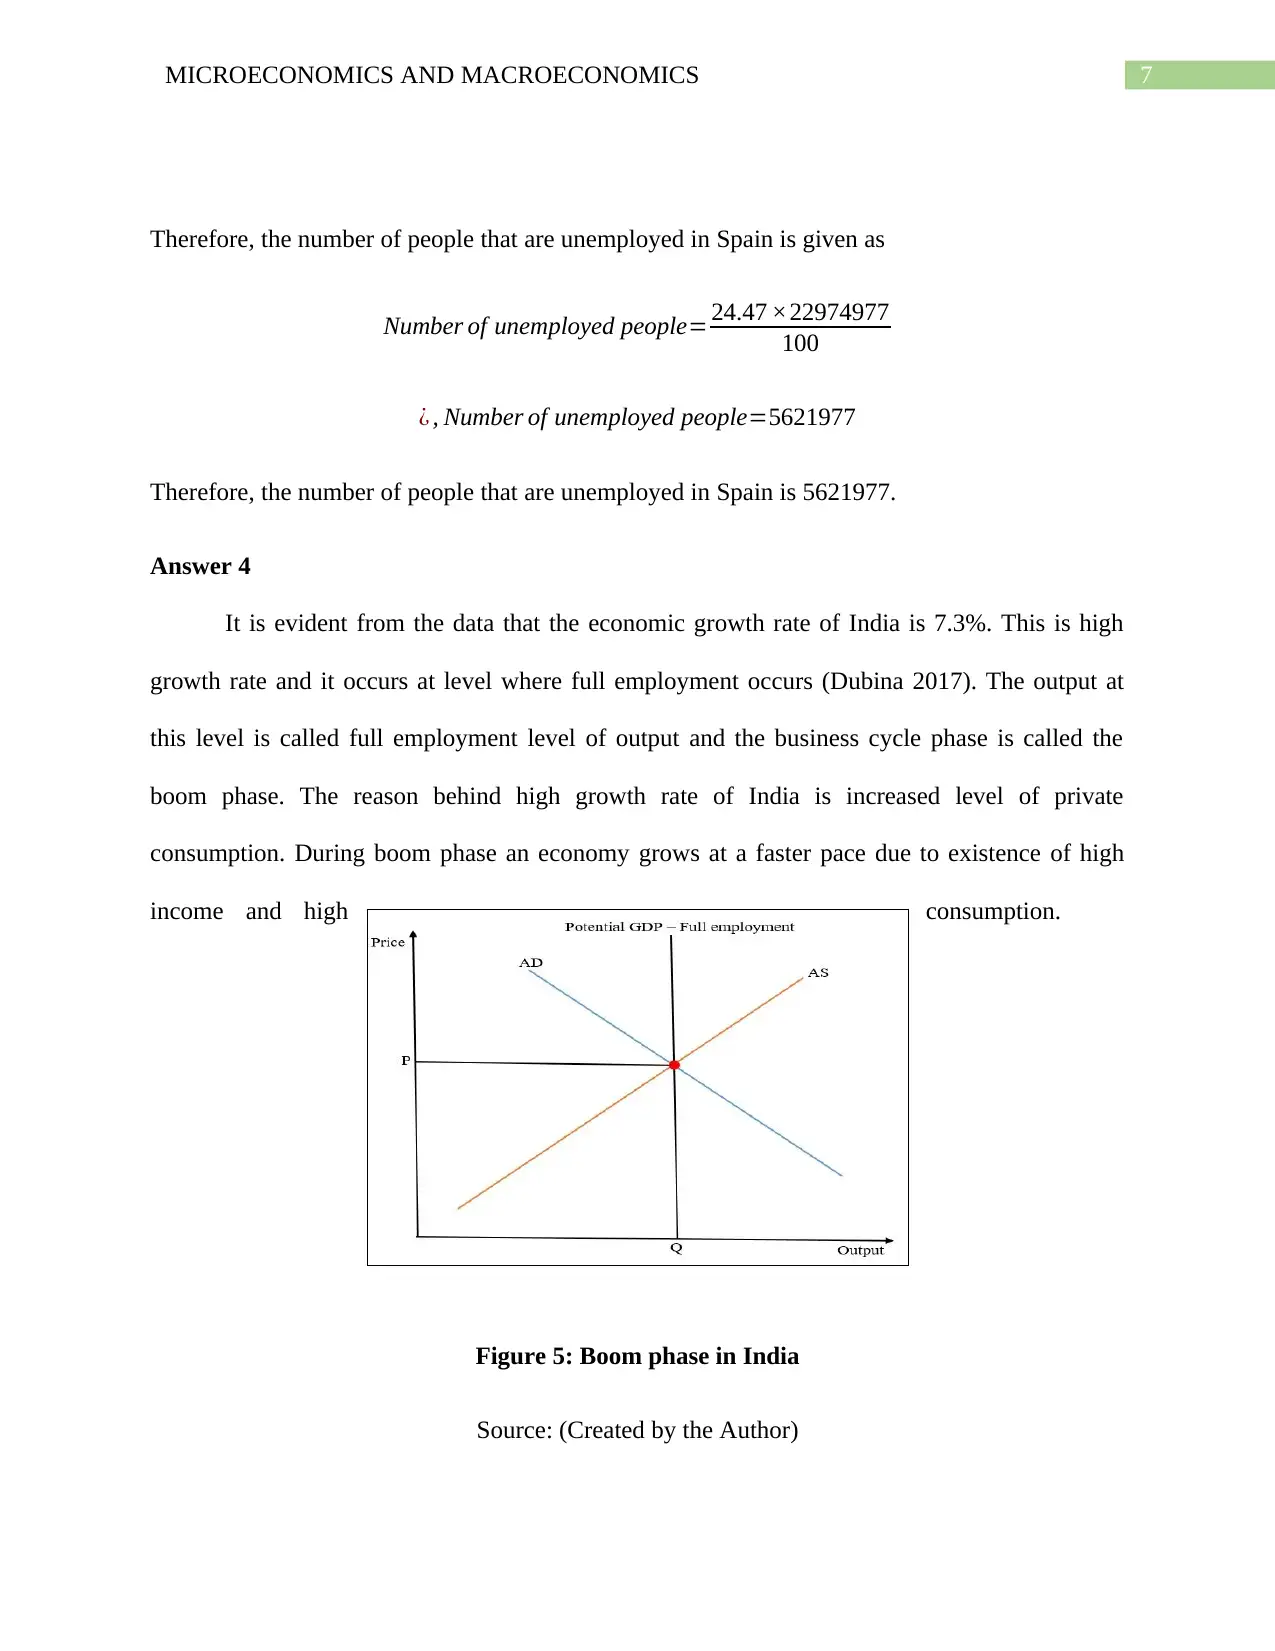
Answer 4
It is evident from the data that the economic growth rate of India is 7.3%. This is high
growth rate and it occurs at level where full employment occurs (Dubina 2017). The output at
this level is called full employment level of output and the business cycle phase is called the
boom phase. The reason behind high growth rate of India is increased level of private
consumption. During boom phase an economy grows at a faster pace due to existence of high
income and high consumption.
Figure 5: Boom phase in India
Source: (Created by the Author)
Therefore, the number of people that are unemployed in Spain is given as
Number of unemployed people= 24.47 ×22974977
100
¿ , Number of unemployed people=5621977
Therefore, the number of people that are unemployed in Spain is 5621977.
Answer 4
It is evident from the data that the economic growth rate of India is 7.3%. This is high
growth rate and it occurs at level where full employment occurs (Dubina 2017). The output at
this level is called full employment level of output and the business cycle phase is called the
boom phase. The reason behind high growth rate of India is increased level of private
consumption. During boom phase an economy grows at a faster pace due to existence of high
income and high consumption.
Figure 5: Boom phase in India
Source: (Created by the Author)
8MICROECONOMICS AND MACROECONOMICS
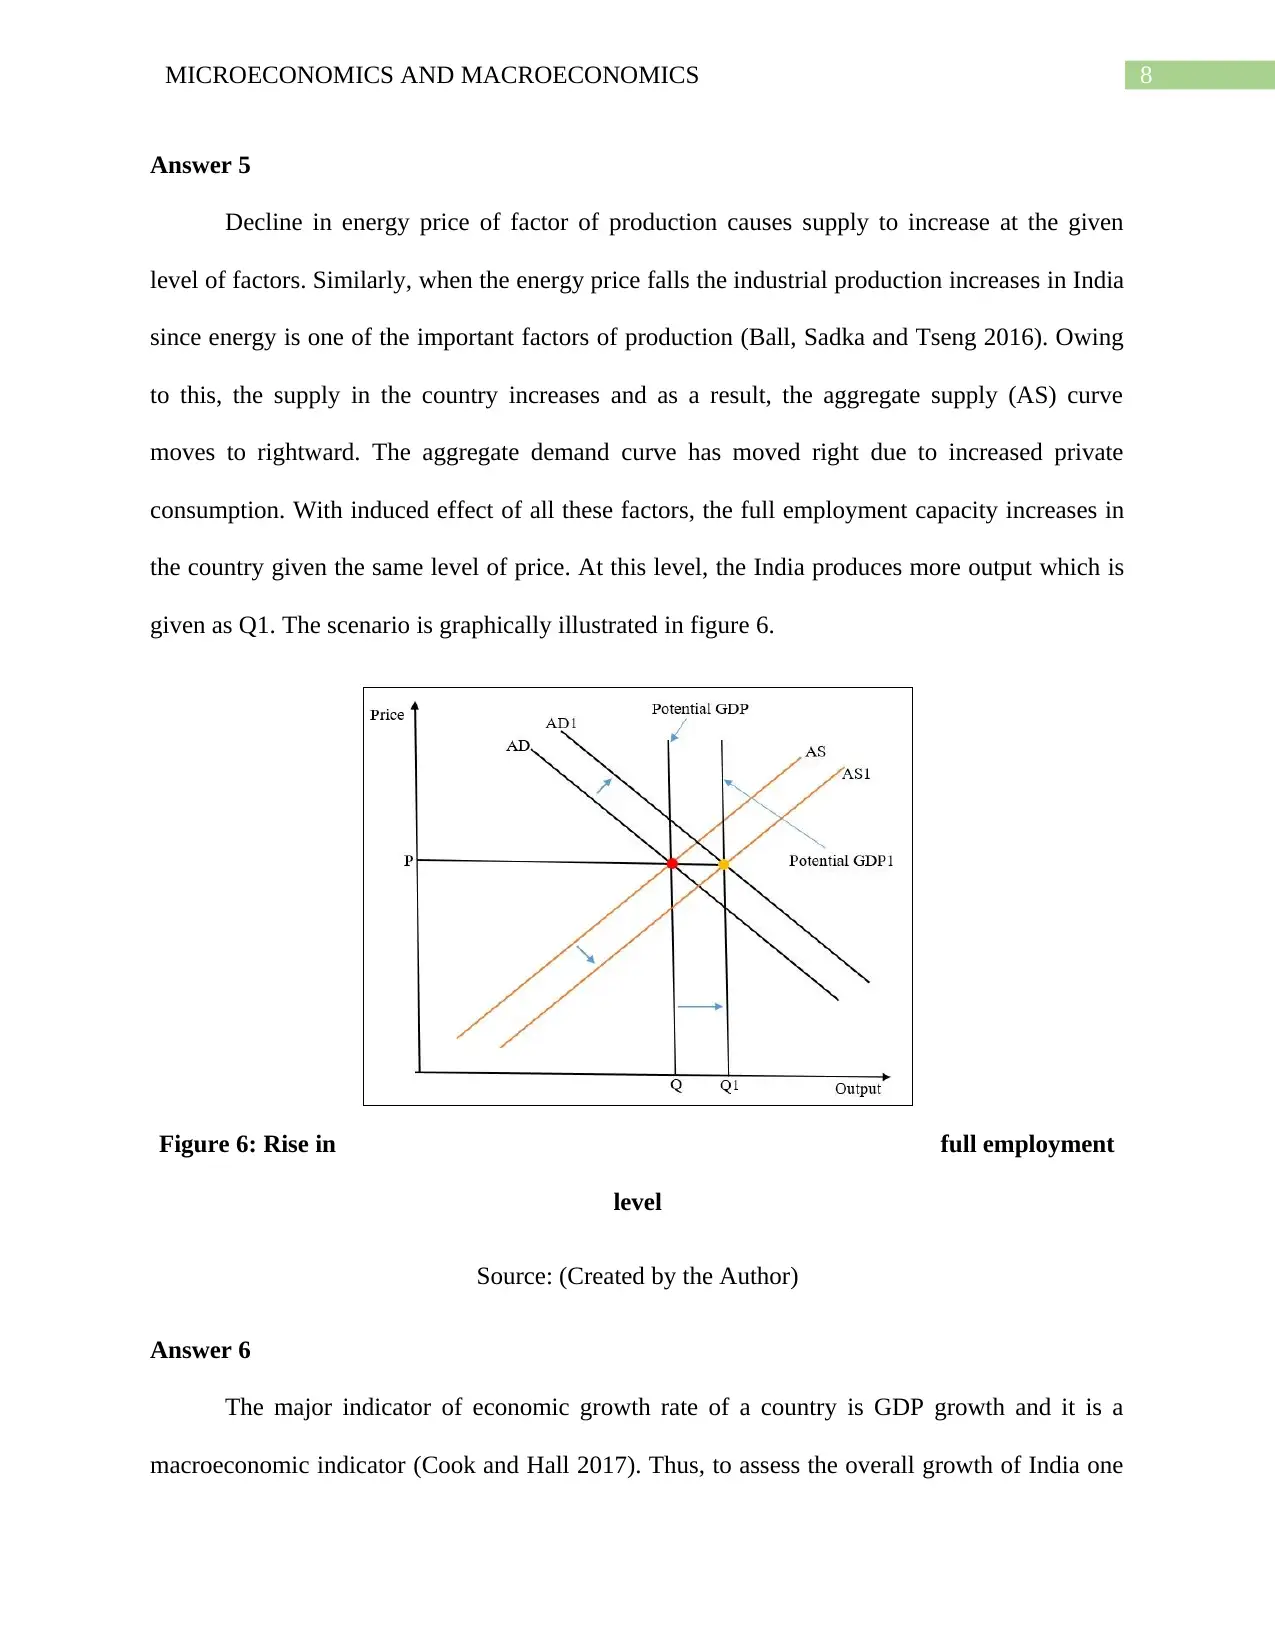
Answer 5
Decline in energy price of factor of production causes supply to increase at the given
level of factors. Similarly, when the energy price falls the industrial production increases in India
since energy is one of the important factors of production (Ball, Sadka and Tseng 2016). Owing
to this, the supply in the country increases and as a result, the aggregate supply (AS) curve
moves to rightward. The aggregate demand curve has moved right due to increased private
consumption. With induced effect of all these factors, the full employment capacity increases in
the country given the same level of price. At this level, the India produces more output which is
given as Q1. The scenario is graphically illustrated in figure 6.
Figure 6: Rise in full employment
level
Source: (Created by the Author)
Answer 6
The major indicator of economic growth rate of a country is GDP growth and it is a
macroeconomic indicator (Cook and Hall 2017). Thus, to assess the overall growth of India one
⊘ This is a preview!⊘
Do you want full access?
Subscribe today to unlock all pages.
Trusted by 1+ million students worldwide

9MICROECONOMICS AND MACROECONOMICS
should monitor GDP growth rate of the country. To control the GDP growth rate, the Reserve
Bank of India uses monetary policy (Kaplan, Moll and Violante 2018). Monetary policy is of
two types, expansionary and contractionary policy. The monetary policy is implemented by
controlling the key rate.
should monitor GDP growth rate of the country. To control the GDP growth rate, the Reserve
Bank of India uses monetary policy (Kaplan, Moll and Violante 2018). Monetary policy is of
two types, expansionary and contractionary policy. The monetary policy is implemented by
controlling the key rate.
Paraphrase This Document
Need a fresh take? Get an instant paraphrase of this document with our AI Paraphraser
10MICROECONOMICS AND MACROECONOMICS
Reference
Azevedo, E.M. and Gottlieb, D., 2017. Perfect competition in markets with adverse
selection. Econometrica, 85(1), pp.67-105.
Ball, R., Sadka, G. and Tseng, A., 2016, September. Aggregate Supply and Demand Shocks and
Asset Prices. In 27th Annual Conference on Financial Economics and Accounting Paper.
Cook, T. and Hall, A.S., 2017. Macroeconomic indicator forecasting with deep neural
networks. Federal Reserve Bank of Kansas City, Research Working Paper, (17-11).
Dubina, K.S., 2017. Full employment: an assumption within BLS projections. Monthly Lab.
Rev., 140, p.1.
Dudin, M.N., Lyasnikov, N.V., Reshetov, K.Y., Smirnova, O.O. and Vysotskaya, N.V., 2018.
Economic profit as indicator of food retailing enterprises’ performance.
Eichner, A.S., 2019. The Emergence of Oligopoly: Sugar refining as a case study. JHU Press.
Fiorillo, F., 2016. Spring hydrograph recession: A brief review focused on karst aquifers. Karst
without Boundaries, 23, p.117.
Geltner, D., Kumar, A. and Van de Minne, A., 2019. Super-Normal Profit in Real Estate
Development. Available at SSRN 3444309.
Kaplan, G., Moll, B. and Violante, G.L., 2018. Monetary policy according to HANK. American
Economic Review, 108(3), pp.697-743.
McClelland, D.C., 2019. The achievement motive in economic growth. In The Gap Between
Rich And Poor (pp. 53-69). Routledge.

11MICROECONOMICS AND MACROECONOMICS
⊘ This is a preview!⊘
Do you want full access?
Subscribe today to unlock all pages.
Trusted by 1+ million students worldwide
1 out of 12
Related Documents


Your All-in-One AI-Powered Toolkit for Academic Success.
+13062052269
info@desklib.com
Available 24*7 on WhatsApp / Email
![[object Object]](/_next/static/media/star-bottom.7253800d.svg)
Unlock your academic potential
Copyright © 2020–2026 A2Z Services. All Rights Reserved. Developed and managed by ZUCOL.