Microeconomics and Macroeconomics Problem Solving Exercise - Course ID
VerifiedAdded on 2022/11/22
|13
|1263
|447
Homework Assignment
AI Summary
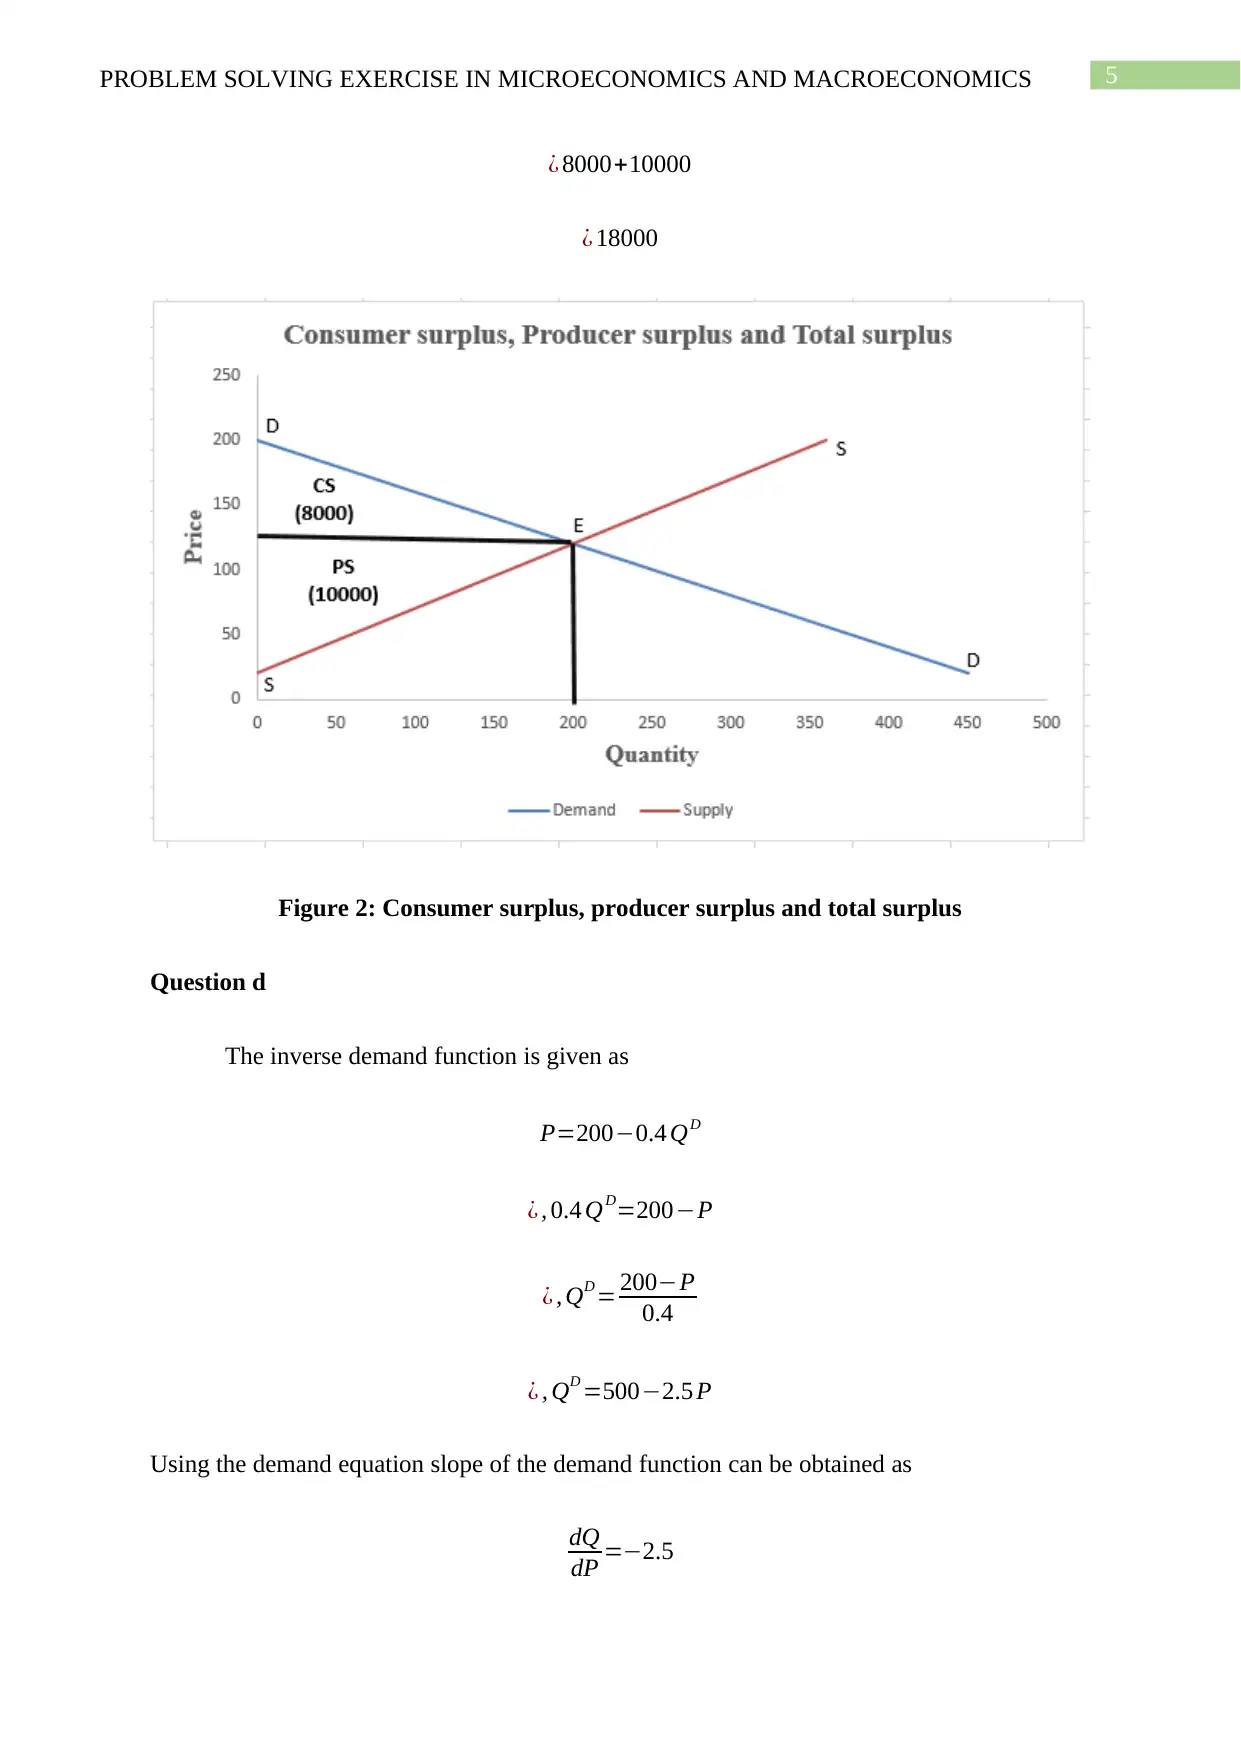
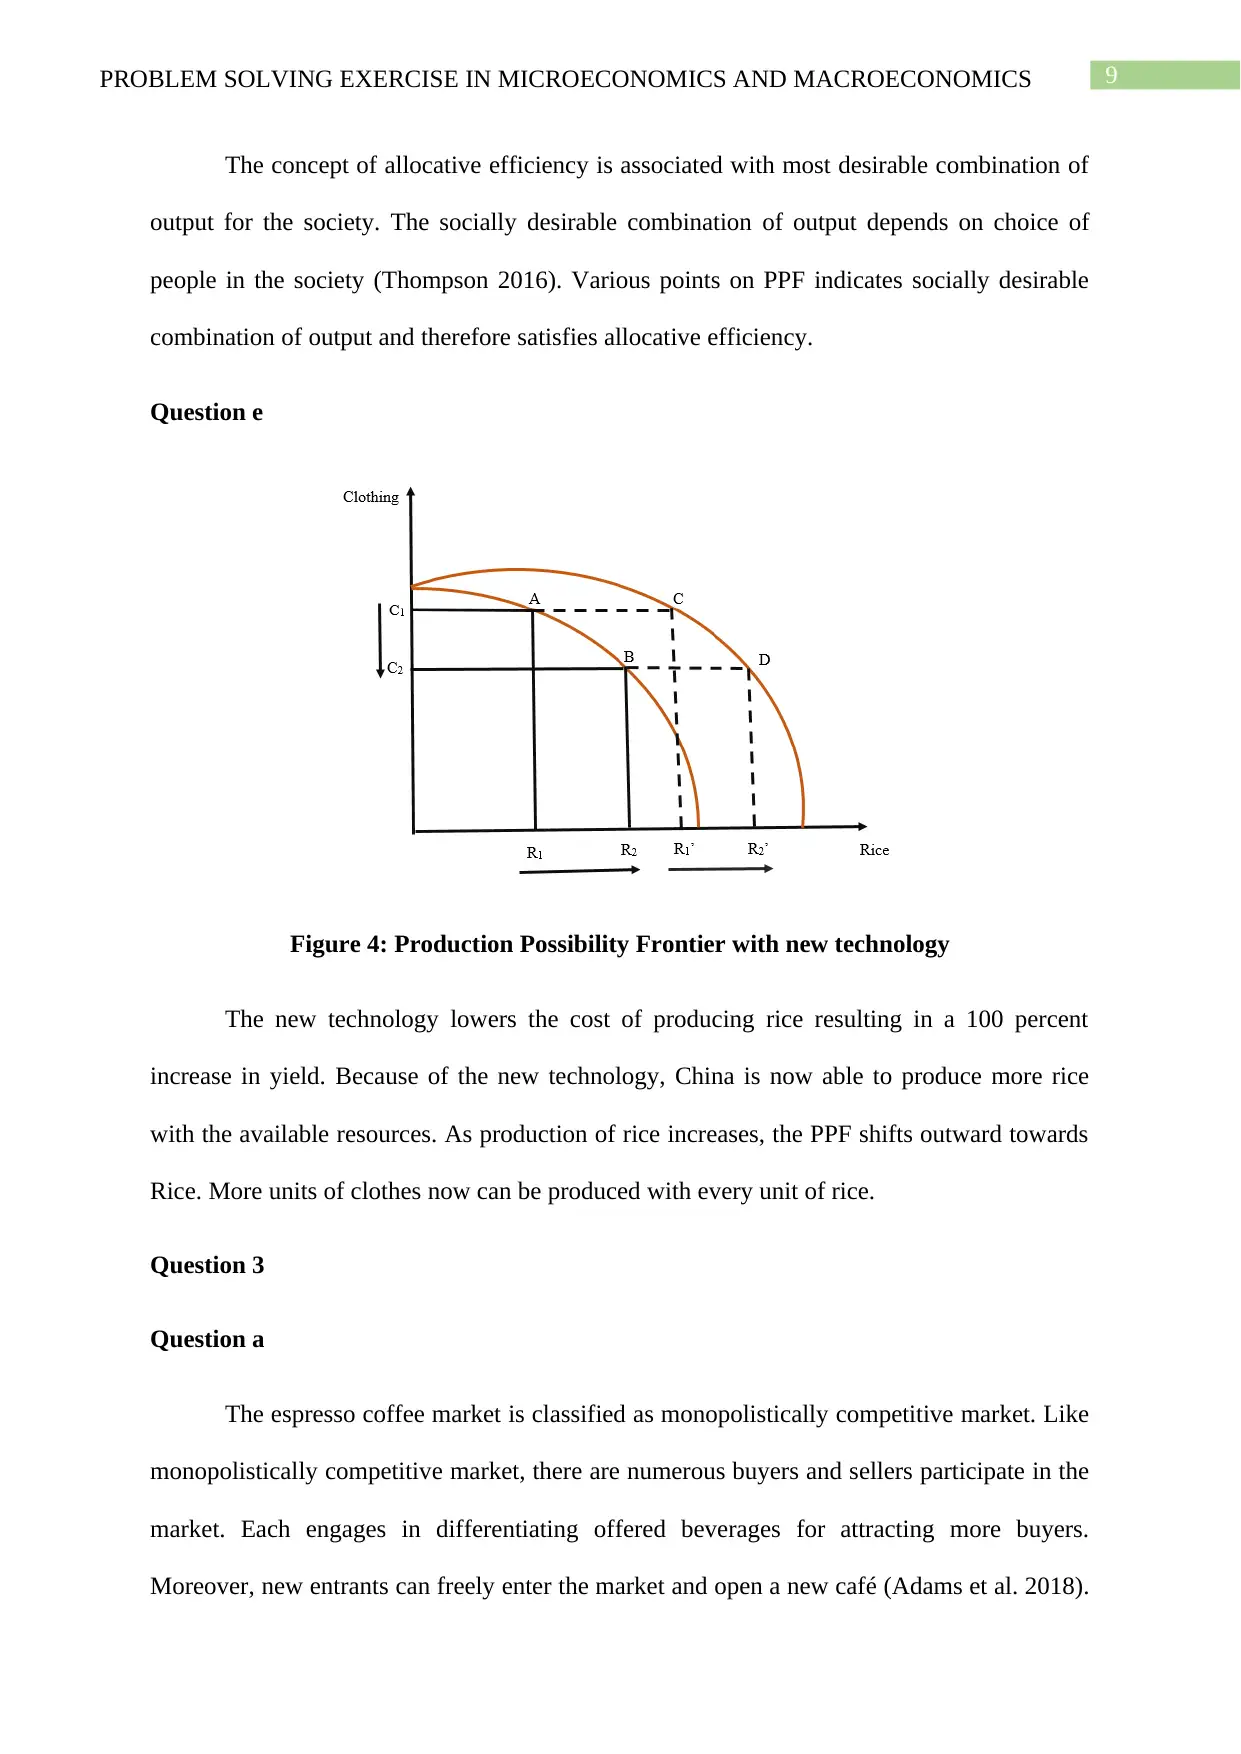
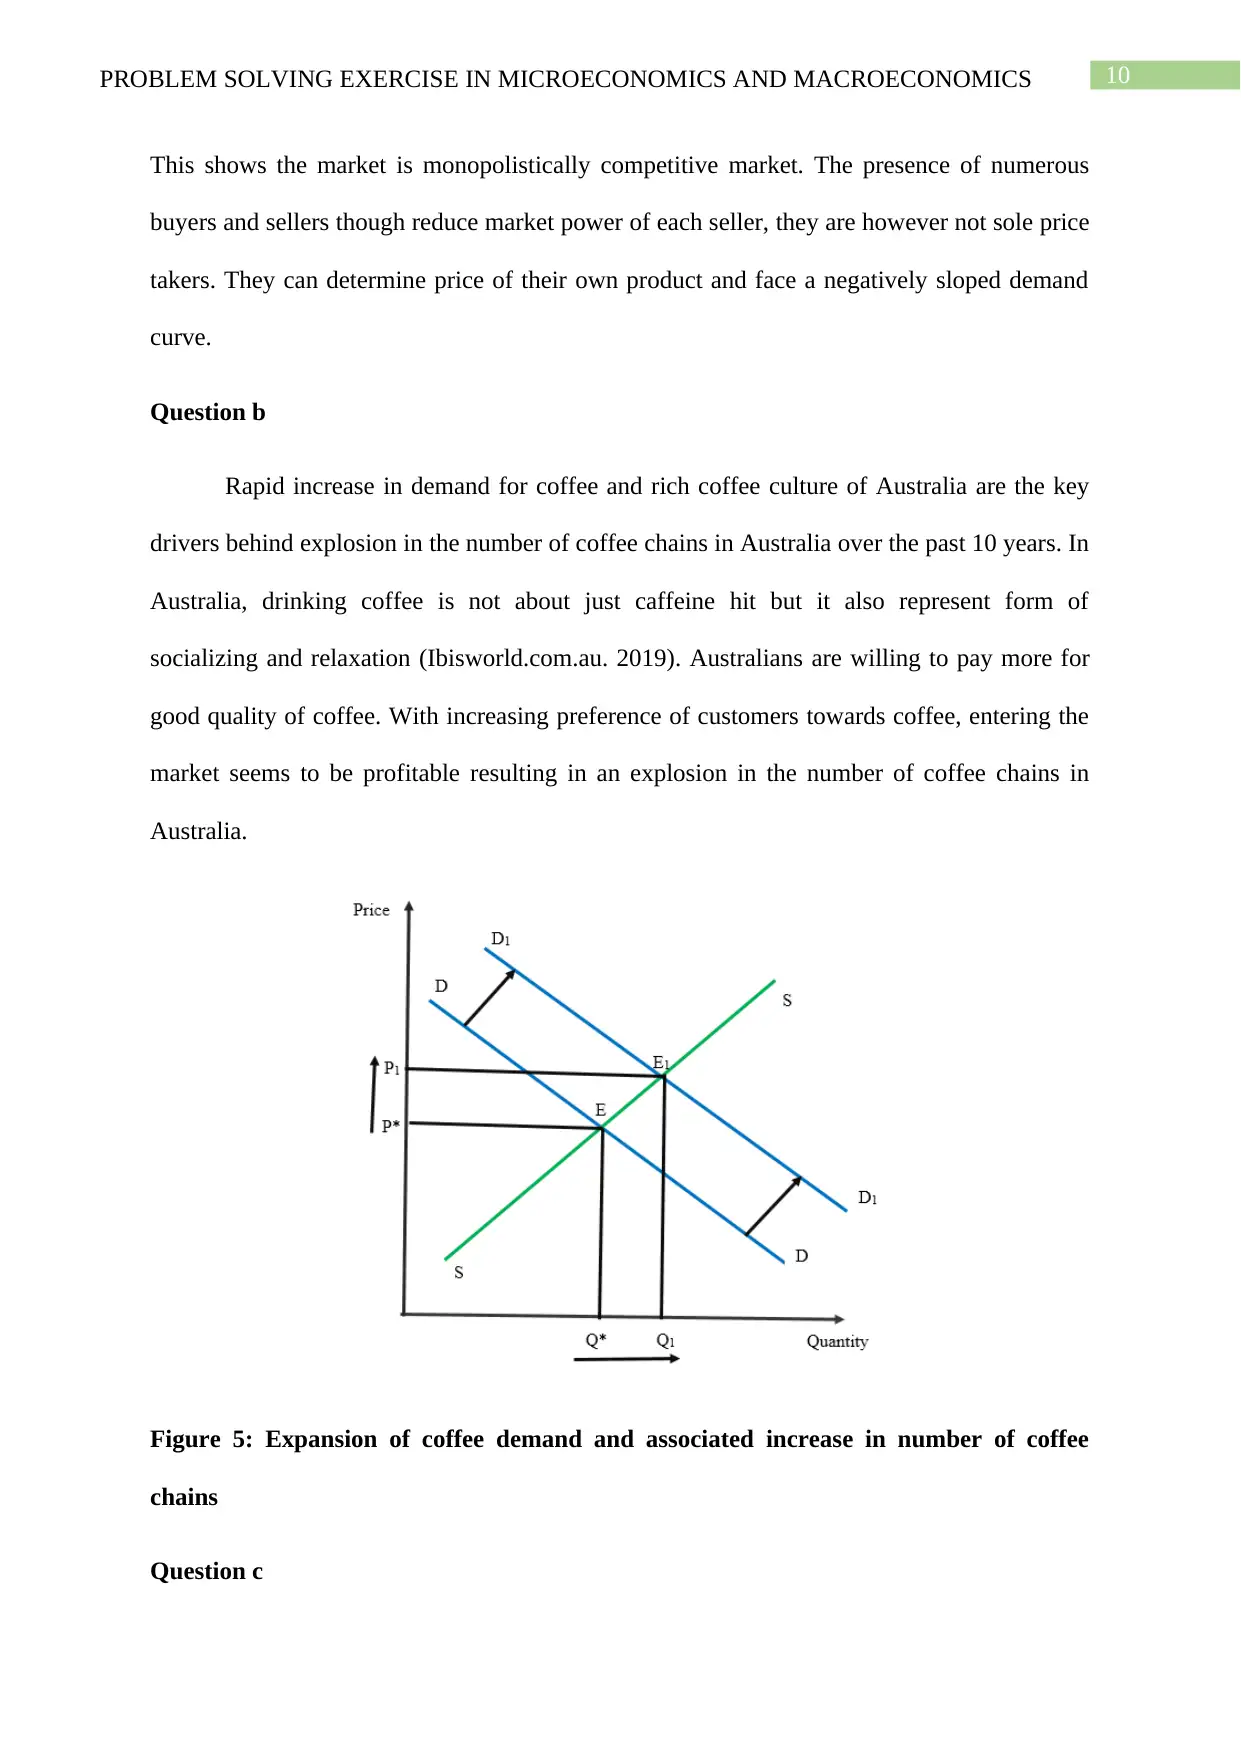
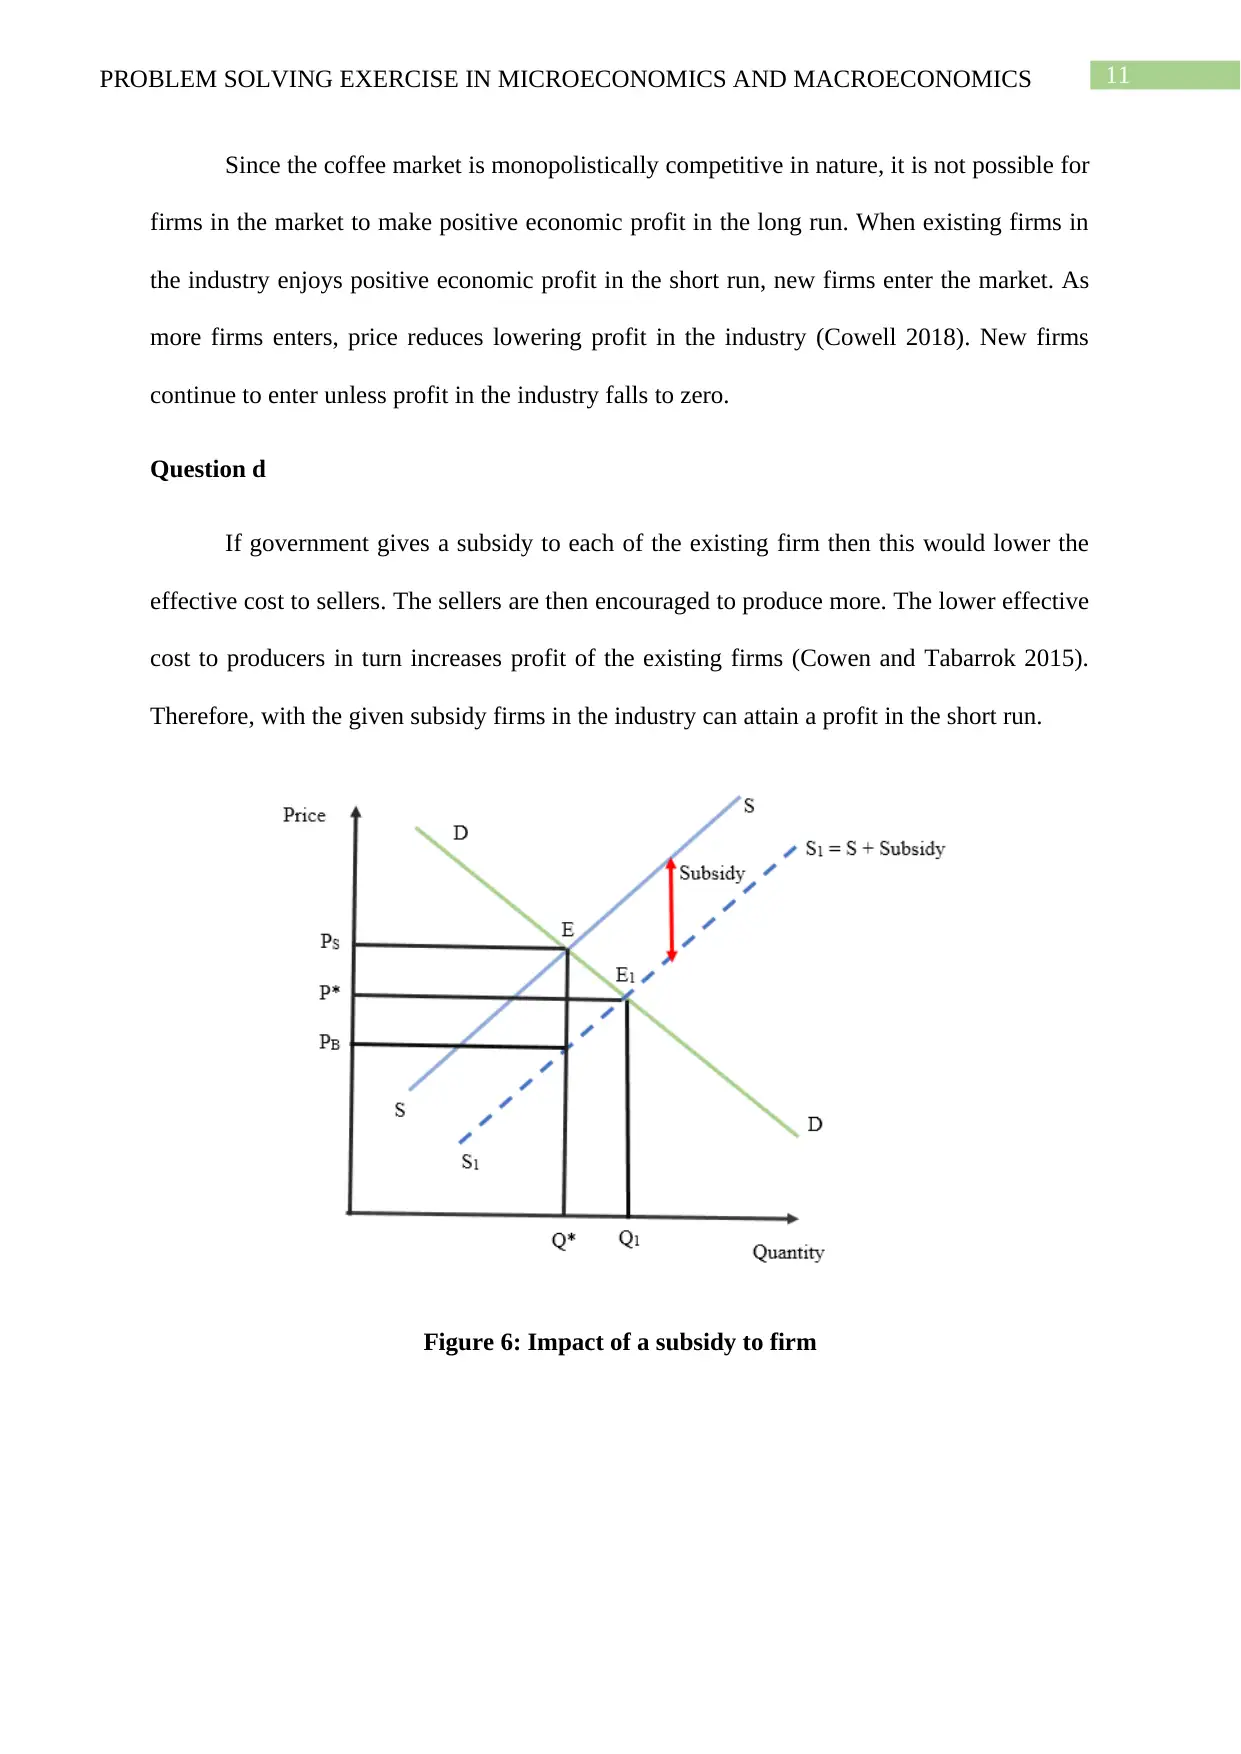
This document presents a comprehensive solution to a problem-solving exercise in microeconomics and macroeconomics. The exercise covers various topics, including supply and demand analysis, elasticity calculations, and market equilibrium. It also explores production possibilities frontiers, opportunity costs, and productive and allocative efficiency. Furthermore, the assignment delves into market structures, specifically monopolistic competition, examining the factors driving market entry and profit maximization. The solution includes graphical representations and detailed explanations to facilitate understanding of the economic concepts. The document also analyzes the impact of technological advancements and government subsidies on market dynamics. The assignment is a valuable resource for students seeking to enhance their understanding of microeconomic and macroeconomic principles. This assignment is available on Desklib, a platform providing students with AI-powered study tools and resources, including past papers and solved assignments.

Running head: PROBLEM SOLVING EXERCISE IN MICROECONOMICS AND
MACROECONOMICS
Problem Solving Exercise in Microeconomics and Macroeconomics
Name of the Student
Name of the University
Course ID
MACROECONOMICS
Problem Solving Exercise in Microeconomics and Macroeconomics
Name of the Student
Name of the University
Course ID
Paraphrase This Document
Need a fresh take? Get an instant paraphrase of this document with our AI Paraphraser

1PROBLEM SOLVING EXERCISE IN MICROECONOMICS AND MACROECONOMICS
Table of Contents
Question 1..................................................................................................................................2
Question a...............................................................................................................................2
Question b..............................................................................................................................3
Question c...............................................................................................................................3
Question d..............................................................................................................................4
Question e...............................................................................................................................5
Question f...............................................................................................................................5
Question 2..................................................................................................................................6
Question a...............................................................................................................................6
Question b..............................................................................................................................7
Question c...............................................................................................................................7
Question d..............................................................................................................................7
Question e...............................................................................................................................8
Question 3..................................................................................................................................8
Question a...............................................................................................................................8
Question b..............................................................................................................................9
Question c...............................................................................................................................9
Question d............................................................................................................................10
References................................................................................................................................11

2PROBLEM SOLVING EXERCISE IN MICROECONOMICS AND MACROECONOMICS
⊘ This is a preview!⊘
Do you want full access?
Subscribe today to unlock all pages.

Trusted by 1+ million students worldwide

3PROBLEM SOLVING EXERCISE IN MICROECONOMICS AND MACROECONOMICS
Question 1
Question a
Given the demand and supply functions for apricots are
P=200−0.4 QD
P=20+ 0.5 QS
Equilibrium occurs where demand and supply equates.
200−0.4 QD=20+ 0.5QS
¿ , 0.4 Q+0.5 Q=200−20 ( At equilibrium , QD=QS=Q )
¿ , 0.9 Q=180
¿ , Q= 180
0.9
¿ , Q=200
Equilibrium price of apricots can be obtained from either using the demand or using the
supply function.
P¿=200− ( 0.4 ×QD )
¿ 200− ( 0.4 ×200 )
¿ 200−80
¿ 120
Paraphrase This Document
Need a fresh take? Get an instant paraphrase of this document with our AI Paraphraser

4PROBLEM SOLVING EXERCISE IN MICROECONOMICS AND MACROECONOMICS
Question b
Figure 1: Supply and demand diagram of apricots
Question c
Consumer Surplus= 1
2 × ( 200−120 ) ×200
¿ 1
2 ×80 × 200
¿ 8000
Producer Surplus= 1
2 × ( 120−20 ) ×200
¿ 1
2 ×100 ×200
¿ 10000
Total Surplus=Consumer Surplus+ Producer Surplus
Question b
Figure 1: Supply and demand diagram of apricots
Question c
Consumer Surplus= 1
2 × ( 200−120 ) ×200
¿ 1
2 ×80 × 200
¿ 8000
Producer Surplus= 1
2 × ( 120−20 ) ×200
¿ 1
2 ×100 ×200
¿ 10000
Total Surplus=Consumer Surplus+ Producer Surplus

5PROBLEM SOLVING EXERCISE IN MICROECONOMICS AND MACROECONOMICS
¿ 8000+10000
¿ 18000
Figure 2: Consumer surplus, producer surplus and total surplus
Question d
The inverse demand function is given as
P=200−0.4 QD
¿ , 0.4 QD=200−P
¿ , QD = 200−P
0.4
¿ , QD =500−2.5 P
Using the demand equation slope of the demand function can be obtained as
dQ
dP =−2.5
¿ 8000+10000
¿ 18000
Figure 2: Consumer surplus, producer surplus and total surplus
Question d
The inverse demand function is given as
P=200−0.4 QD
¿ , 0.4 QD=200−P
¿ , QD = 200−P
0.4
¿ , QD =500−2.5 P
Using the demand equation slope of the demand function can be obtained as
dQ
dP =−2.5
⊘ This is a preview!⊘
Do you want full access?
Subscribe today to unlock all pages.

Trusted by 1+ million students worldwide

6PROBLEM SOLVING EXERCISE IN MICROECONOMICS AND MACROECONOMICS
Price elasticity of demand= Percentage change∈quantity demand
Percentage change ∈ price
¿ dQ
dP × P
Q
¿−2.5 × 120
200
¿−1.5
Question e
The estimated price elasticity of demand for apricots is -1.5. The price elasticity
estimate suggests that if price of apricots increases by 10 percent, demand for apricots would
decrease by (1.5*10) = 15 percent.
Question f
After 10 percent increase in price of apricots, equilibrium price of apricots become
P1=120+ ( 120 × 10
100 )
¿ 120+12
¿ 132
With 15 percent decrease in demand, new demand for apricots will be
Q1=200−(200× 15
100 )
¿ 200−30
¿ 170
Paraphrase This Document
Need a fresh take? Get an instant paraphrase of this document with our AI Paraphraser

7PROBLEM SOLVING EXERCISE IN MICROECONOMICS AND MACROECONOMICS
Total Revenue (TR)=P1 × Q1
¿ 132× 170
¿ 23364
Before the price increase, total revenue to the suppliers was
Total Revenue ( TR )=P¿ ×Q¿
¿ 120 ×200
¿ 24000
The measured price elasticity of demand for apricots is -1.5. The elasticity measure is
greater than 1 meaning demand is relatively elastic in nature. In case of relatively elastic
demand, an increase in price reduces revenue as sales decreases by a greater proportion
compared to price increase (Cowell 2018). As shown from the above result given the 10%
increase in price of apricots demand decreases by 15% causing revenue to decrease from
$24000 to $23364.
Question 2
Question a
Figure 3: Production Possibilities curve for China

8PROBLEM SOLVING EXERCISE IN MICROECONOMICS AND MACROECONOMICS
Question b
The production possibilities frontier is concave in shape because of law of increasing
opportunity cost. Given the fixed amount of resources available for production, increasing
production of one good requires decreasing production of other. The forgone unit of one good
for unit increase in other good represents opportunity cost of production. The opportunity
cost increases with more and more production of one good at the cost of other. This is
because resources are not perfect substitutes (Baumol and Blinder 2015). Hence, as more and
more resources shift from one industry to other efficiency decreases causing opportunity to
increase for every unit increase in production. This makes production possibility frontier
concave to origin.
Question c
There are four key assumption underlying the construction of PPF. These are as
follows
The available resources are used for making only two goods
The quantity of available resources is fixed
The technique of production and available technology is fixed (Cowen and Tabarrok
2015)
The economy uses resources in the most technically efficient way
Question d
An economy is said to achieve productive efficiency when it is impossible for the
society to produce a higher quantity of one good with lowering quantity of other goods. Any
point on the PPF shows such efficient production combination and thus is productively
efficient.
⊘ This is a preview!⊘
Do you want full access?
Subscribe today to unlock all pages.

Trusted by 1+ million students worldwide

9PROBLEM SOLVING EXERCISE IN MICROECONOMICS AND MACROECONOMICS
The concept of allocative efficiency is associated with most desirable combination of
output for the society. The socially desirable combination of output depends on choice of
people in the society (Thompson 2016). Various points on PPF indicates socially desirable
combination of output and therefore satisfies allocative efficiency.
Question e
Figure 4: Production Possibility Frontier with new technology
The new technology lowers the cost of producing rice resulting in a 100 percent
increase in yield. Because of the new technology, China is now able to produce more rice
with the available resources. As production of rice increases, the PPF shifts outward towards
Rice. More units of clothes now can be produced with every unit of rice.
Question 3
Question a
The espresso coffee market is classified as monopolistically competitive market. Like
monopolistically competitive market, there are numerous buyers and sellers participate in the
market. Each engages in differentiating offered beverages for attracting more buyers.
Moreover, new entrants can freely enter the market and open a new café (Adams et al. 2018).
Paraphrase This Document
Need a fresh take? Get an instant paraphrase of this document with our AI Paraphraser

10PROBLEM SOLVING EXERCISE IN MICROECONOMICS AND MACROECONOMICS
This shows the market is monopolistically competitive market. The presence of numerous
buyers and sellers though reduce market power of each seller, they are however not sole price
takers. They can determine price of their own product and face a negatively sloped demand
curve.
Question b
Rapid increase in demand for coffee and rich coffee culture of Australia are the key
drivers behind explosion in the number of coffee chains in Australia over the past 10 years. In
Australia, drinking coffee is not about just caffeine hit but it also represent form of
socializing and relaxation (Ibisworld.com.au. 2019). Australians are willing to pay more for
good quality of coffee. With increasing preference of customers towards coffee, entering the
market seems to be profitable resulting in an explosion in the number of coffee chains in
Australia.
Figure 5: Expansion of coffee demand and associated increase in number of coffee
chains
Question c

11PROBLEM SOLVING EXERCISE IN MICROECONOMICS AND MACROECONOMICS
Since the coffee market is monopolistically competitive in nature, it is not possible for
firms in the market to make positive economic profit in the long run. When existing firms in
the industry enjoys positive economic profit in the short run, new firms enter the market. As
more firms enters, price reduces lowering profit in the industry (Cowell 2018). New firms
continue to enter unless profit in the industry falls to zero.
Question d
If government gives a subsidy to each of the existing firm then this would lower the
effective cost to sellers. The sellers are then encouraged to produce more. The lower effective
cost to producers in turn increases profit of the existing firms (Cowen and Tabarrok 2015).
Therefore, with the given subsidy firms in the industry can attain a profit in the short run.
Figure 6: Impact of a subsidy to firm
⊘ This is a preview!⊘
Do you want full access?
Subscribe today to unlock all pages.

Trusted by 1+ million students worldwide
1 out of 13
Related Documents

Your All-in-One AI-Powered Toolkit for Academic Success.
+13062052269
info@desklib.com
Available 24*7 on WhatsApp / Email
Unlock your academic potential
Copyright © 2020–2025 A2Z Services. All Rights Reserved. Developed and managed by ZUCOL.