Microeconomics Assignment: Market Structures, Efficiency, and Policy

Verified

Added on  2023/02/01

|7
|1104
|40
Homework Assignment
AI Summary
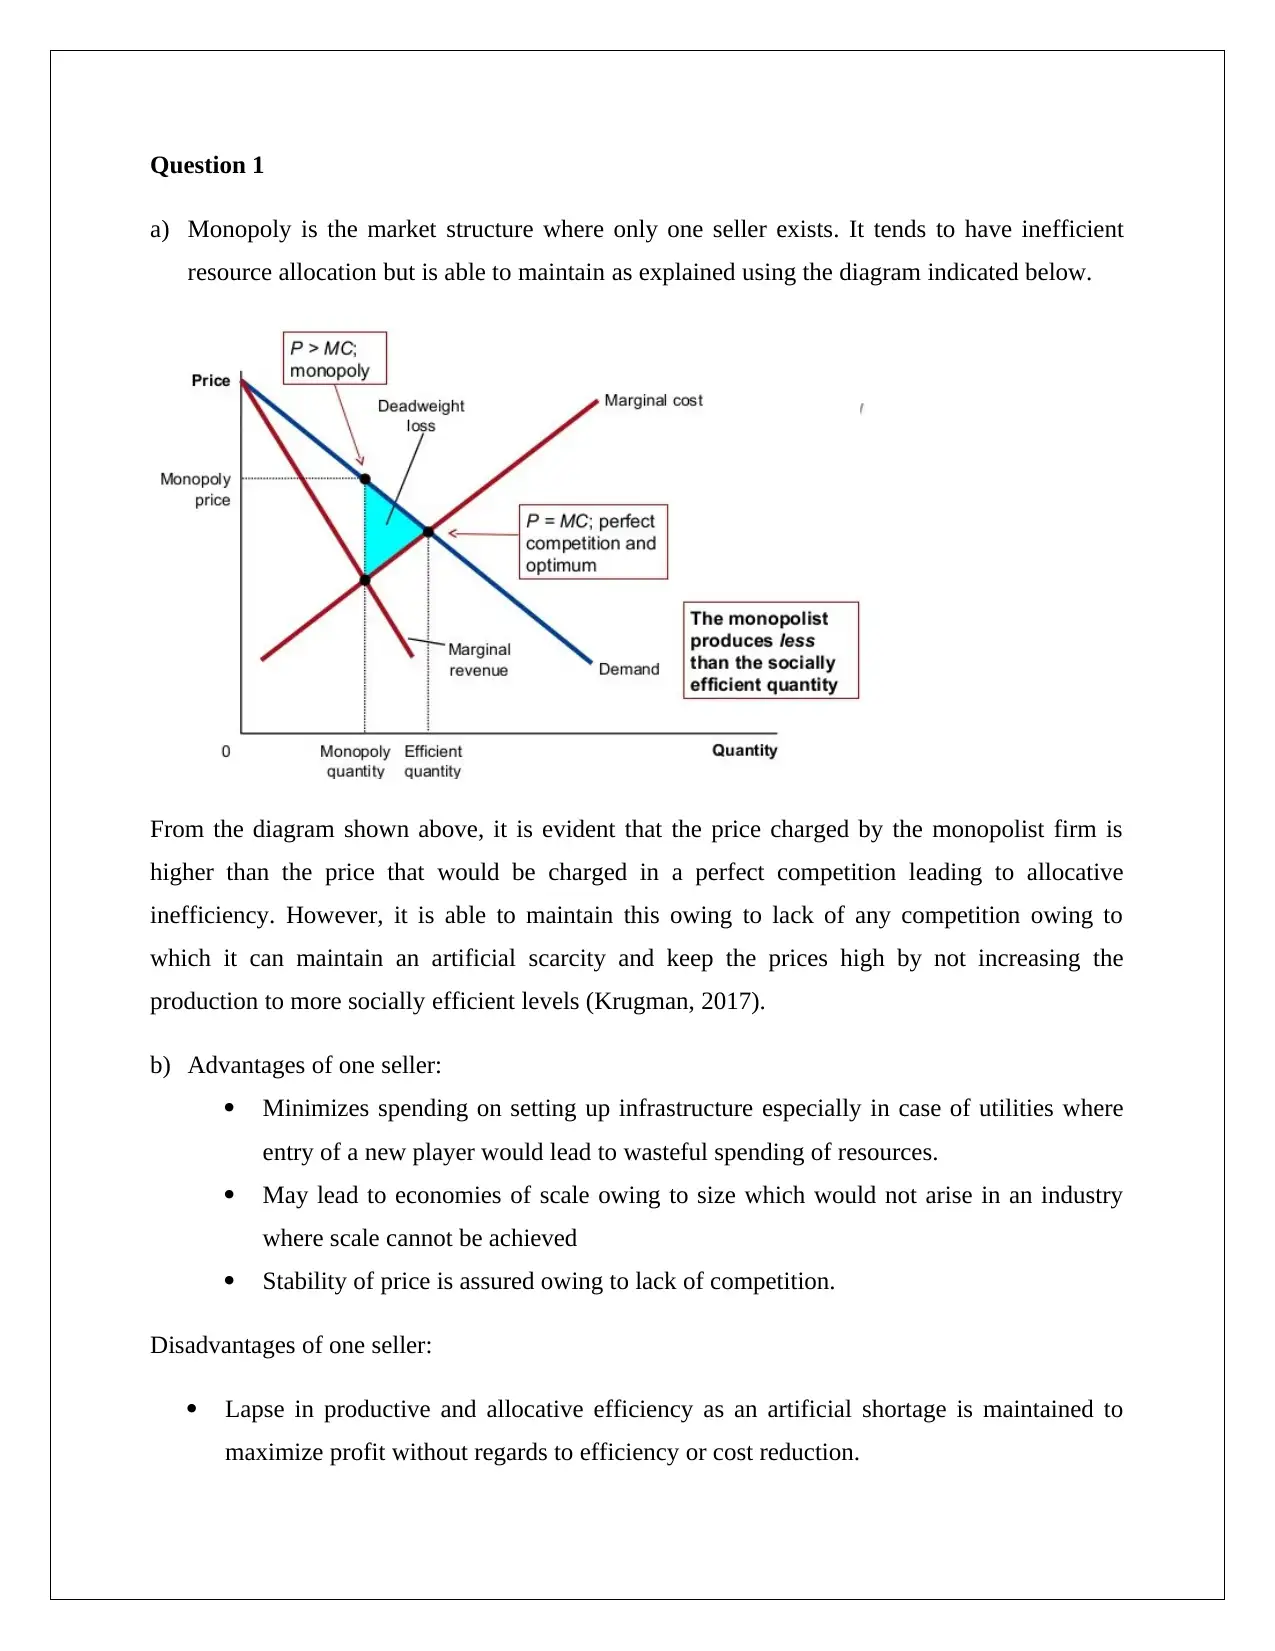
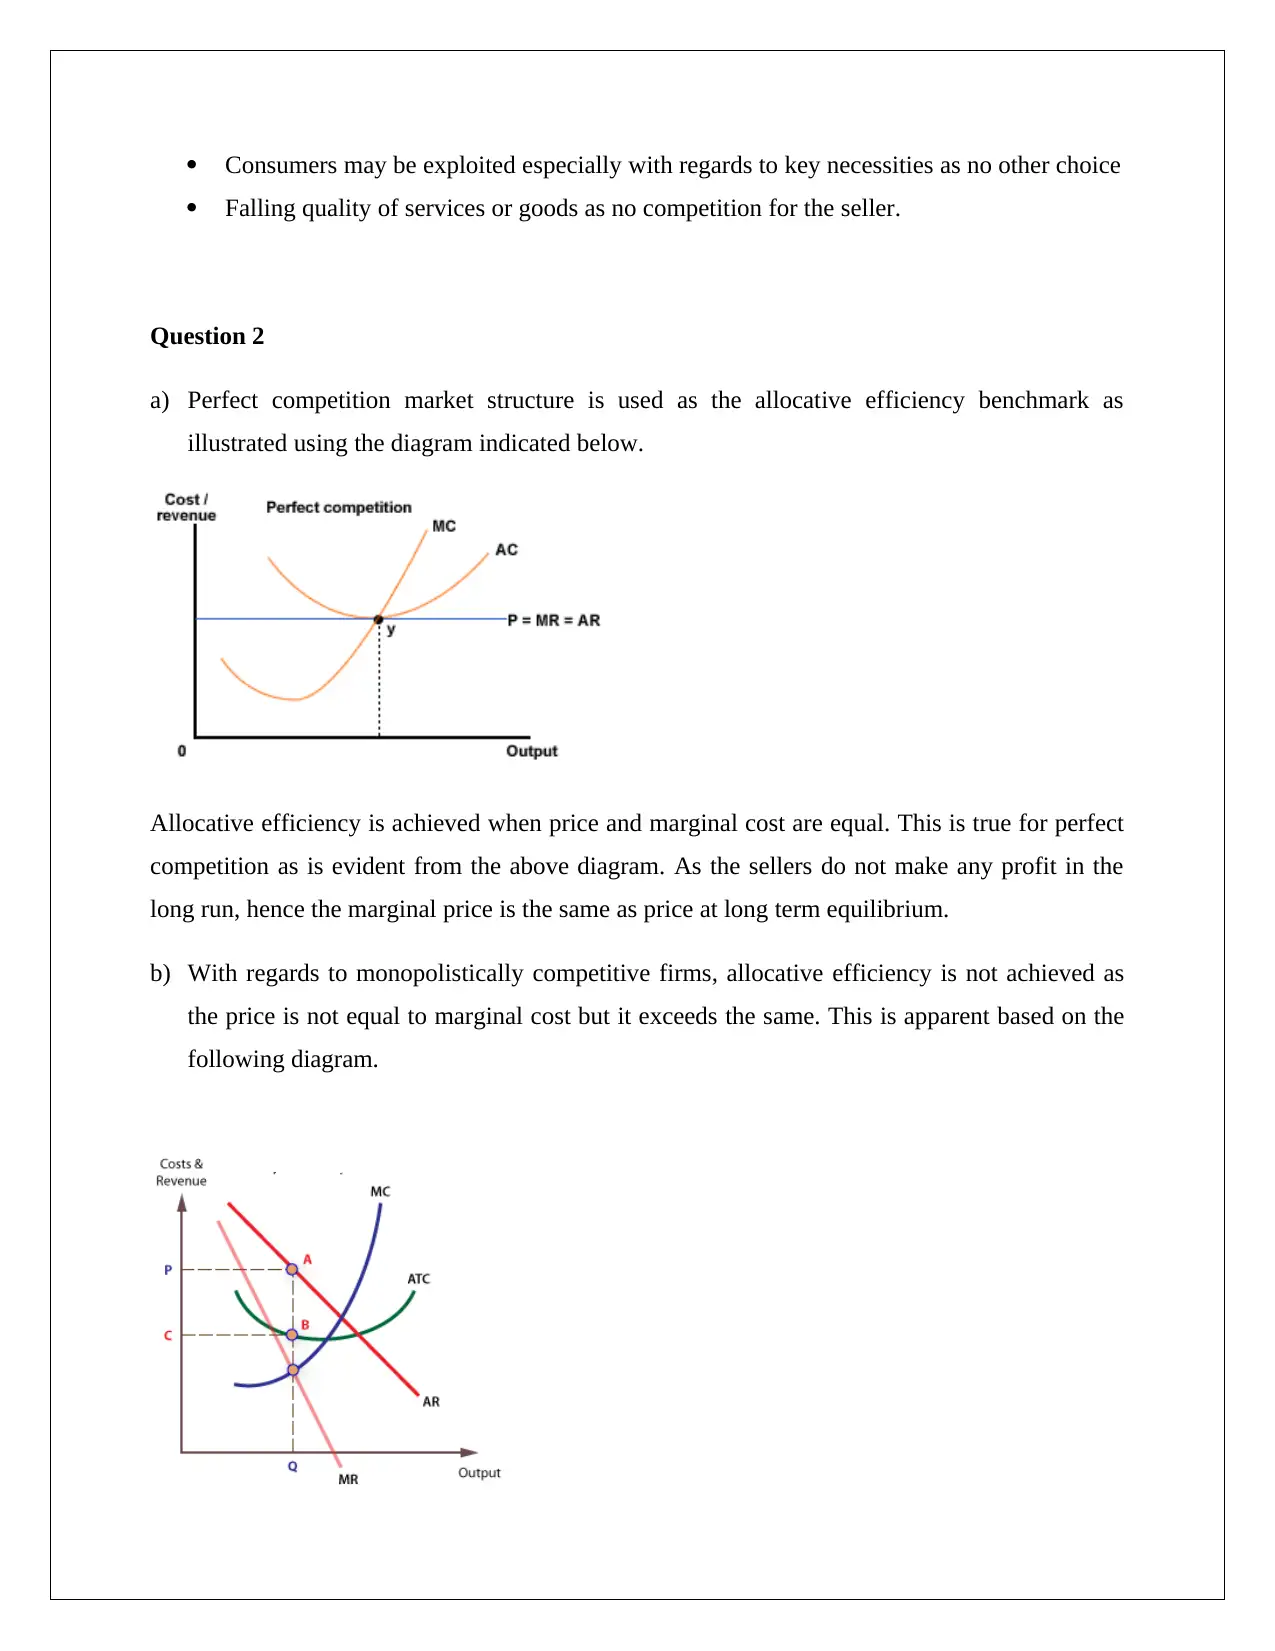
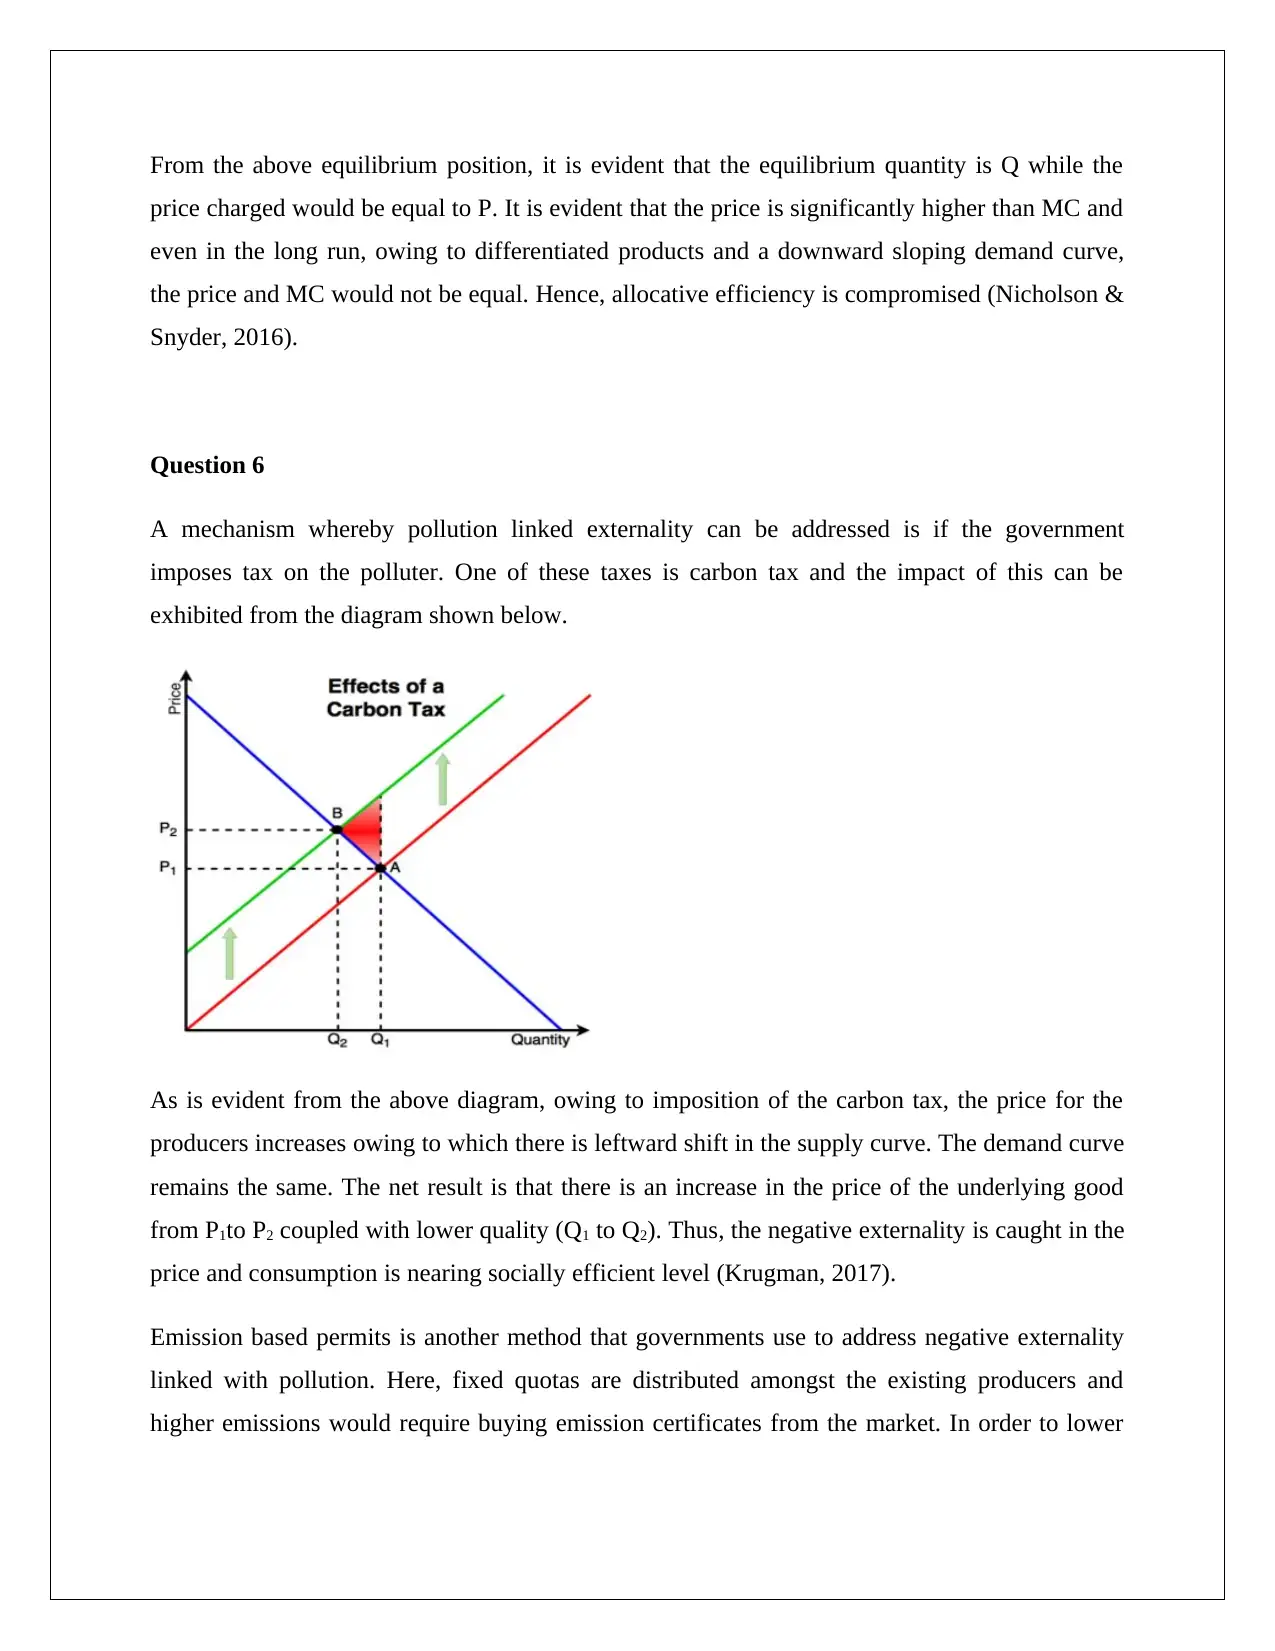
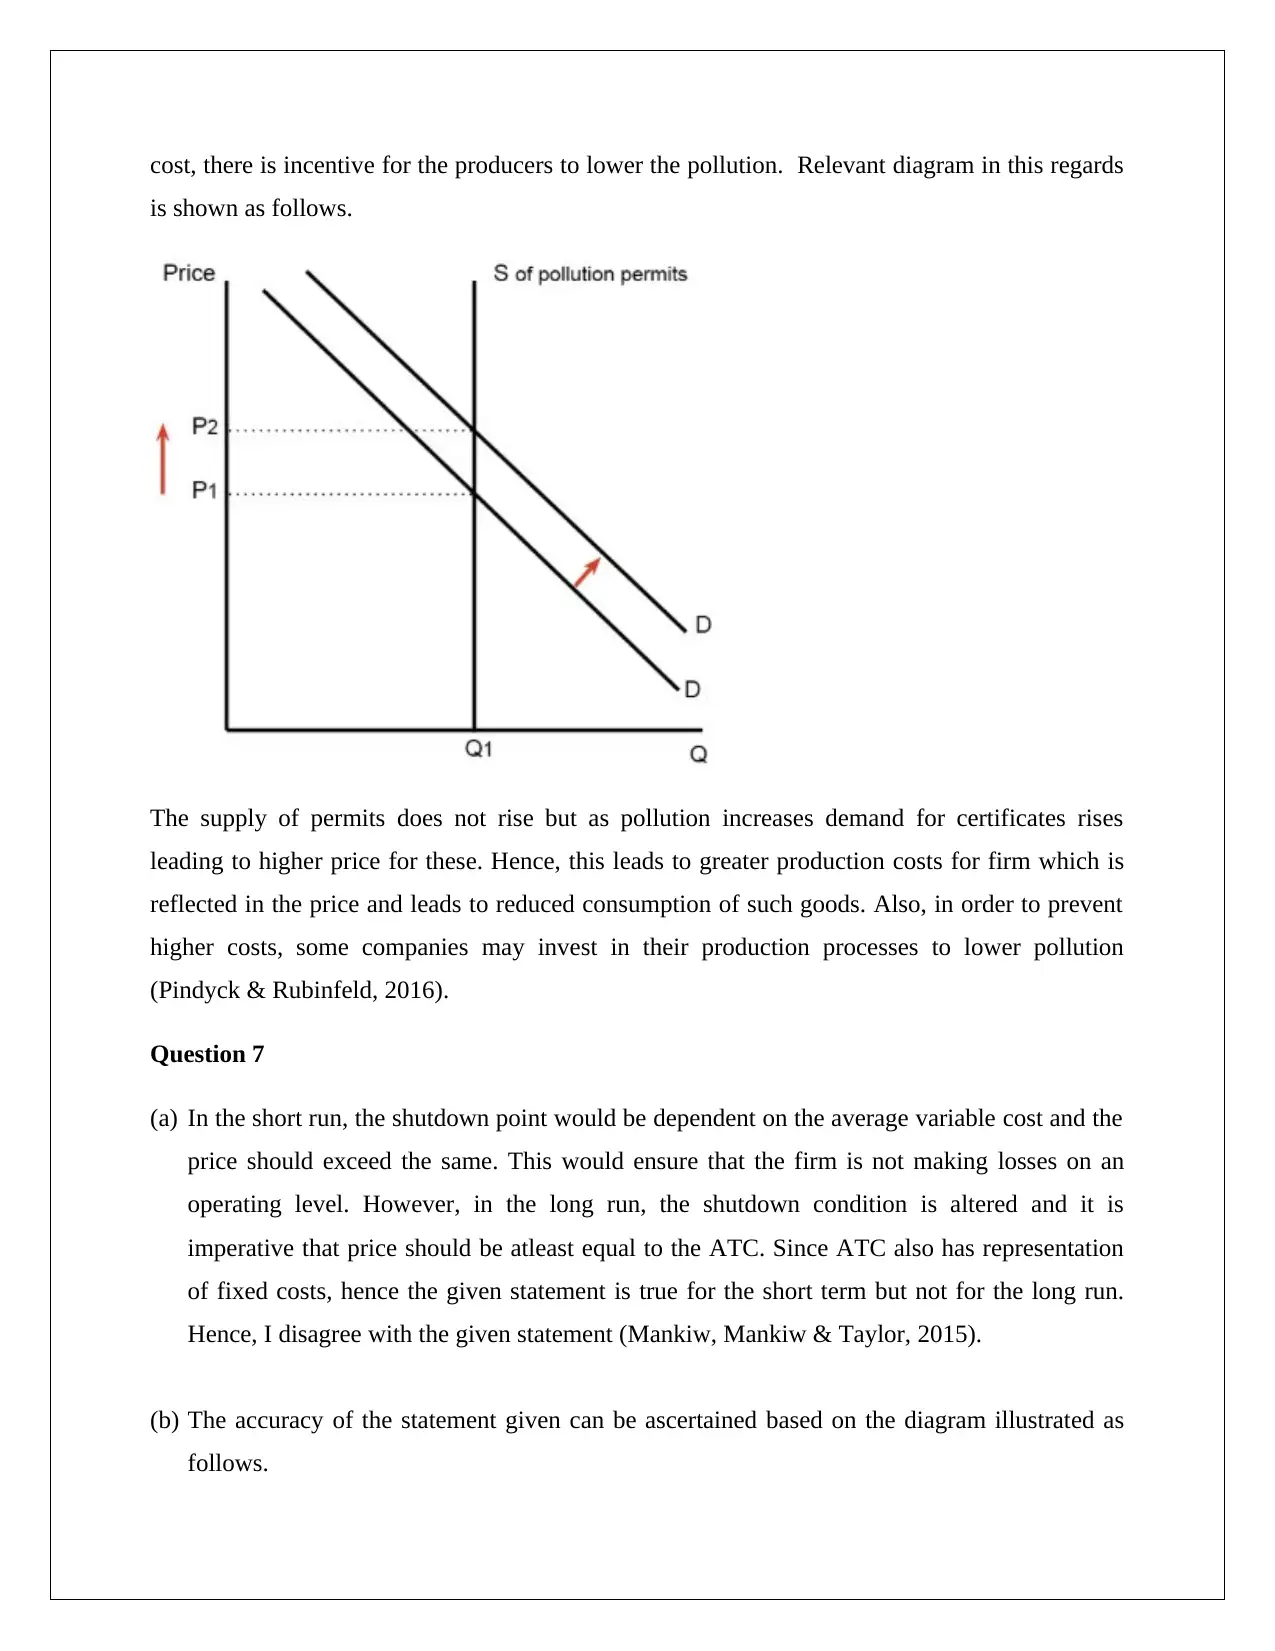
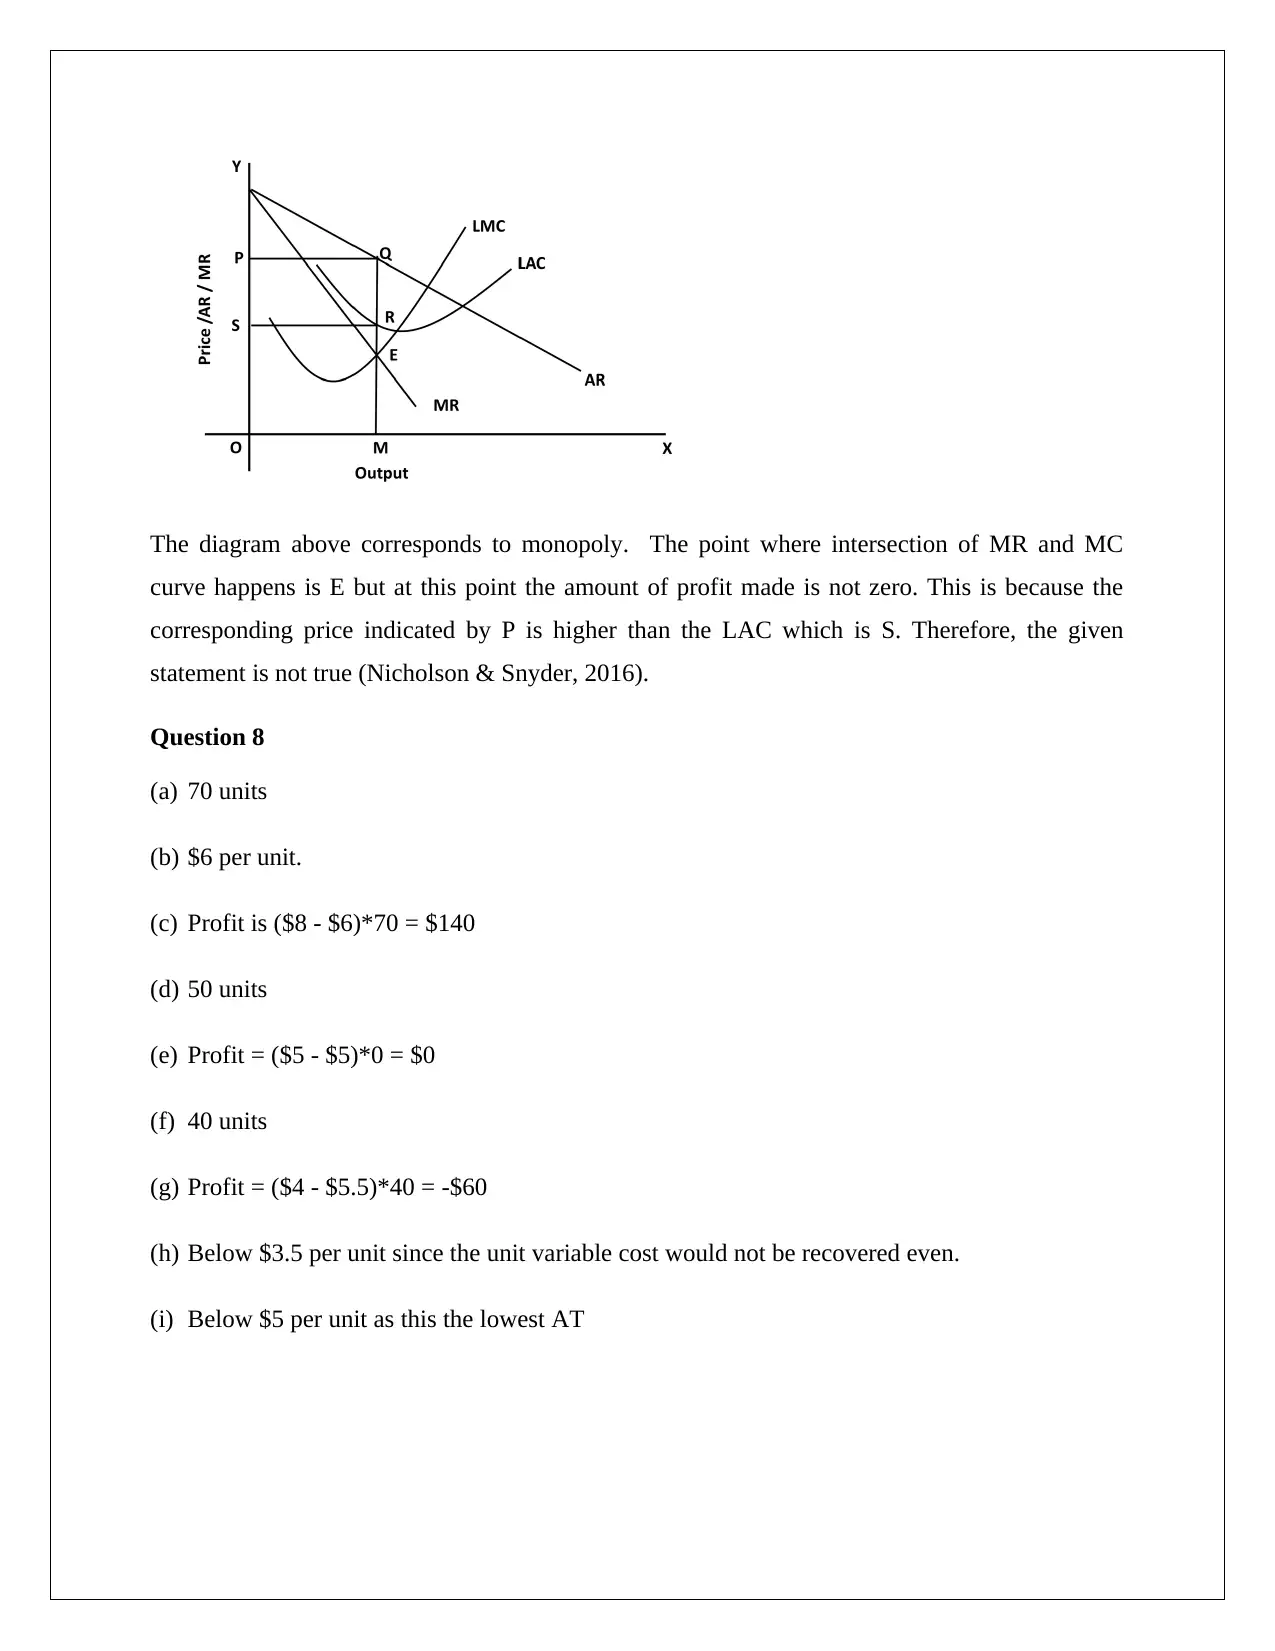
This microeconomics assignment analyzes various market structures, including monopoly and perfect competition, evaluating their allocative efficiency and impact on resource allocation. The assignment explores the advantages and disadvantages of monopolies, comparing them to perfect competition, and illustrates these concepts with diagrams. It also examines how government policies, such as carbon taxes and emission-based permits, can address negative externalities associated with pollution. The analysis further delves into short-run and long-run shutdown points for firms, discussing the conditions under which firms choose to operate or cease production. The assignment concludes with numerical problems to assess the understanding of profit maximization and cost structures in different market scenarios, providing a comprehensive overview of microeconomic principles and their practical applications.
tabler-icon-diamond-filled.svg

Contribute Materials

Your contribution can guide someone’s learning journey. Share your documents today.
Document Page
MICROECONOMICS
STUDENT ID:
[Pick the date]
tabler-icon-diamond-filled.svg

Secure Best Marks with AI Grader

Need help grading? Try our AI Grader for instant feedback on your assignments.
Document Page
Question 1
a) Monopoly is the market structure where only one seller exists. It tends to have inefficient
resource allocation but is able to maintain as explained using the diagram indicated below.
From the diagram shown above, it is evident that the price charged by the monopolist firm is
higher than the price that would be charged in a perfect competition leading to allocative
inefficiency. However, it is able to maintain this owing to lack of any competition owing to
which it can maintain an artificial scarcity and keep the prices high by not increasing the
production to more socially efficient levels (Krugman, 2017).
b) Advantages of one seller:
Minimizes spending on setting up infrastructure especially in case of utilities where
entry of a new player would lead to wasteful spending of resources.
May lead to economies of scale owing to size which would not arise in an industry
where scale cannot be achieved
Stability of price is assured owing to lack of competition.
Disadvantages of one seller:
Lapse in productive and allocative efficiency as an artificial shortage is maintained to
maximize profit without regards to efficiency or cost reduction.
Document Page
Consumers may be exploited especially with regards to key necessities as no other choice
Falling quality of services or goods as no competition for the seller.
Question 2
a) Perfect competition market structure is used as the allocative efficiency benchmark as
illustrated using the diagram indicated below.
Allocative efficiency is achieved when price and marginal cost are equal. This is true for perfect
competition as is evident from the above diagram. As the sellers do not make any profit in the
long run, hence the marginal price is the same as price at long term equilibrium.
b) With regards to monopolistically competitive firms, allocative efficiency is not achieved as
the price is not equal to marginal cost but it exceeds the same. This is apparent based on the
following diagram.
Document Page
From the above equilibrium position, it is evident that the equilibrium quantity is Q while the
price charged would be equal to P. It is evident that the price is significantly higher than MC and
even in the long run, owing to differentiated products and a downward sloping demand curve,
the price and MC would not be equal. Hence, allocative efficiency is compromised (Nicholson &
Snyder, 2016).
Question 6
A mechanism whereby pollution linked externality can be addressed is if the government
imposes tax on the polluter. One of these taxes is carbon tax and the impact of this can be
exhibited from the diagram shown below.
As is evident from the above diagram, owing to imposition of the carbon tax, the price for the
producers increases owing to which there is leftward shift in the supply curve. The demand curve
remains the same. The net result is that there is an increase in the price of the underlying good
from P1to P2 coupled with lower quality (Q1 to Q2). Thus, the negative externality is caught in the
price and consumption is nearing socially efficient level (Krugman, 2017).
Emission based permits is another method that governments use to address negative externality
linked with pollution. Here, fixed quotas are distributed amongst the existing producers and
higher emissions would require buying emission certificates from the market. In order to lower
tabler-icon-diamond-filled.svg

Secure Best Marks with AI Grader

Need help grading? Try our AI Grader for instant feedback on your assignments.
Document Page
cost, there is incentive for the producers to lower the pollution. Relevant diagram in this regards
is shown as follows.
The supply of permits does not rise but as pollution increases demand for certificates rises
leading to higher price for these. Hence, this leads to greater production costs for firm which is
reflected in the price and leads to reduced consumption of such goods. Also, in order to prevent
higher costs, some companies may invest in their production processes to lower pollution
(Pindyck & Rubinfeld, 2016).
Question 7
(a) In the short run, the shutdown point would be dependent on the average variable cost and the
price should exceed the same. This would ensure that the firm is not making losses on an
operating level. However, in the long run, the shutdown condition is altered and it is
imperative that price should be atleast equal to the ATC. Since ATC also has representation
of fixed costs, hence the given statement is true for the short term but not for the long run.
Hence, I disagree with the given statement (Mankiw, Mankiw & Taylor, 2015).
(b) The accuracy of the statement given can be ascertained based on the diagram illustrated as
follows.
Document Page
The diagram above corresponds to monopoly. The point where intersection of MR and MC
curve happens is E but at this point the amount of profit made is not zero. This is because the
corresponding price indicated by P is higher than the LAC which is S. Therefore, the given
statement is not true (Nicholson & Snyder, 2016).
Question 8
(a) 70 units
(b) $6 per unit.
(c) Profit is ($8 - $6)*70 = $140
(d) 50 units
(e) Profit = ($5 - $5)*0 = $0
(f) 40 units
(g) Profit = ($4 - $5.5)*40 = -$60
(h) Below $3.5 per unit since the unit variable cost would not be recovered even.
(i) Below $5 per unit as this the lowest AT
Document Page
References
Krugman, P. (2017) Microeconomics. 2nd edn. London: Worth Publishers,
Mankiw, G.N., Mankiw, G.N. & Taylor, P. (2015) Microeconomics. 5th edn. Sydney: Cengage
Learning,
Nicholson, W. & Snyder, C. (2016) Fundamentals of Microeconomics.11th edn. New York:
Cengage Learning,
Pindyck, R. & Rubinfeld, D. (2016) Microeconomics.5th edn. London: Prentice-Hall
Publications,
chevron_up_icon
1 out of 7
circle_padding
hide_on_mobile
zoom_out_icon
logo.png

Your All-in-One AI-Powered Toolkit for Academic Success.

Available 24*7 on WhatsApp / Email

[object Object]