Microeconomics Assignment: Supply, Demand and Tech Impact
VerifiedAdded on 2022/09/06
|13
|945
|15
Homework Assignment
AI Summary
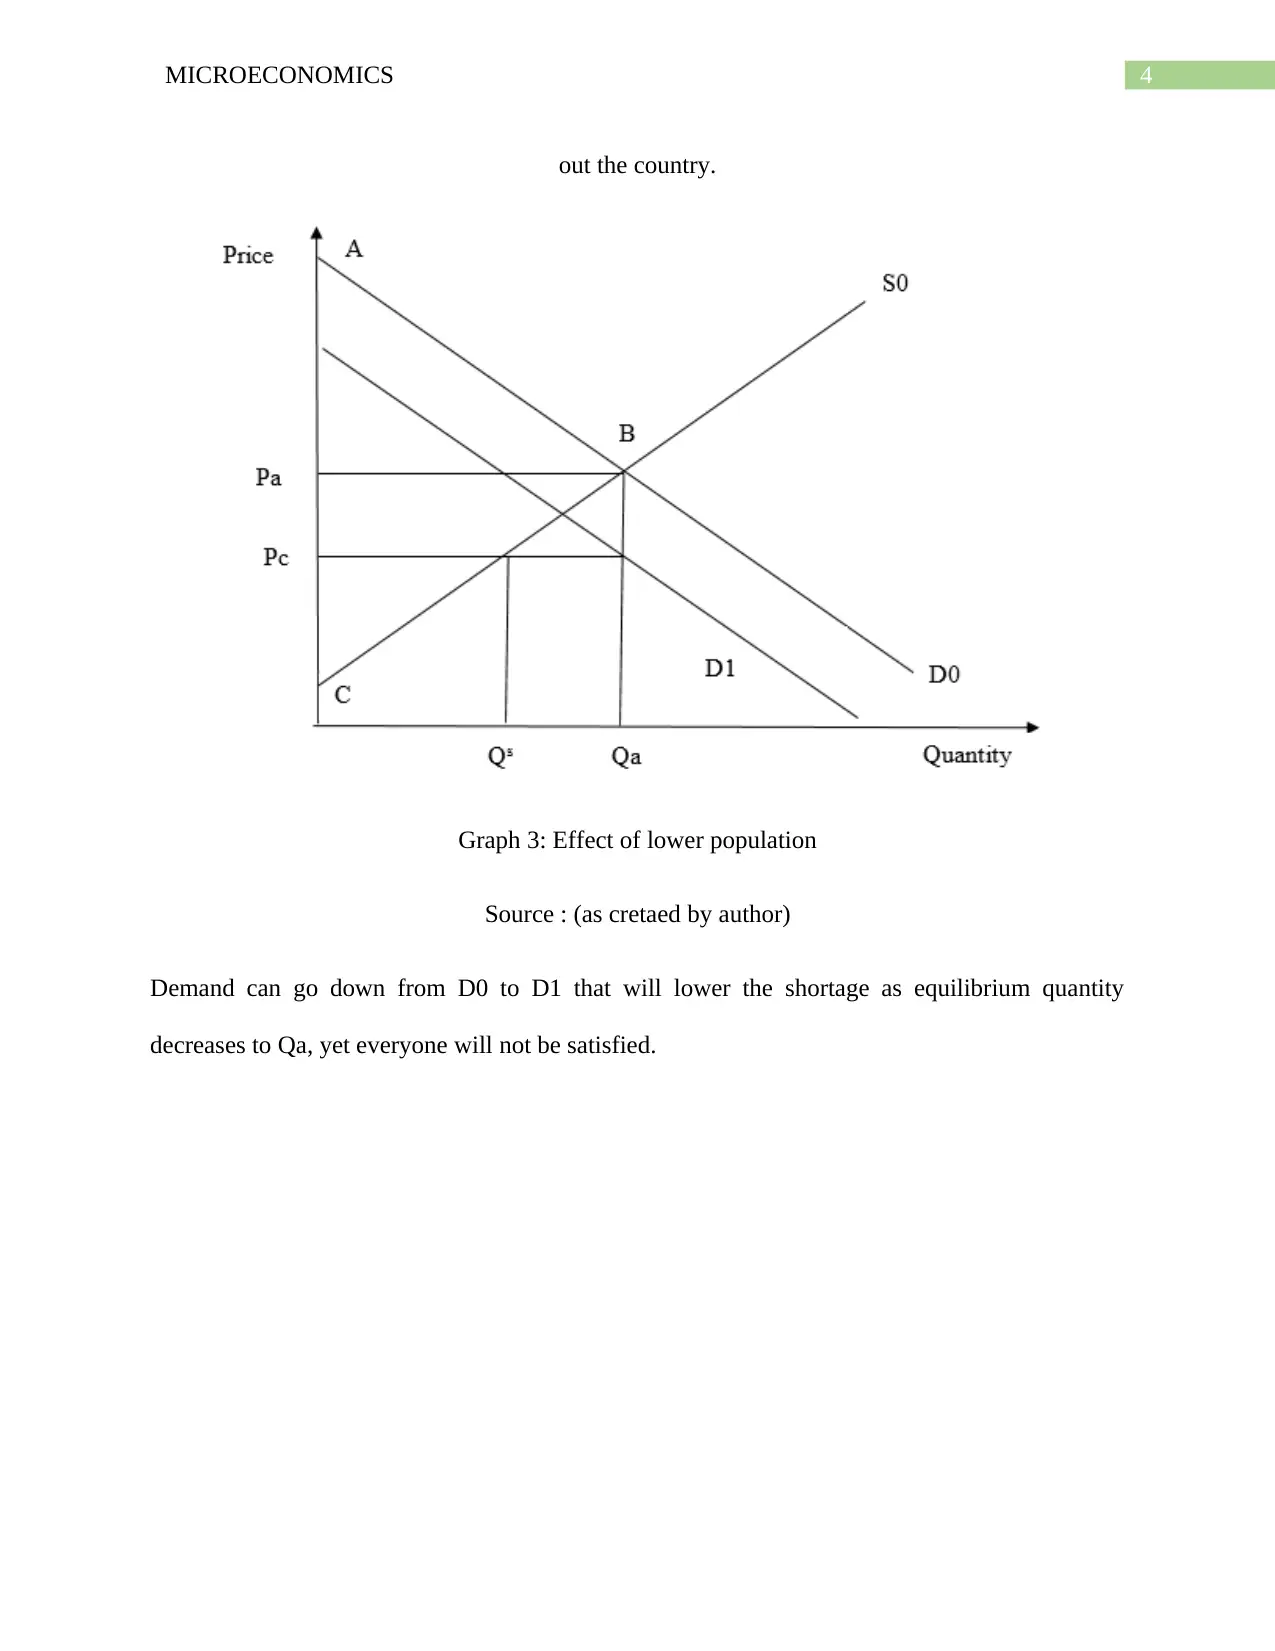
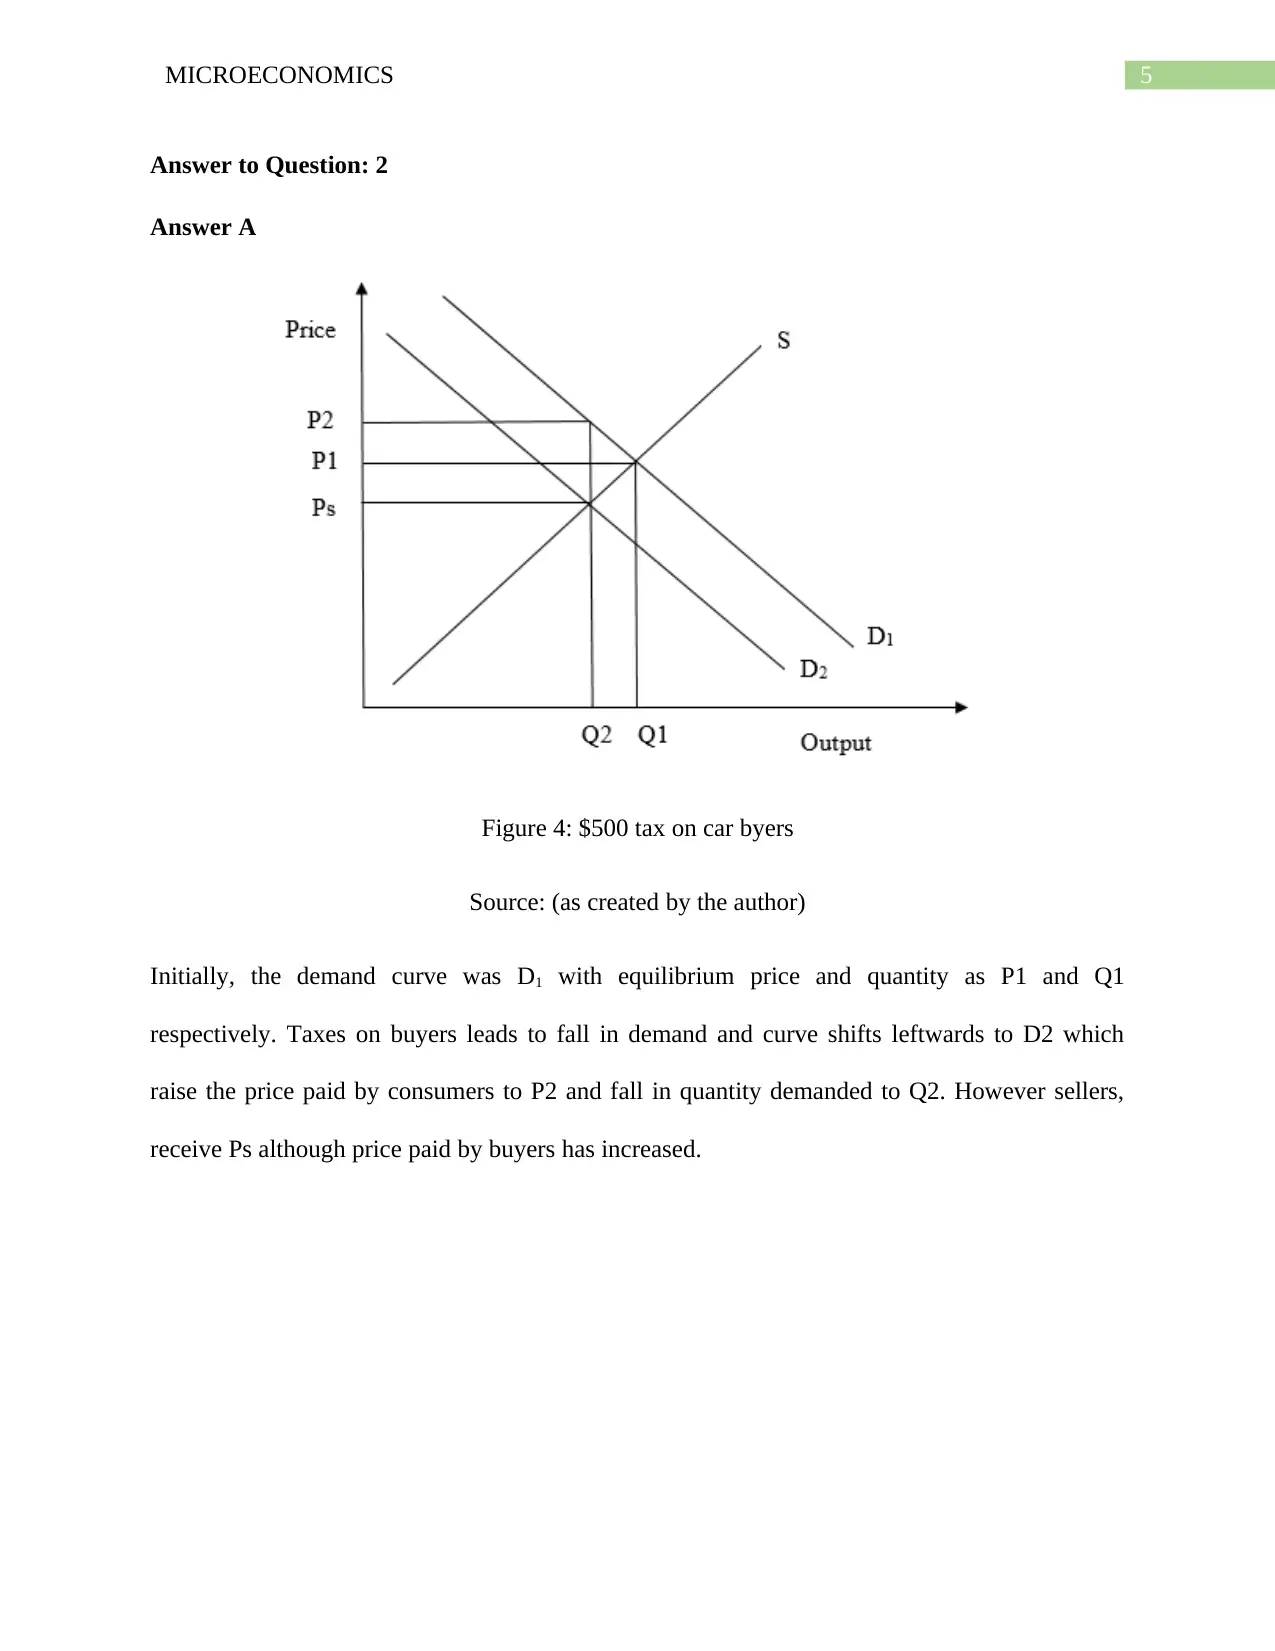
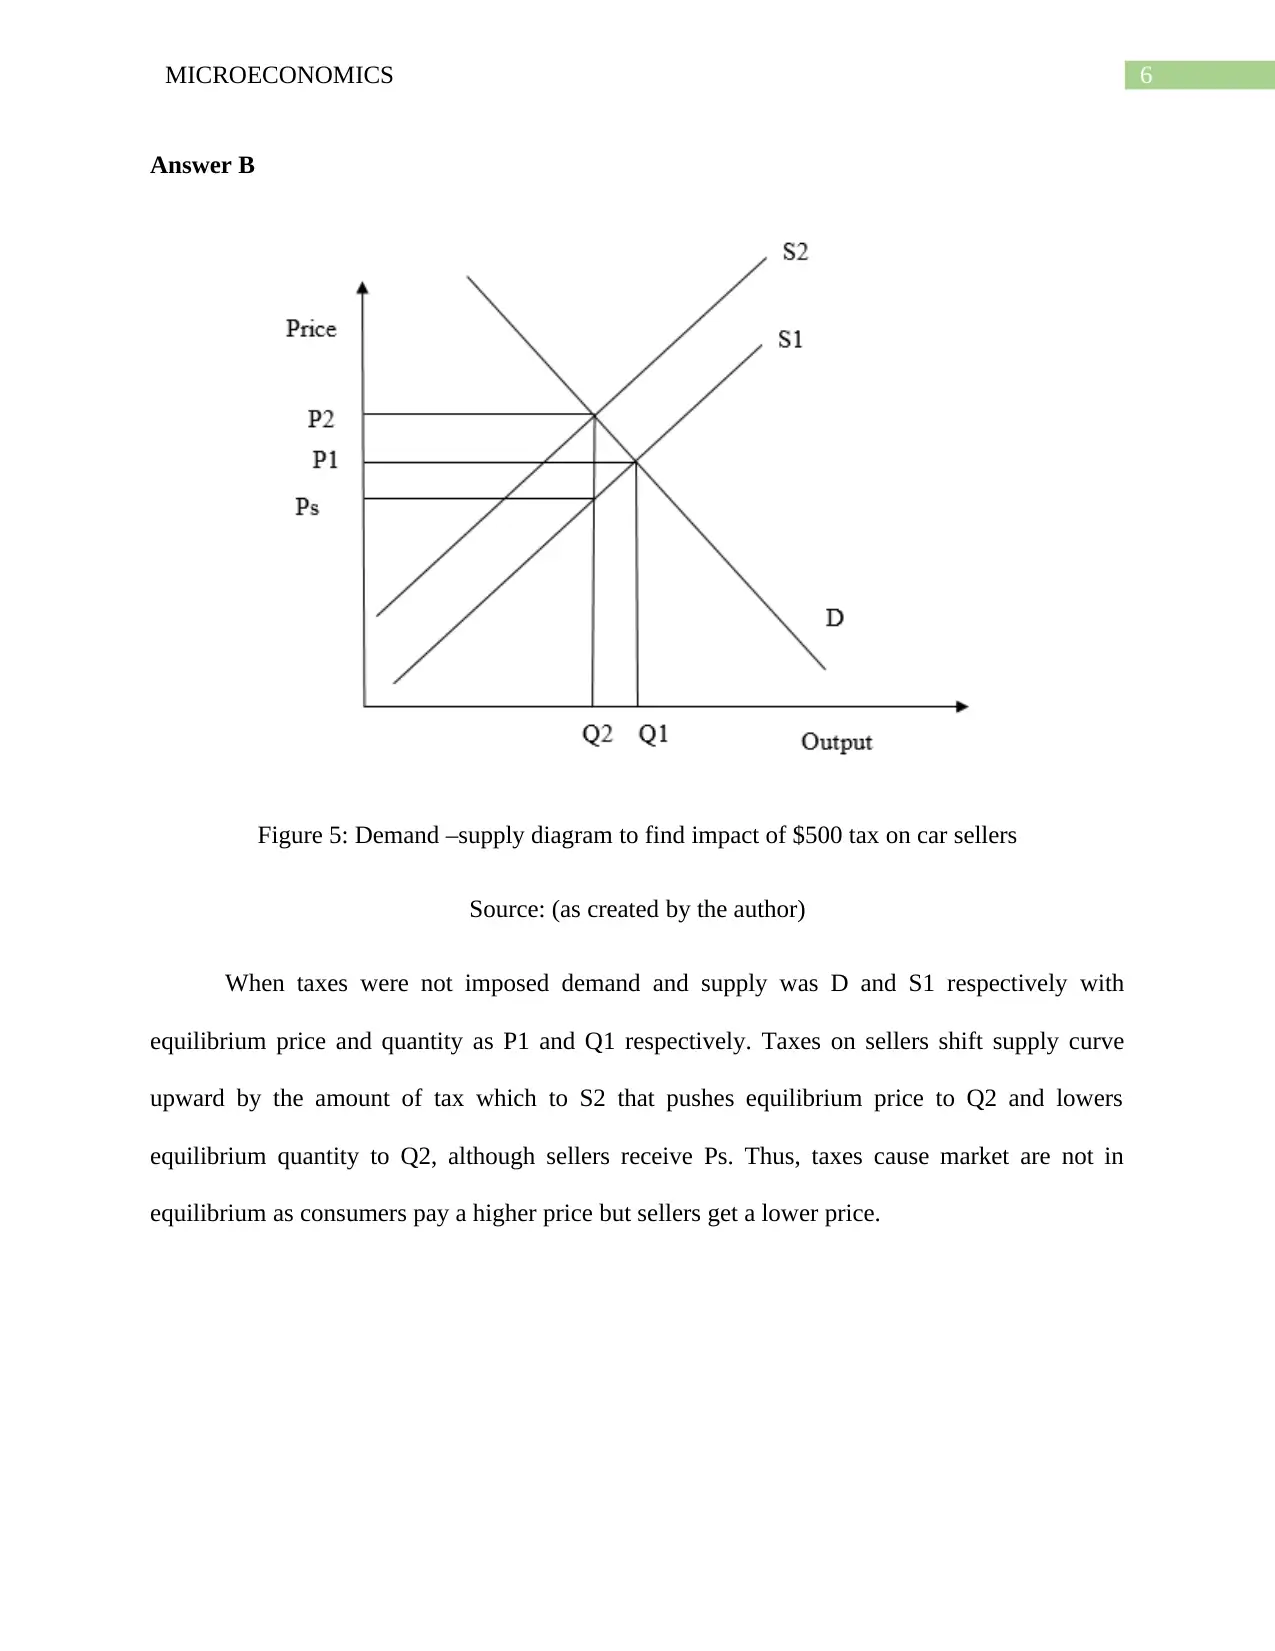
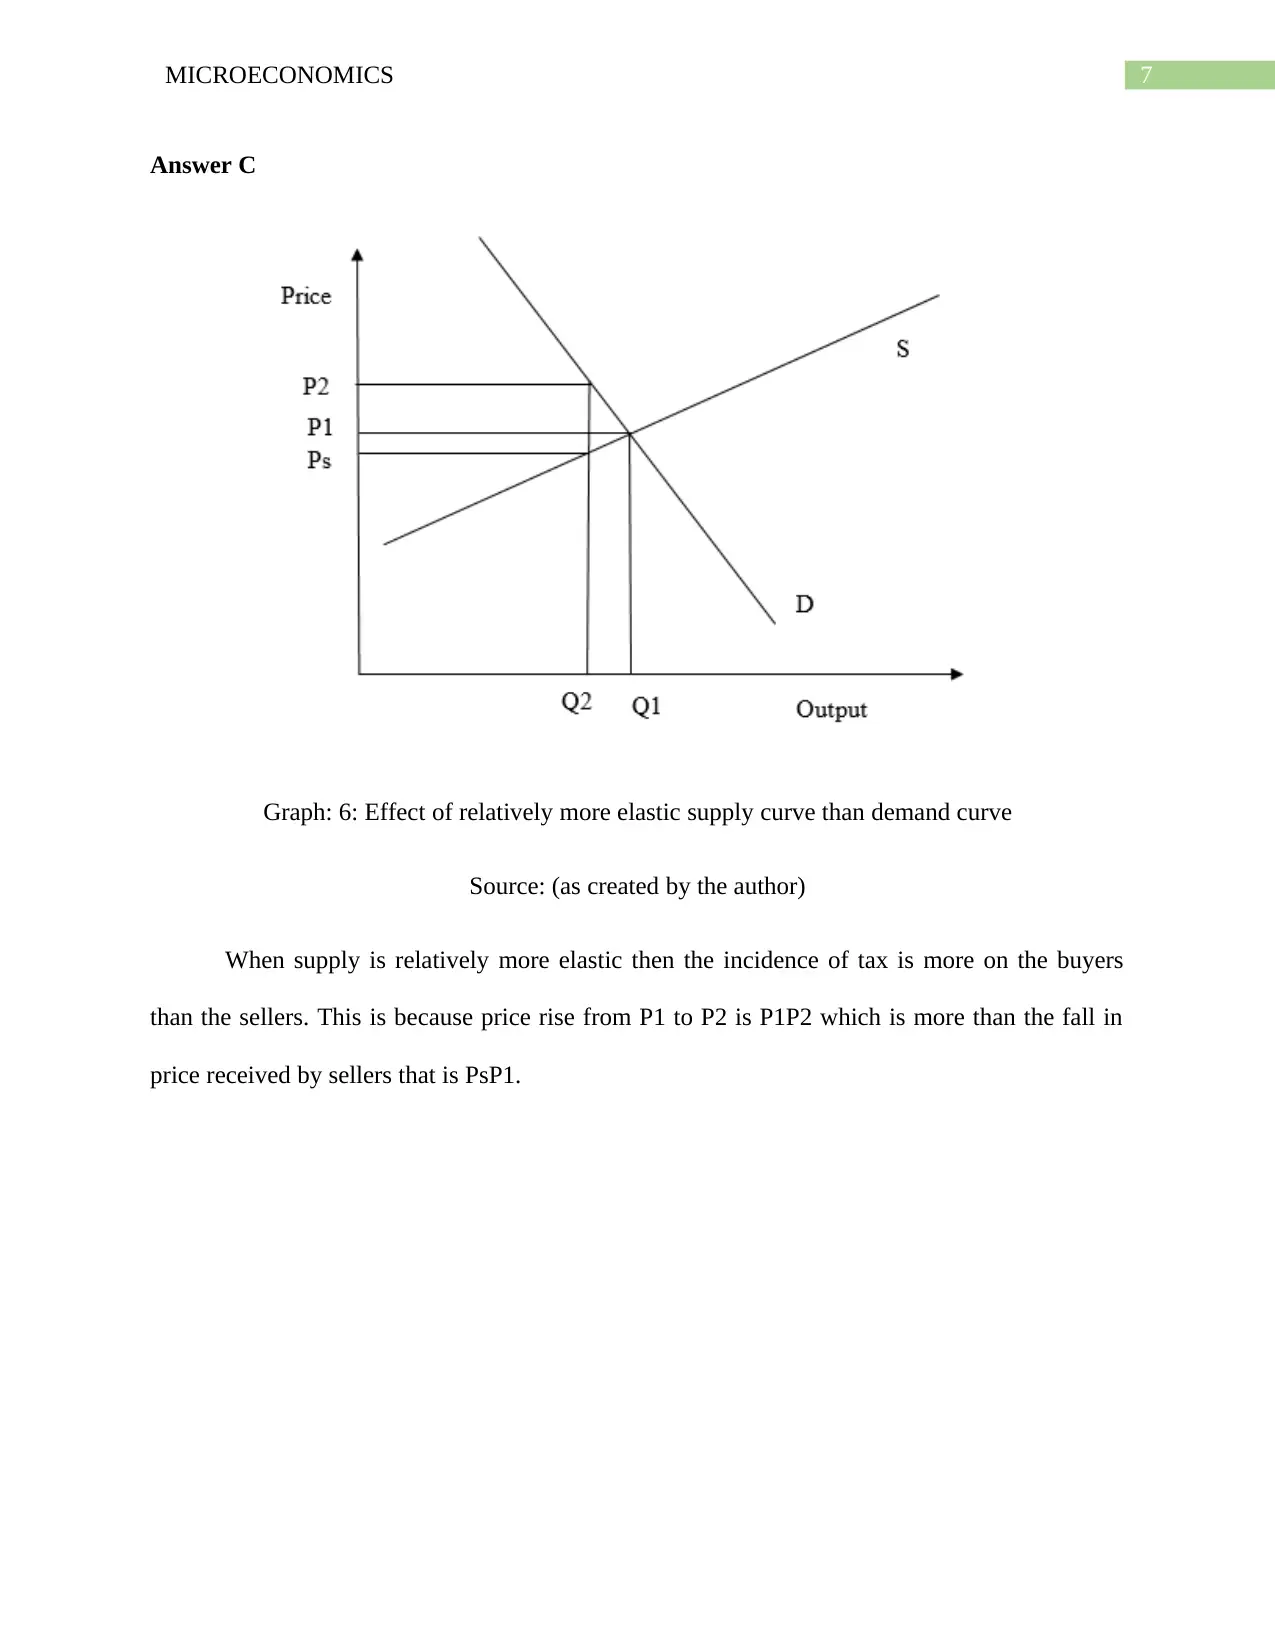
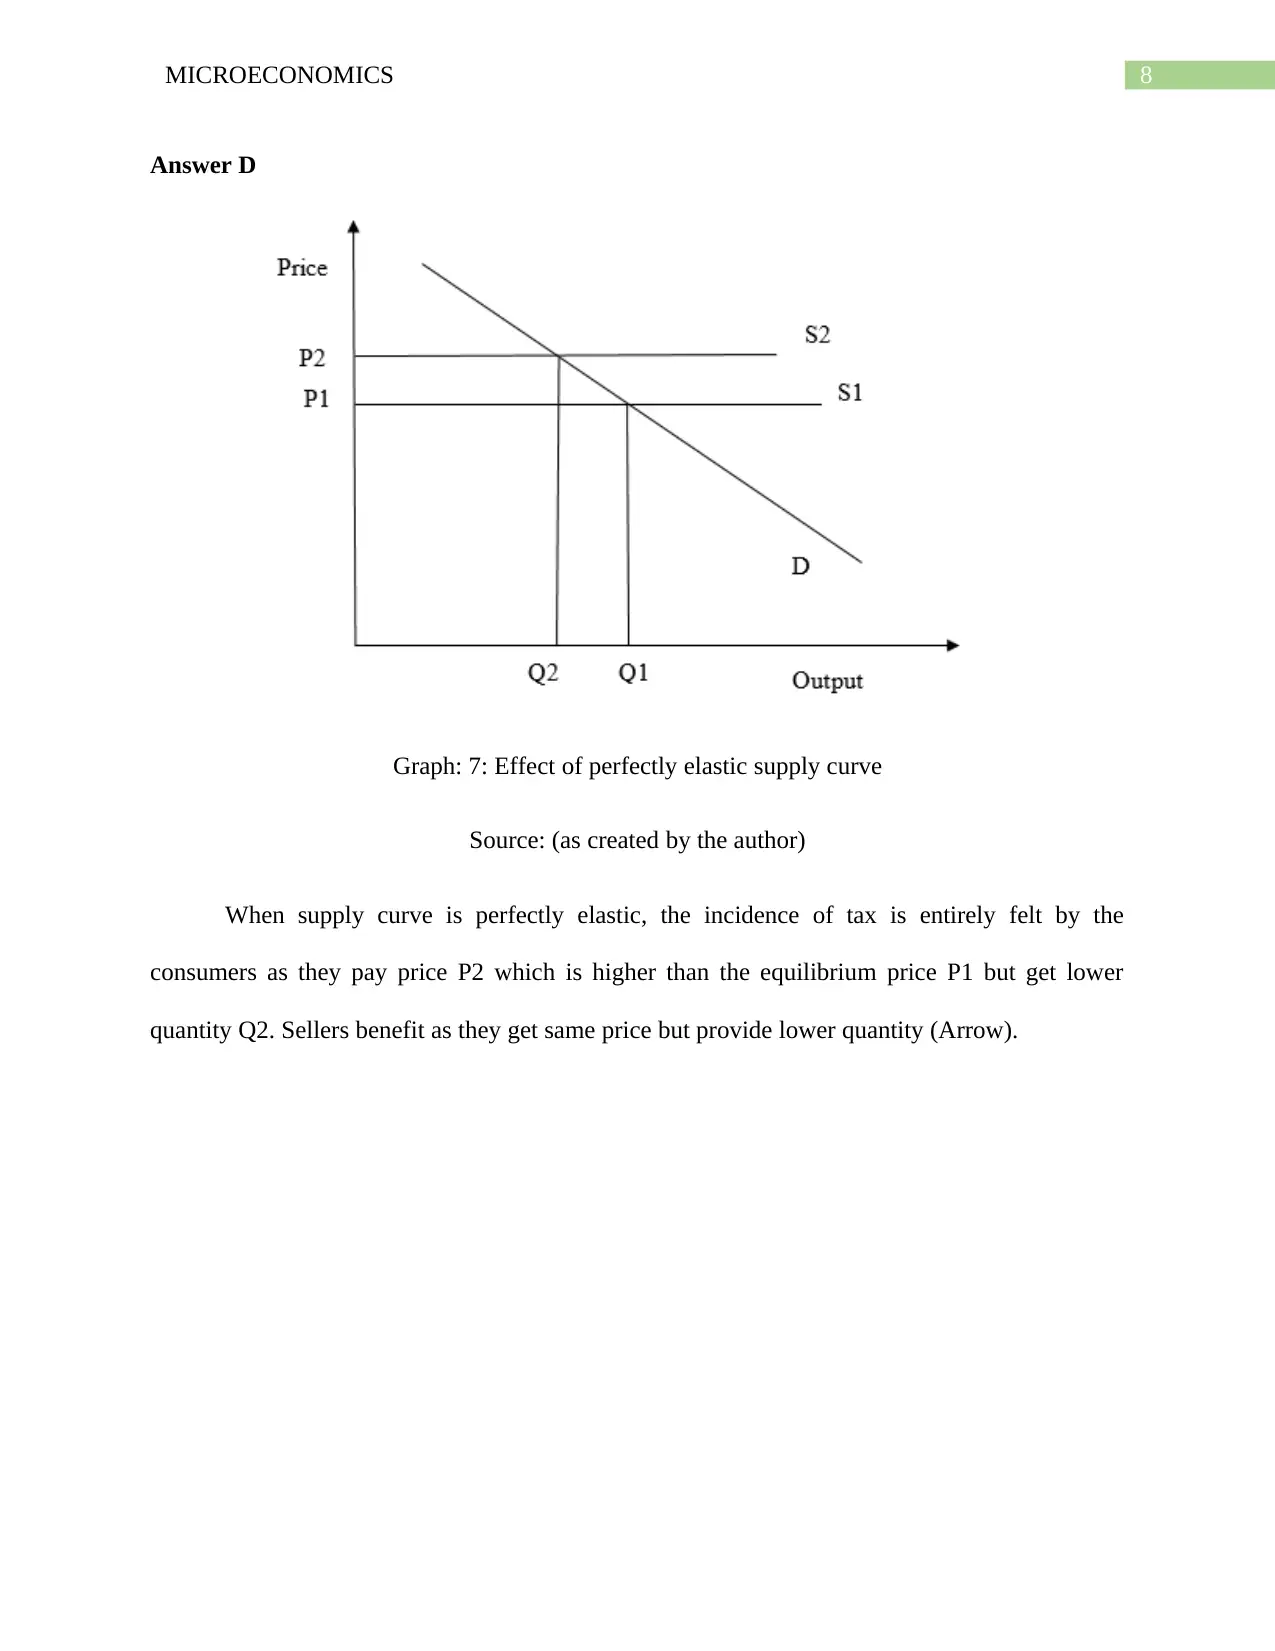
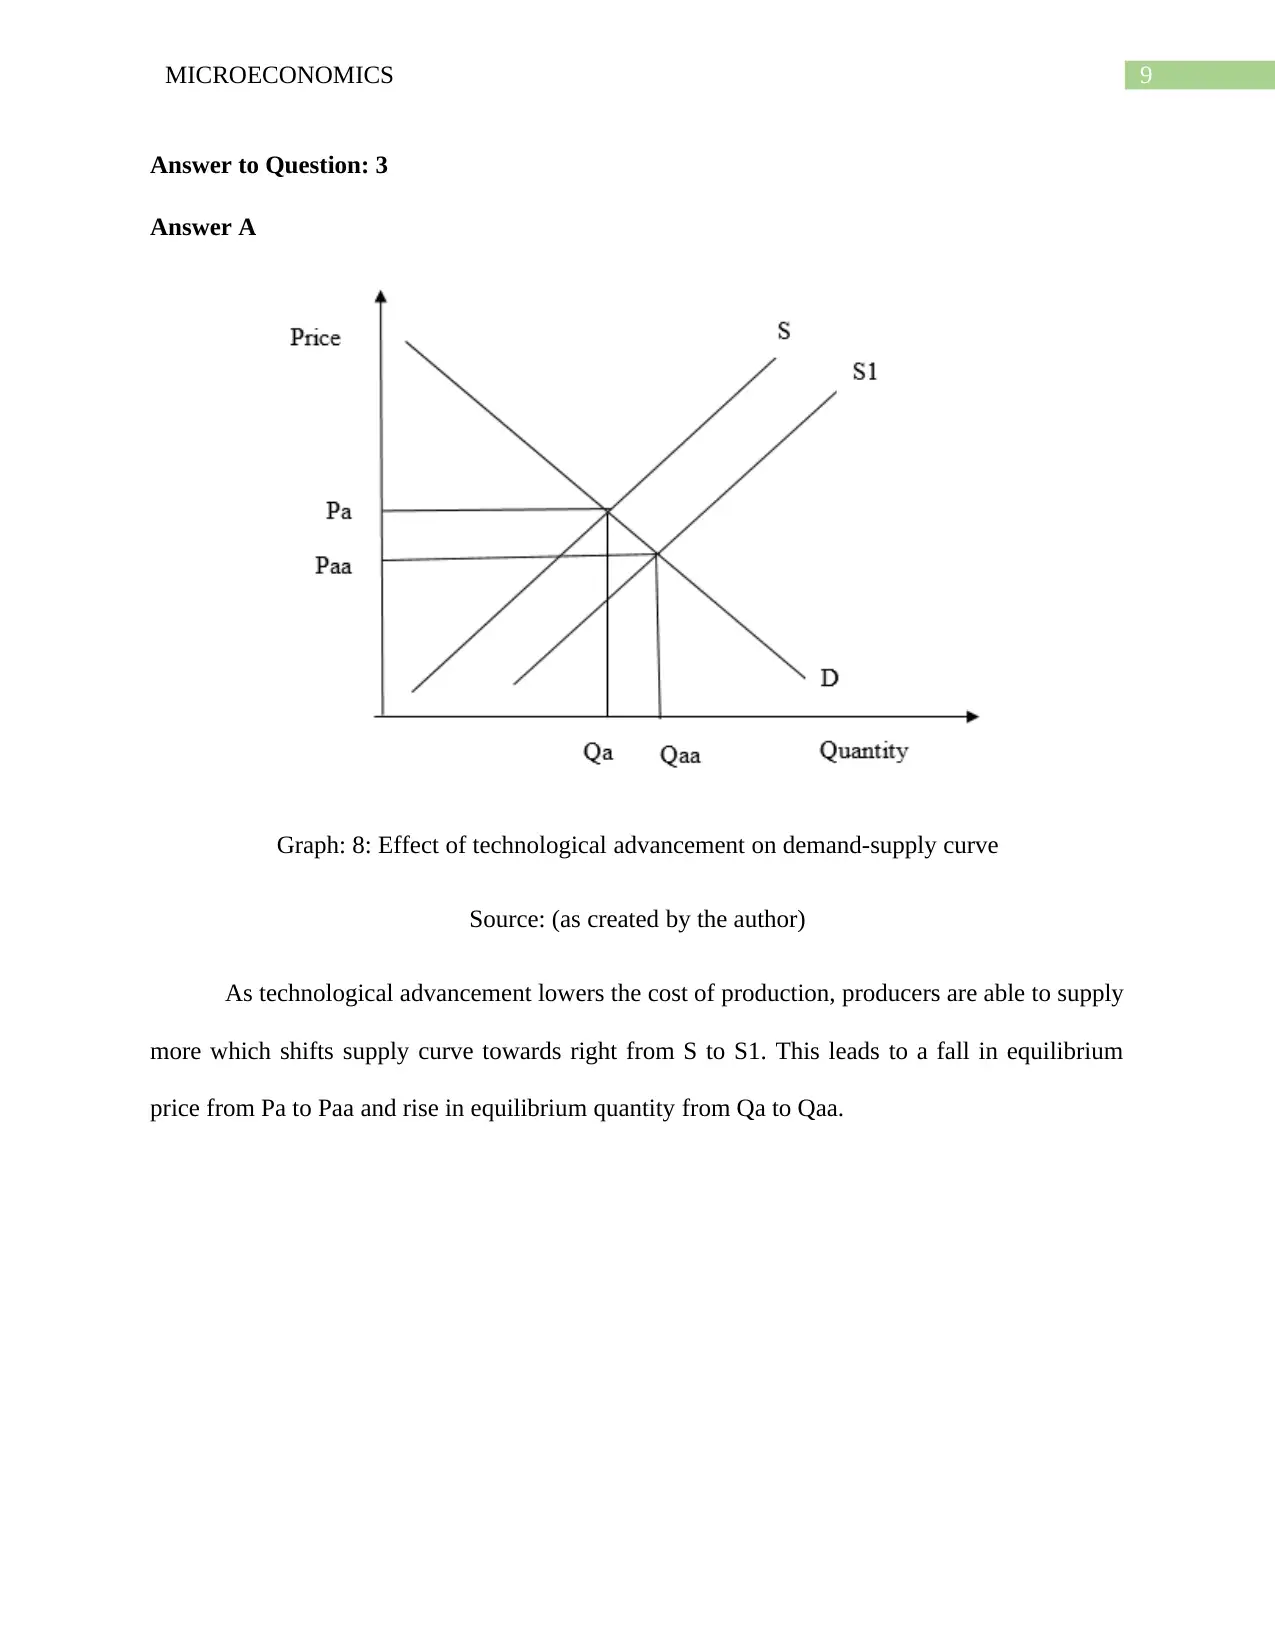
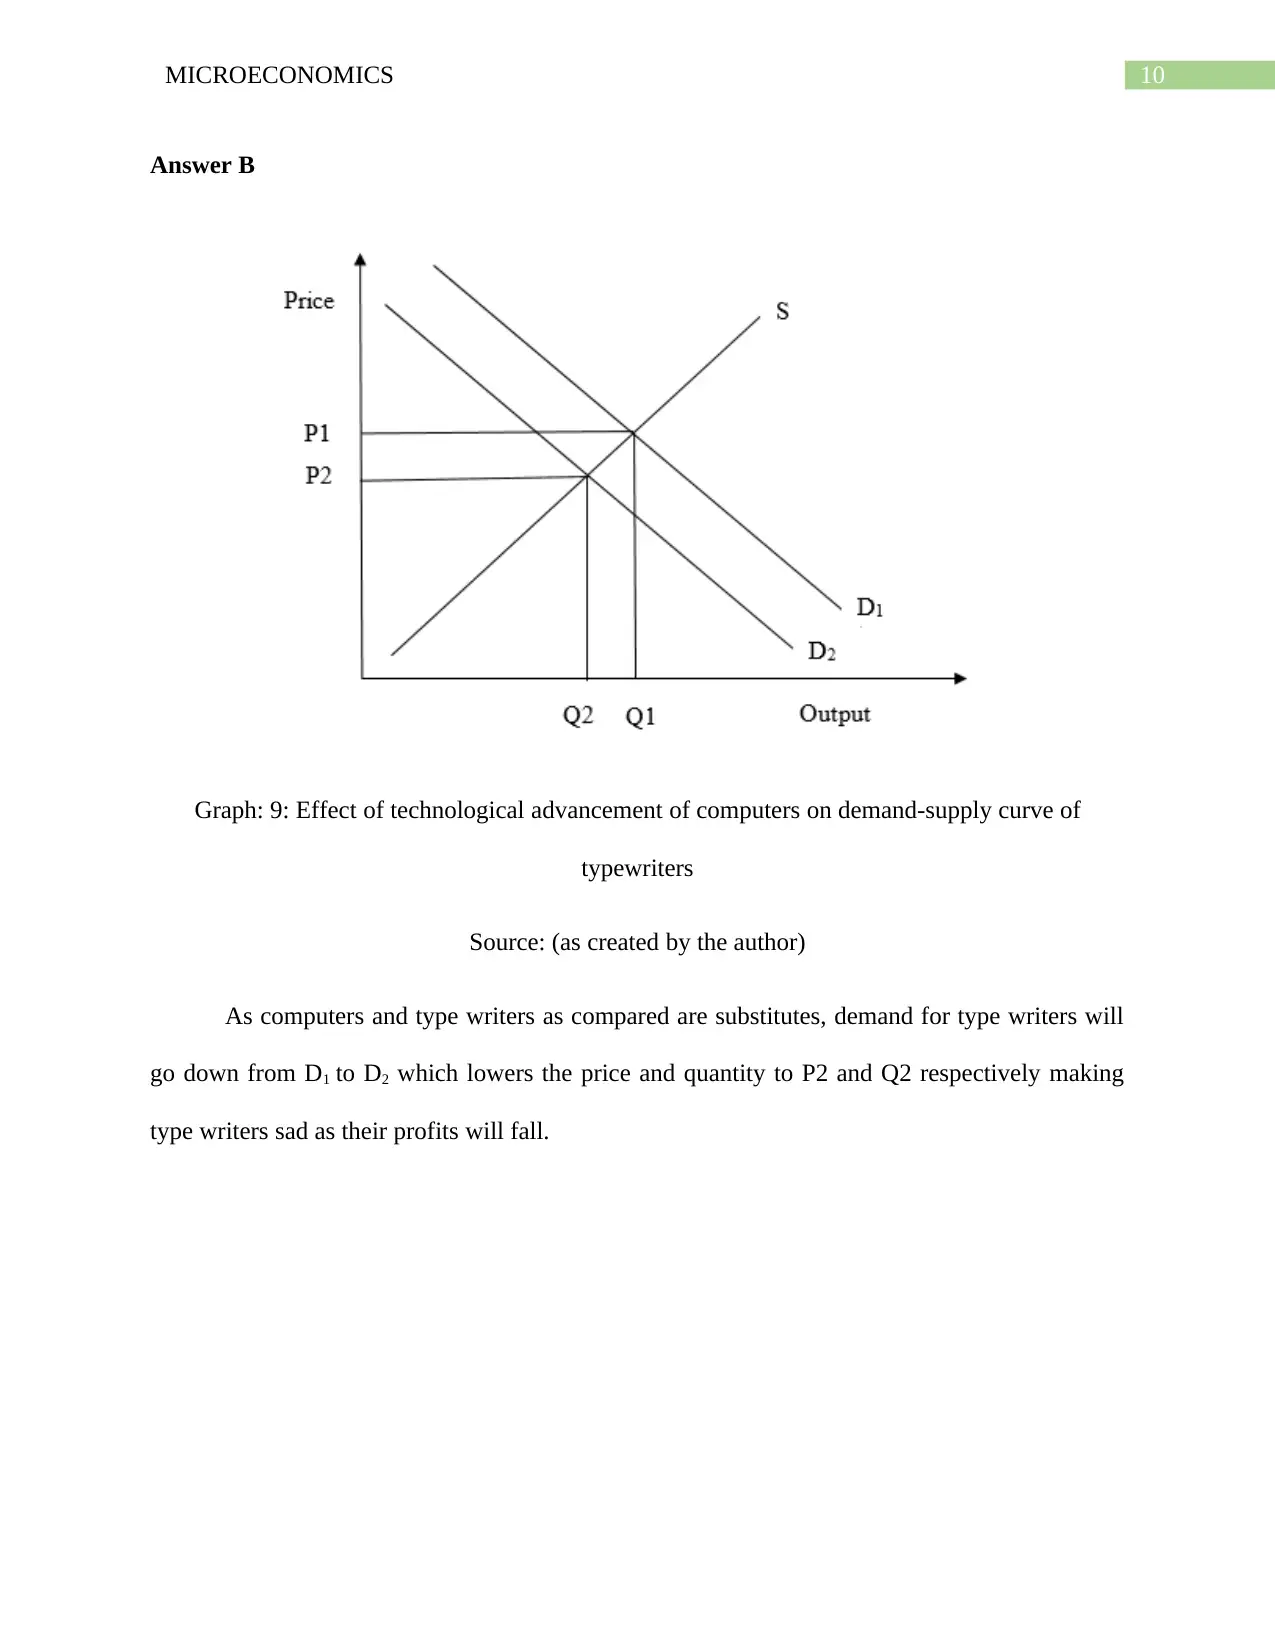
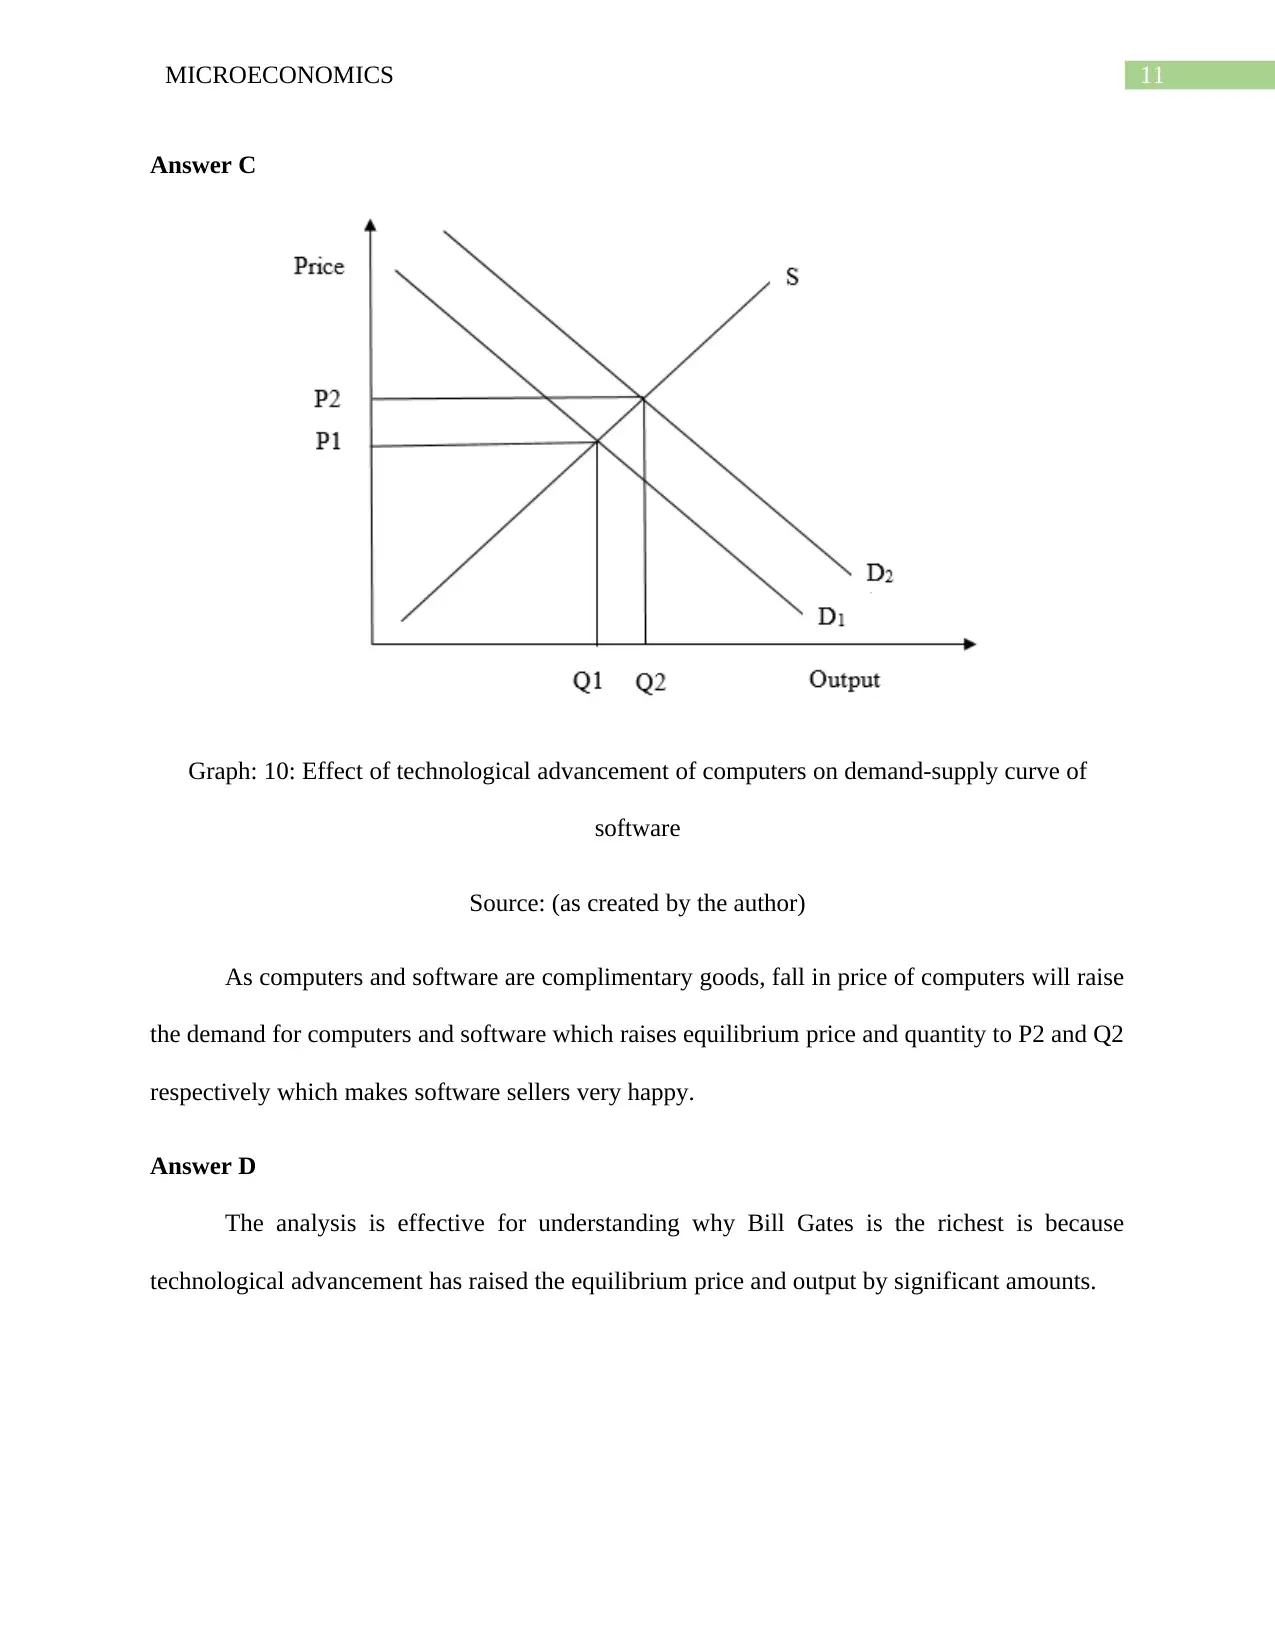
This microeconomics assignment solution provides detailed answers to three key questions. The first question analyzes the effects of price controls, specifically binding and non-binding rent control, using supply and demand diagrams. The second question examines the impact of taxes on both buyers and sellers, illustrating the effects with graphical representations and considering the elasticity of supply. The final question explores how technological advancements influence supply and demand curves, considering both the effects of technological progress within a market and the impact on related markets, such as the relationship between computers and typewriters or software. Each answer includes relevant graphs created by the author to illustrate the economic concepts, and the solution concludes with a reference list of cited sources.

Running head: MICROECONOMICS
MICROECONOMICS
Name of student:
Name of University:
Author Note:
MICROECONOMICS
Name of student:
Name of University:
Author Note:
Paraphrase This Document
Need a fresh take? Get an instant paraphrase of this document with our AI Paraphraser

1MICROECONOMICS
Table of Contents
Answer to Question: 1.....................................................................................................................2
Answer A.....................................................................................................................................2
Answer B.....................................................................................................................................3
Answer C.....................................................................................................................................3
Answer to Question: 2.....................................................................................................................5
Answer A.....................................................................................................................................5
Answer B.....................................................................................................................................6
Answer C.....................................................................................................................................7
Answer D.....................................................................................................................................8
Answer to Question: 3.....................................................................................................................9
Answer A.....................................................................................................................................9
Answer B...................................................................................................................................10
Answer C...................................................................................................................................11
Answer D...................................................................................................................................11
Reference List................................................................................................................................12

2MICROECONOMICS
Answer to Question: 1
Answer A
Figure 1: Housing market with non-binding rent control
Source: (as created by the author)
When price ceilings are imposed above equilibrium it is known as binding rent control. It is
ineffective as equilibrium price increases from Pa to Pnc there is no change in quantity as
quantity supplied is more than quantity demanded.
⊘ This is a preview!⊘
Do you want full access?
Subscribe today to unlock all pages.

Trusted by 1+ million students worldwide

3MICROECONOMICS
Answer B
Figure 2: Housing market with binding rent control or price ceiling
Source: (as created by the author)
Previously the equilibrium price and quantity was Pa and Qa respectively. After the imposition
of binding price ceiling, equilibrium price reduced to Pc which led to a shortage as quantity
demanded Qd exceeded the quantity supplied Qs. People who gets the house at low price are
benefitted but the excess demand will be disadvantageous to those who are unable to get the
house due to supply shortage (Paciorek).
Answer C
If immigration of the country lowers the population there is no guarantee of the degree of
shortage that can be lowered. The balance of shortage is based on amount of population moved
Paraphrase This Document
Need a fresh take? Get an instant paraphrase of this document with our AI Paraphraser

4MICROECONOMICS
out the country.
Graph 3: Effect of lower population
Source : (as cretaed by author)
Demand can go down from D0 to D1 that will lower the shortage as equilibrium quantity
decreases to Qa, yet everyone will not be satisfied.
out the country.
Graph 3: Effect of lower population
Source : (as cretaed by author)
Demand can go down from D0 to D1 that will lower the shortage as equilibrium quantity
decreases to Qa, yet everyone will not be satisfied.

5MICROECONOMICS
Answer to Question: 2
Answer A
Figure 4: $500 tax on car byers
Source: (as created by the author)
Initially, the demand curve was D1 with equilibrium price and quantity as P1 and Q1
respectively. Taxes on buyers leads to fall in demand and curve shifts leftwards to D2 which
raise the price paid by consumers to P2 and fall in quantity demanded to Q2. However sellers,
receive Ps although price paid by buyers has increased.
⊘ This is a preview!⊘
Do you want full access?
Subscribe today to unlock all pages.

Trusted by 1+ million students worldwide

6MICROECONOMICS
Answer B
Figure 5: Demand –supply diagram to find impact of $500 tax on car sellers
Source: (as created by the author)
When taxes were not imposed demand and supply was D and S1 respectively with
equilibrium price and quantity as P1 and Q1 respectively. Taxes on sellers shift supply curve
upward by the amount of tax which to S2 that pushes equilibrium price to Q2 and lowers
equilibrium quantity to Q2, although sellers receive Ps. Thus, taxes cause market are not in
equilibrium as consumers pay a higher price but sellers get a lower price.
Paraphrase This Document
Need a fresh take? Get an instant paraphrase of this document with our AI Paraphraser

7MICROECONOMICS
Answer C
Graph: 6: Effect of relatively more elastic supply curve than demand curve
Source: (as created by the author)
When supply is relatively more elastic then the incidence of tax is more on the buyers
than the sellers. This is because price rise from P1 to P2 is P1P2 which is more than the fall in
price received by sellers that is PsP1.

8MICROECONOMICS
Answer D
Graph: 7: Effect of perfectly elastic supply curve
Source: (as created by the author)
When supply curve is perfectly elastic, the incidence of tax is entirely felt by the
consumers as they pay price P2 which is higher than the equilibrium price P1 but get lower
quantity Q2. Sellers benefit as they get same price but provide lower quantity (Arrow).
⊘ This is a preview!⊘
Do you want full access?
Subscribe today to unlock all pages.

Trusted by 1+ million students worldwide

9MICROECONOMICS
Answer to Question: 3
Answer A
Graph: 8: Effect of technological advancement on demand-supply curve
Source: (as created by the author)
As technological advancement lowers the cost of production, producers are able to supply
more which shifts supply curve towards right from S to S1. This leads to a fall in equilibrium
price from Pa to Paa and rise in equilibrium quantity from Qa to Qaa.
Paraphrase This Document
Need a fresh take? Get an instant paraphrase of this document with our AI Paraphraser

10MICROECONOMICS
Answer B
Graph: 9: Effect of technological advancement of computers on demand-supply curve of
typewriters
Source: (as created by the author)
As computers and type writers as compared are substitutes, demand for type writers will
go down from D1 to D2 which lowers the price and quantity to P2 and Q2 respectively making
type writers sad as their profits will fall.

11MICROECONOMICS
Answer C
Graph: 10: Effect of technological advancement of computers on demand-supply curve of
software
Source: (as created by the author)
As computers and software are complimentary goods, fall in price of computers will raise
the demand for computers and software which raises equilibrium price and quantity to P2 and Q2
respectively which makes software sellers very happy.
Answer D
The analysis is effective for understanding why Bill Gates is the richest is because
technological advancement has raised the equilibrium price and output by significant amounts.
⊘ This is a preview!⊘
Do you want full access?
Subscribe today to unlock all pages.

Trusted by 1+ million students worldwide
1 out of 13