Microeconomics Assignment: Analysis of Market Structures and Tariffs
VerifiedAdded on 2022/10/01
|12
|2031
|295
Homework Assignment
AI Summary
This microeconomics assignment analyzes the market power of Cemex in Mexico, exploring its sources and pricing strategies, including price discrimination. The assignment also examines the impact of China's retaliatory tariffs on petroleum products from the United States, and how this affects the market for Liquid Natural Gas (LNG) in Australia. The analysis includes the use of diagrams to illustrate the effects of tariffs and market dynamics, as well as calculations of markup percentages and elasticity of demand. The assignment provides a comprehensive overview of market structures, international trade, and the economic effects of government policies and trade wars, with references to relevant articles and economic theories.
Running head: MICROECONOMICS: PRINCIPLES AND THEORIES
MICROECONOMICS: PRINCIPLES AND THEORIES
Name of the Student
Name of the University
Author Note
Course ID:
MICROECONOMICS: PRINCIPLES AND THEORIES
Name of the Student
Name of the University
Author Note
Course ID:
Paraphrase This Document
Need a fresh take? Get an instant paraphrase of this document with our AI Paraphraser

1MICROECONOMICS: PRINCIPLES AND THEORIES
Table of Contents
Answer to Question 1(a)............................................................................................................2
Answer to Question 1(b)............................................................................................................3
Answer to Question 1(c)............................................................................................................4
Answer to Question 2.................................................................................................................5
References................................................................................................................................10
2
Price and costs
MC
P
m
Pc
MR
Qm Qc
D=AR=MR
MICROECONOMICS: PRINCIPLES AND THEORIES
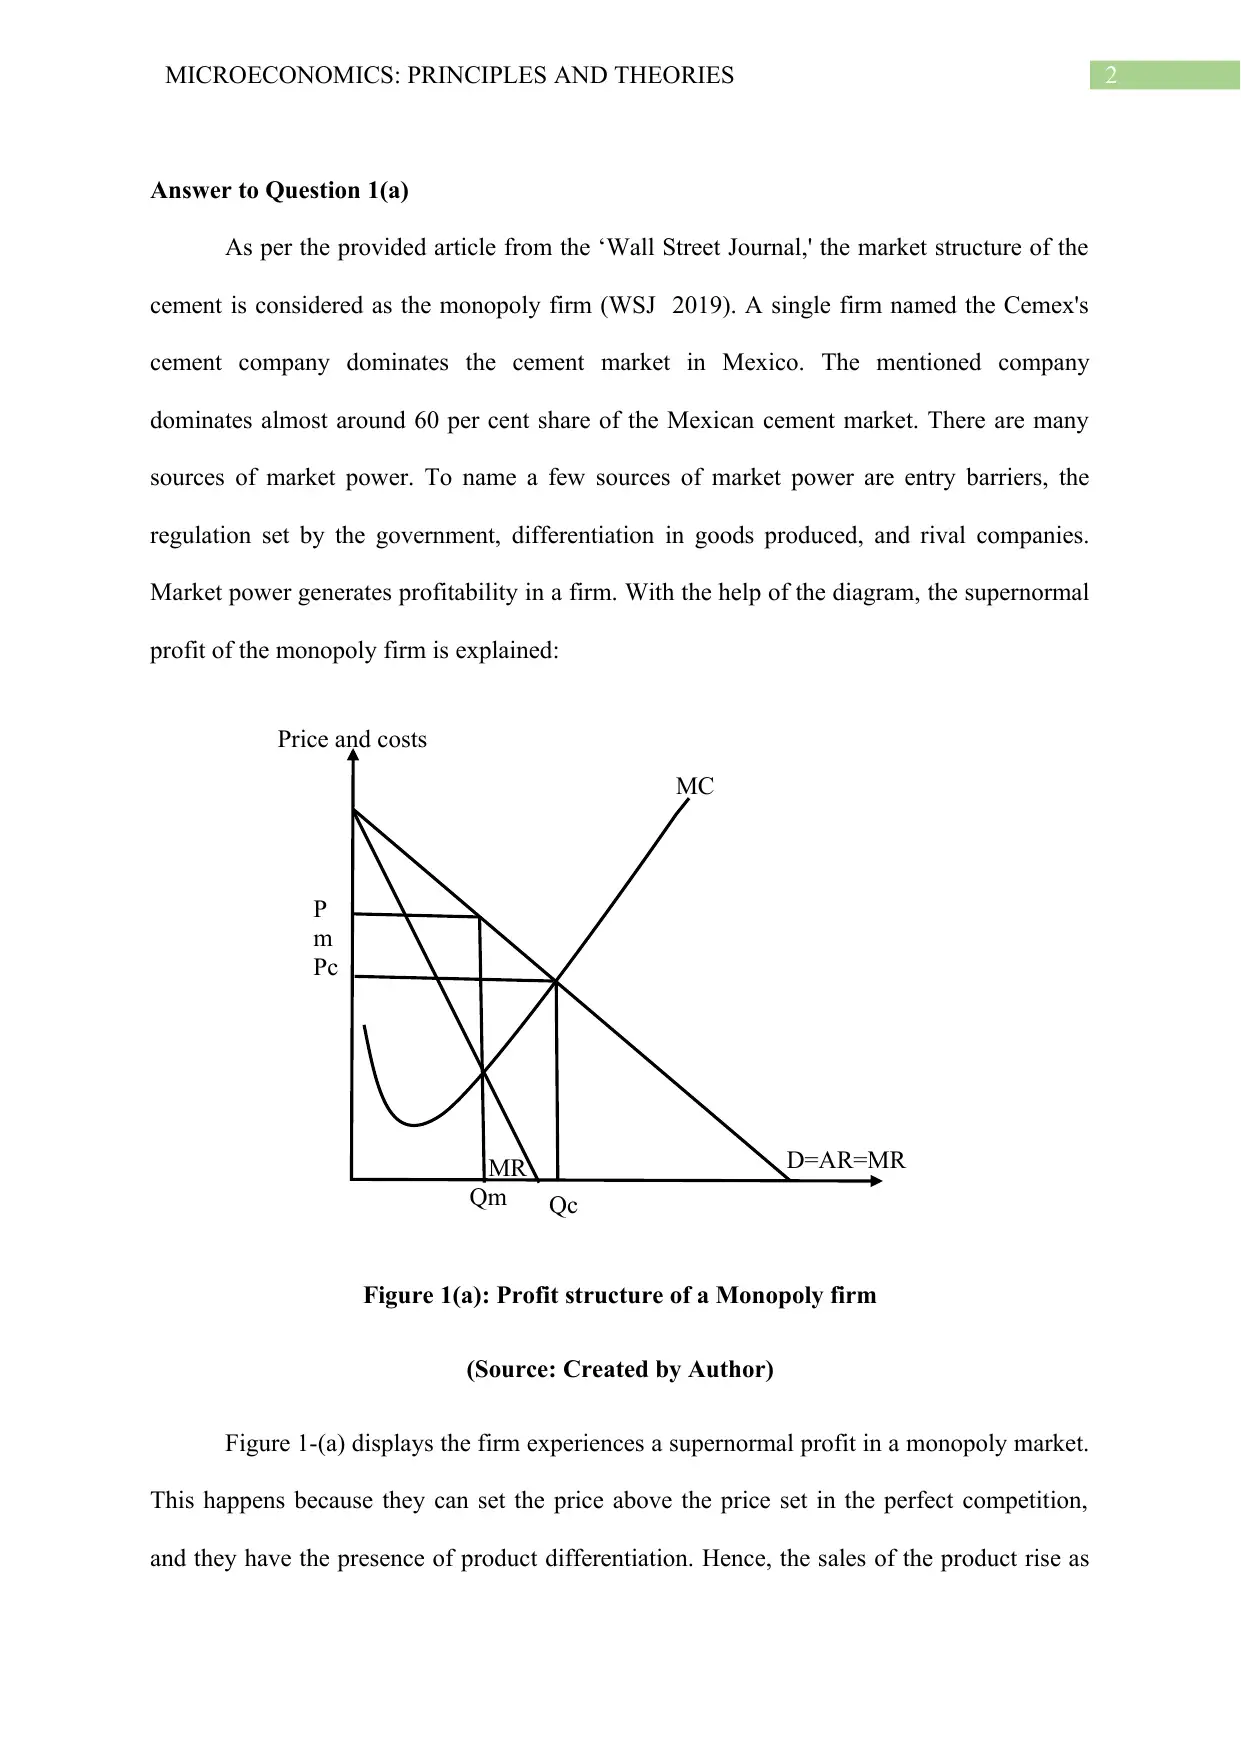
Answer to Question 1(a)
As per the provided article from the ‘Wall Street Journal,' the market structure of the
cement is considered as the monopoly firm (WSJ 2019). A single firm named the Cemex's
cement company dominates the cement market in Mexico. The mentioned company
dominates almost around 60 per cent share of the Mexican cement market. There are many
sources of market power. To name a few sources of market power are entry barriers, the
regulation set by the government, differentiation in goods produced, and rival companies.
Market power generates profitability in a firm. With the help of the diagram, the supernormal
profit of the monopoly firm is explained:
Figure 1(a): Profit structure of a Monopoly firm
(Source: Created by Author)
Figure 1-(a) displays the firm experiences a supernormal profit in a monopoly market.
This happens because they can set the price above the price set in the perfect competition,
and they have the presence of product differentiation. Hence, the sales of the product rise as
Price and costs
MC
P
m
Pc
MR
Qm Qc
D=AR=MR
MICROECONOMICS: PRINCIPLES AND THEORIES
Answer to Question 1(a)
As per the provided article from the ‘Wall Street Journal,' the market structure of the
cement is considered as the monopoly firm (WSJ 2019). A single firm named the Cemex's
cement company dominates the cement market in Mexico. The mentioned company
dominates almost around 60 per cent share of the Mexican cement market. There are many
sources of market power. To name a few sources of market power are entry barriers, the
regulation set by the government, differentiation in goods produced, and rival companies.
Market power generates profitability in a firm. With the help of the diagram, the supernormal
profit of the monopoly firm is explained:
Figure 1(a): Profit structure of a Monopoly firm
(Source: Created by Author)
Figure 1-(a) displays the firm experiences a supernormal profit in a monopoly market.
This happens because they can set the price above the price set in the perfect competition,
and they have the presence of product differentiation. Hence, the sales of the product rise as
⊘ This is a preview!⊘
Do you want full access?
Subscribe today to unlock all pages.
Trusted by 1+ million students worldwide
3MICROECONOMICS: PRINCIPLES AND THEORIES
the firm dominates all other firms. This generates more profit for the firms leading to high
revenue of the firm. The mentioned article, which is provided as a case study, points out that
there are three sources of monopoly power. The three sources were the presence of the rival
cement company in the United States, government approval, and barriers to entry
(Worldbank.org 2019). The rival cement companies from the United States are accusing
Cemex because of its dominance on an unfair basis in the Mexican market. Hence, this
Cemex Company in Mexico is setting a steep price so that sales their share increases both in
Mexico and in the U.S market. Recently, they are contributing around 60 per cent share in the
Mexican cement market.
Government regulation is considered as another source of market power. Here, in the
provided case study, the article noted that Mexican Cemex Company is dominating the
cement sector and liking the presence of the monopoly power. Both in the domestic and the
international country they are earning monopoly profit by setting monopoly prices. The
government has introduced the project of Cemex in order to improve the construction
companies in Mexico.
Another source of the market power in the mentioned case is the barrier of other firms
in entering the market. Since the government regulations are present, which is making the
Cemex cement one of the dominant firms. This is a leading restriction to the other firms
producing the same product to enter into the Mexican cement market.
Answer to Question 1(b)
In the United States, the selling price of cement by Cemex Company is $ 82, while for
the same product, the selling price is $ 160 in Mexico. As known, Cemex is a firm in a
monopoly market. It is the only firm, which dominates the sectors, producing cement. From
the case study mentioned in the article, it can be seen that there is discrimination in the rates
Paraphrase This Document
Need a fresh take? Get an instant paraphrase of this document with our AI Paraphraser
4MICROECONOMICS: PRINCIPLES AND THEORIES
of the similar good. The price discrimination because of the geographical variation (Pindyck
and Rubinfeld 2015). Thus, the producers, producing cement are getting more benefit in this
case. Hence, the firm is gaining supernormal profits in the market. The diagram shown by
figure 1 (a) depicts the dominating behavior of the producer in the monopoly market. The
price is kept above the price of the competitive market. Thus, the producer is receiving more
money by selling the same products. This is generating profit in the firm. Hence, in this way,
the Cemex market is earning more revenue.
Answer to Question 1(c)
The implied markup percentage is computed using the following formula:
Markup percentage=(( Selling price per unit −Cost price per unit)÷ Cost Price per unit ) ×100
In the mentioned case study, there is the two-markup percentage. One for the United
States and the other of Mexico.
Markup percentage for U . S= ( ( $ 82−$ 35 ) ÷ $ 35 ) ×100
Markup percentage for U . S= ( ( $ 82−$ 35 ) ÷ $ 35 ) ×100=1.34285714286× 100
Markup percentage for U . S=134.29 %
Markup percentage for Mexico= ( ( $ 160−$ 25 ) ÷ $ 25 ) × 100
Markup percentage for Mexico= ( ( $ 82−$ 35 ) ÷ $ 35 ) × 100=5.4 × 100
Markup percentage for Mexico=54 %
From the theoretical study, the price elasticity of demand is calculated with the help
of the following formula (Gordon, Goldfarb and Li 2013).
Price Elasticity of Demand=Change∈quantity demanded as a percentage change ÷ Change∈ price as the perc
5MICROECONOMICS: PRINCIPLES AND THEORIES
Now, the elasticity of price demanded Cemex’s cement in the United States-
Price Elasticity of Demand of Cemex cement ∈U . S= ( ( 110−40 ) ÷ ( 82−35 ) )
Price Elasticity of Demand of Cemex cement ∈U . S=70÷ 47
Price Elasticity of Demand of Cemex cement ∈U . S=1.49(¿)
While the price elasticity of demand for the Cemex's cement in Mexico-
Price Elasticity of Demand of Cemex cement ∈Mexico= ( ( 110−40 ) ÷ ( 160−25 ) )
Price Elasticity of Demand of Cemex cement ∈Mexico=70 ÷ 135
Price Elasticity of Demand of Cemex cement ∈Mexico=0.52( ¿)
Answer to Question 2
Recently in 2018 July, China retaliated by imposing a 25 per cent tariff on petroleum
products, which the country imports from the United States (AFR.com 2019). U.S and
Australia are the biggest competitors on exporting petroleum products to China.
⊘ This is a preview!⊘
Do you want full access?
Subscribe today to unlock all pages.
Trusted by 1+ million students worldwide
6MICROECONOMICS: PRINCIPLES AND THEORIES
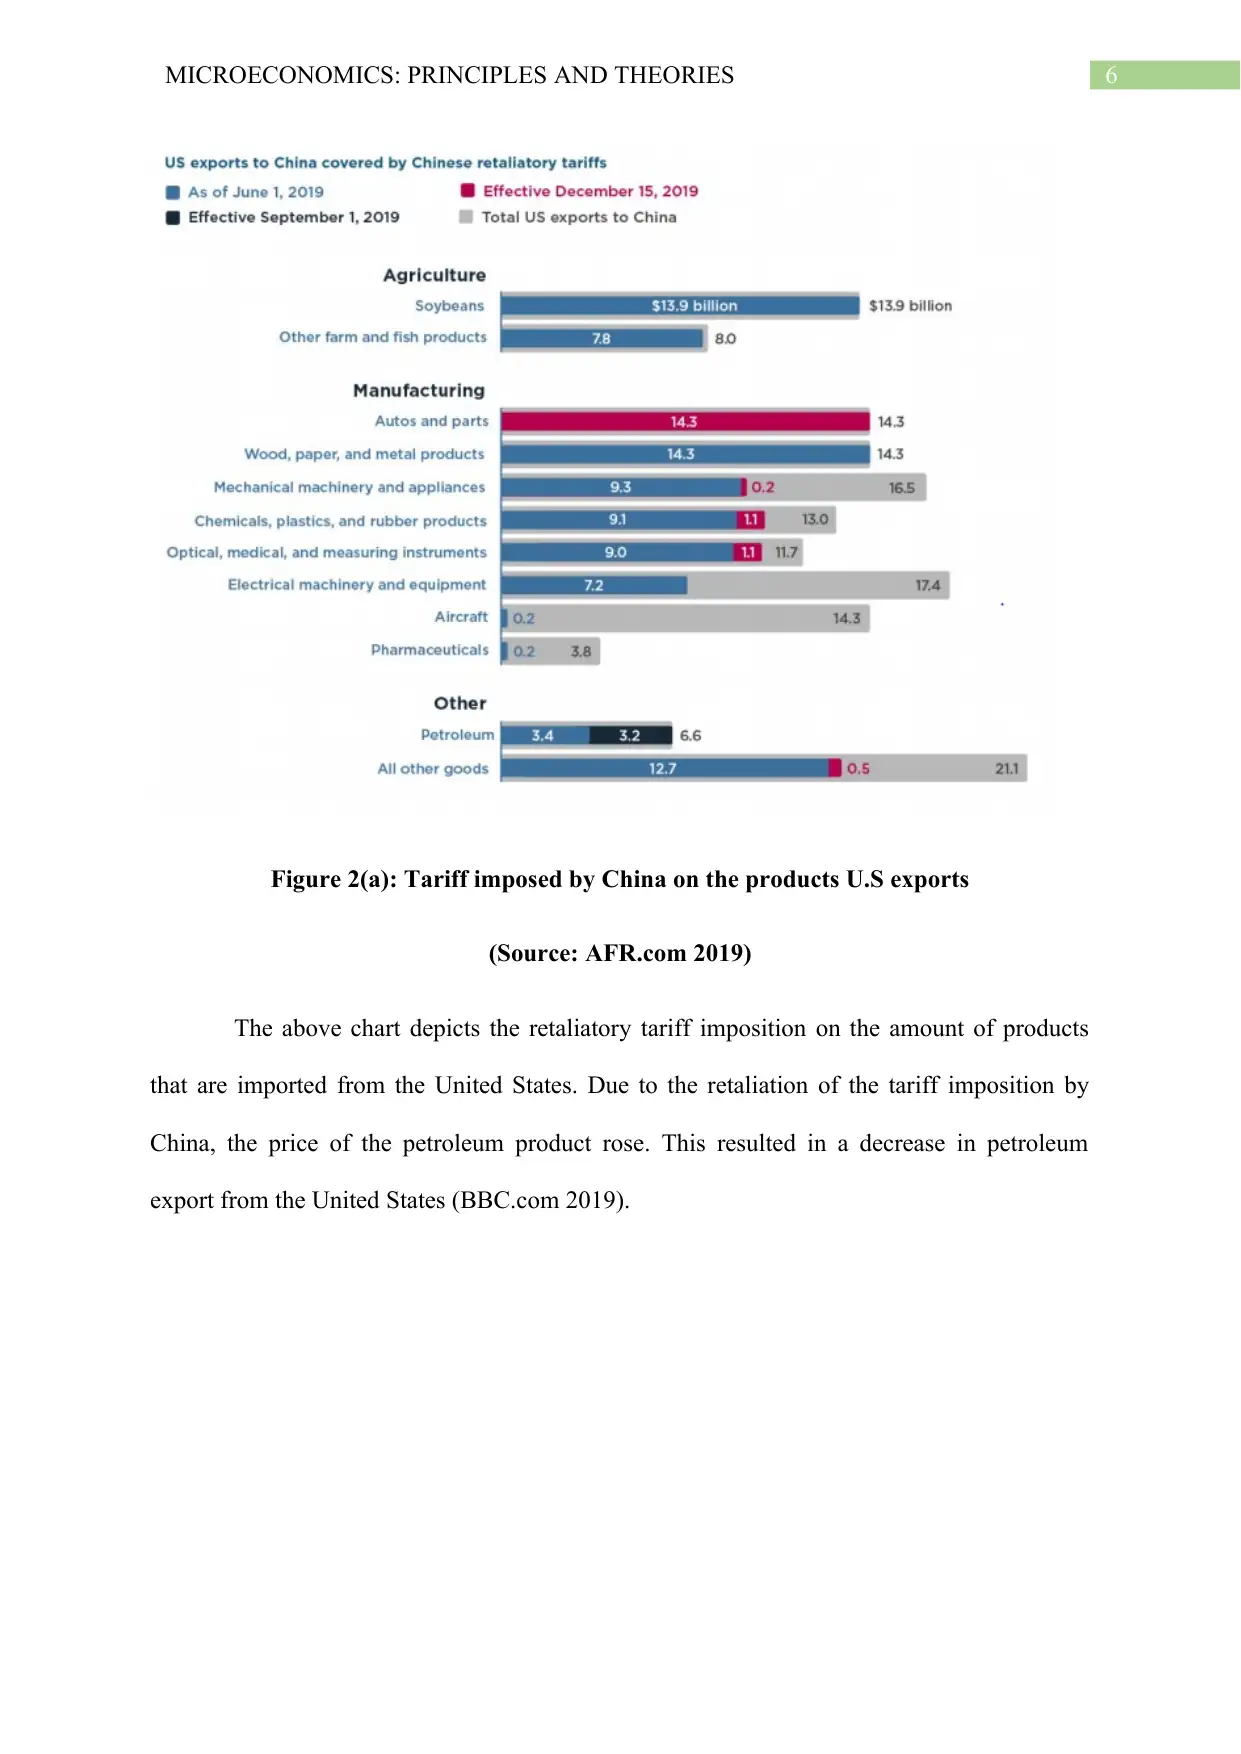
Figure 2(a): Tariff imposed by China on the products U.S exports
(Source: AFR.com 2019)
The above chart depicts the retaliatory tariff imposition on the amount of products
that are imported from the United States. Due to the retaliation of the tariff imposition by
China, the price of the petroleum product rose. This resulted in a decrease in petroleum
export from the United States (BBC.com 2019).
Paraphrase This Document
Need a fresh take? Get an instant paraphrase of this document with our AI Paraphraser
7MICROECONOMICS: PRINCIPLES AND THEORIES
Price Price
Quantity Quantity
SD
A B C D
E F G H
PTI
M
PTE
X
PFT
STI
M
DTI
M
DS
PTI
M
PTE
X
PFT a b c d
e f g h
DTE
X
Importing Country Exporting Country
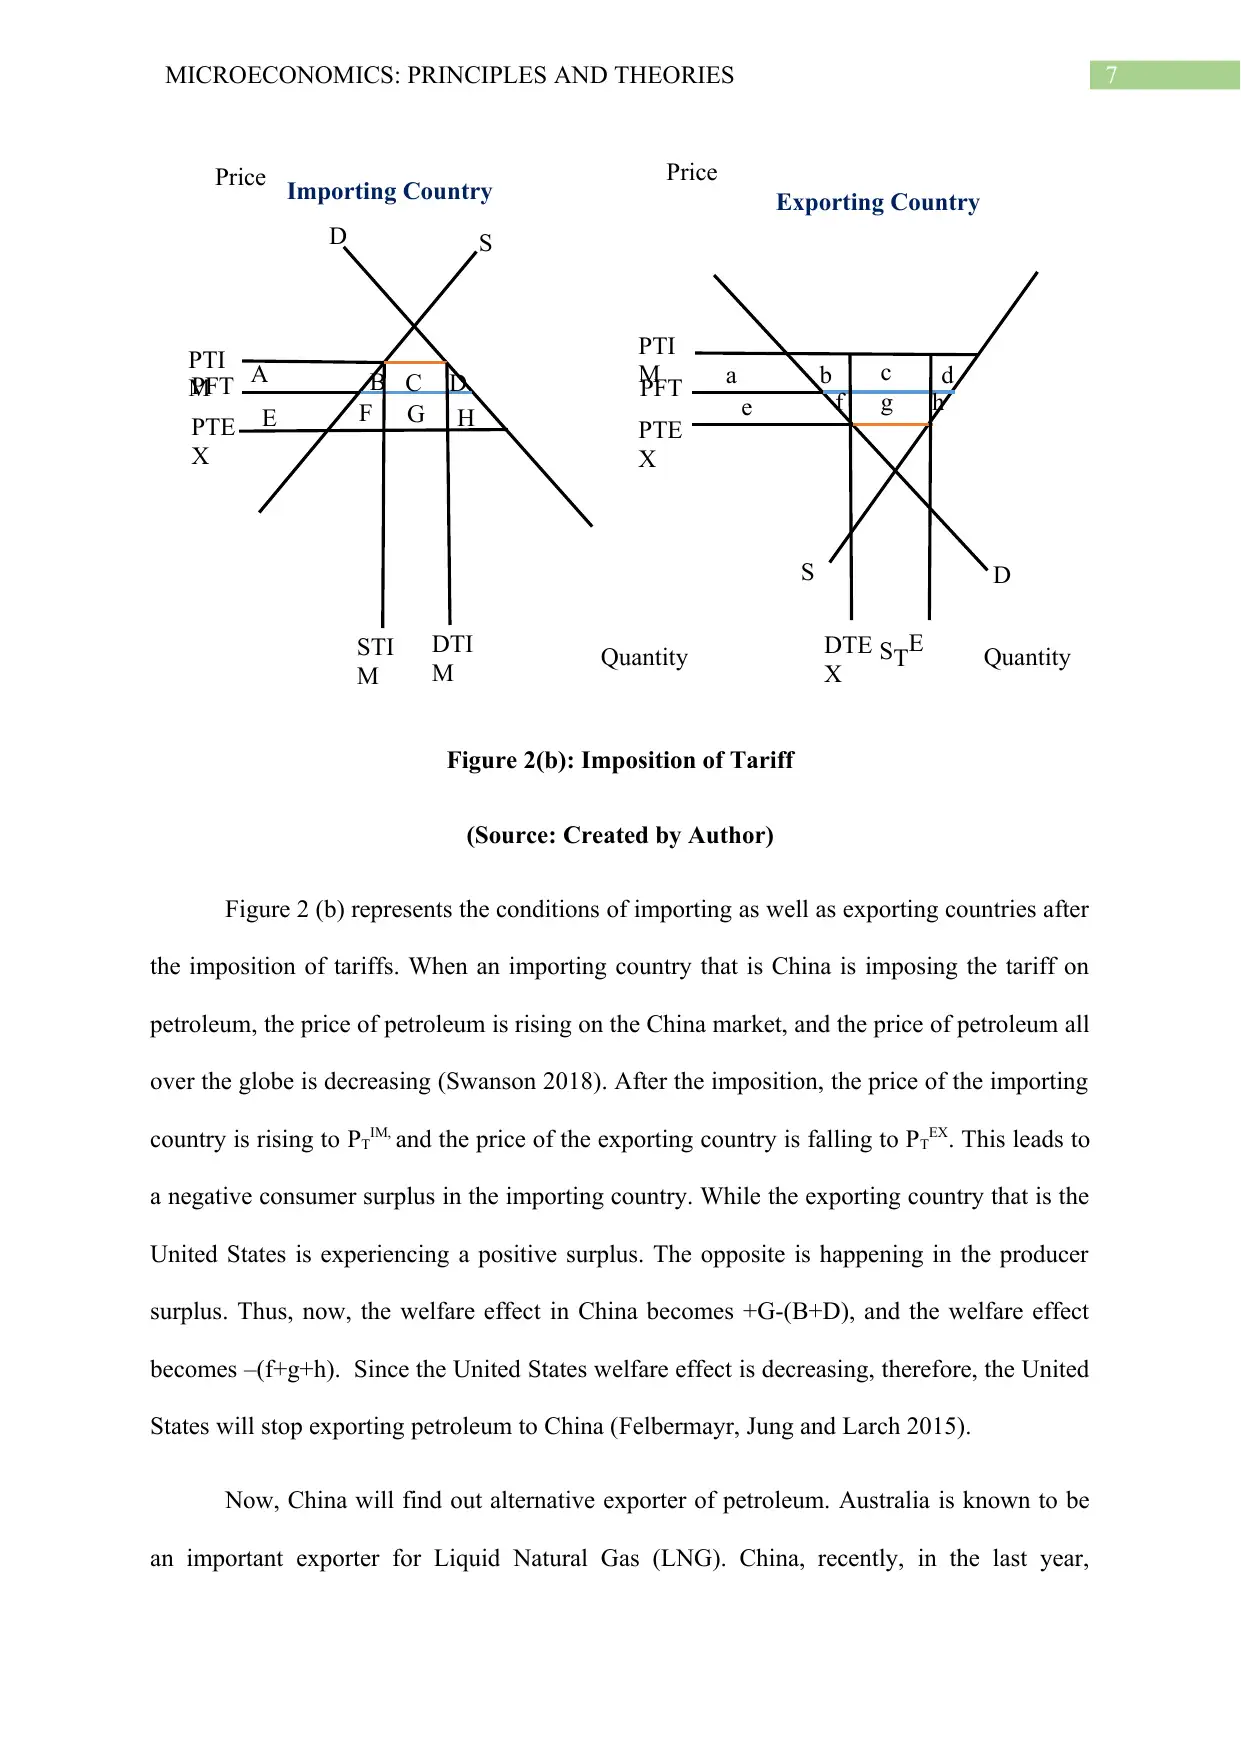
Figure 2(b): Imposition of Tariff
(Source: Created by Author)
Figure 2 (b) represents the conditions of importing as well as exporting countries after
the imposition of tariffs. When an importing country that is China is imposing the tariff on
petroleum, the price of petroleum is rising on the China market, and the price of petroleum all
over the globe is decreasing (Swanson 2018). After the imposition, the price of the importing
country is rising to PTIM, and the price of the exporting country is falling to PTEX. This leads to
a negative consumer surplus in the importing country. While the exporting country that is the
United States is experiencing a positive surplus. The opposite is happening in the producer
surplus. Thus, now, the welfare effect in China becomes +G-(B+D), and the welfare effect
becomes –(f+g+h). Since the United States welfare effect is decreasing, therefore, the United
States will stop exporting petroleum to China (Felbermayr, Jung and Larch 2015).
Now, China will find out alternative exporter of petroleum. Australia is known to be
an important exporter for Liquid Natural Gas (LNG). China, recently, in the last year,
STE
Price Price
Quantity Quantity
SD
A B C D
E F G H
PTI
M
PTE
X
PFT
STI
M
DTI
M
DS
PTI
M
PTE
X
PFT a b c d
e f g h
DTE
X
Importing Country Exporting Country
Figure 2(b): Imposition of Tariff
(Source: Created by Author)
Figure 2 (b) represents the conditions of importing as well as exporting countries after
the imposition of tariffs. When an importing country that is China is imposing the tariff on
petroleum, the price of petroleum is rising on the China market, and the price of petroleum all
over the globe is decreasing (Swanson 2018). After the imposition, the price of the importing
country is rising to PTIM, and the price of the exporting country is falling to PTEX. This leads to
a negative consumer surplus in the importing country. While the exporting country that is the
United States is experiencing a positive surplus. The opposite is happening in the producer
surplus. Thus, now, the welfare effect in China becomes +G-(B+D), and the welfare effect
becomes –(f+g+h). Since the United States welfare effect is decreasing, therefore, the United
States will stop exporting petroleum to China (Felbermayr, Jung and Larch 2015).
Now, China will find out alternative exporter of petroleum. Australia is known to be
an important exporter for Liquid Natural Gas (LNG). China, recently, in the last year,
STE
8MICROECONOMICS: PRINCIPLES AND THEORIES
S
S D
D D1
D1
E
E1
Price
QuantityQ Q1
P
S1
S1
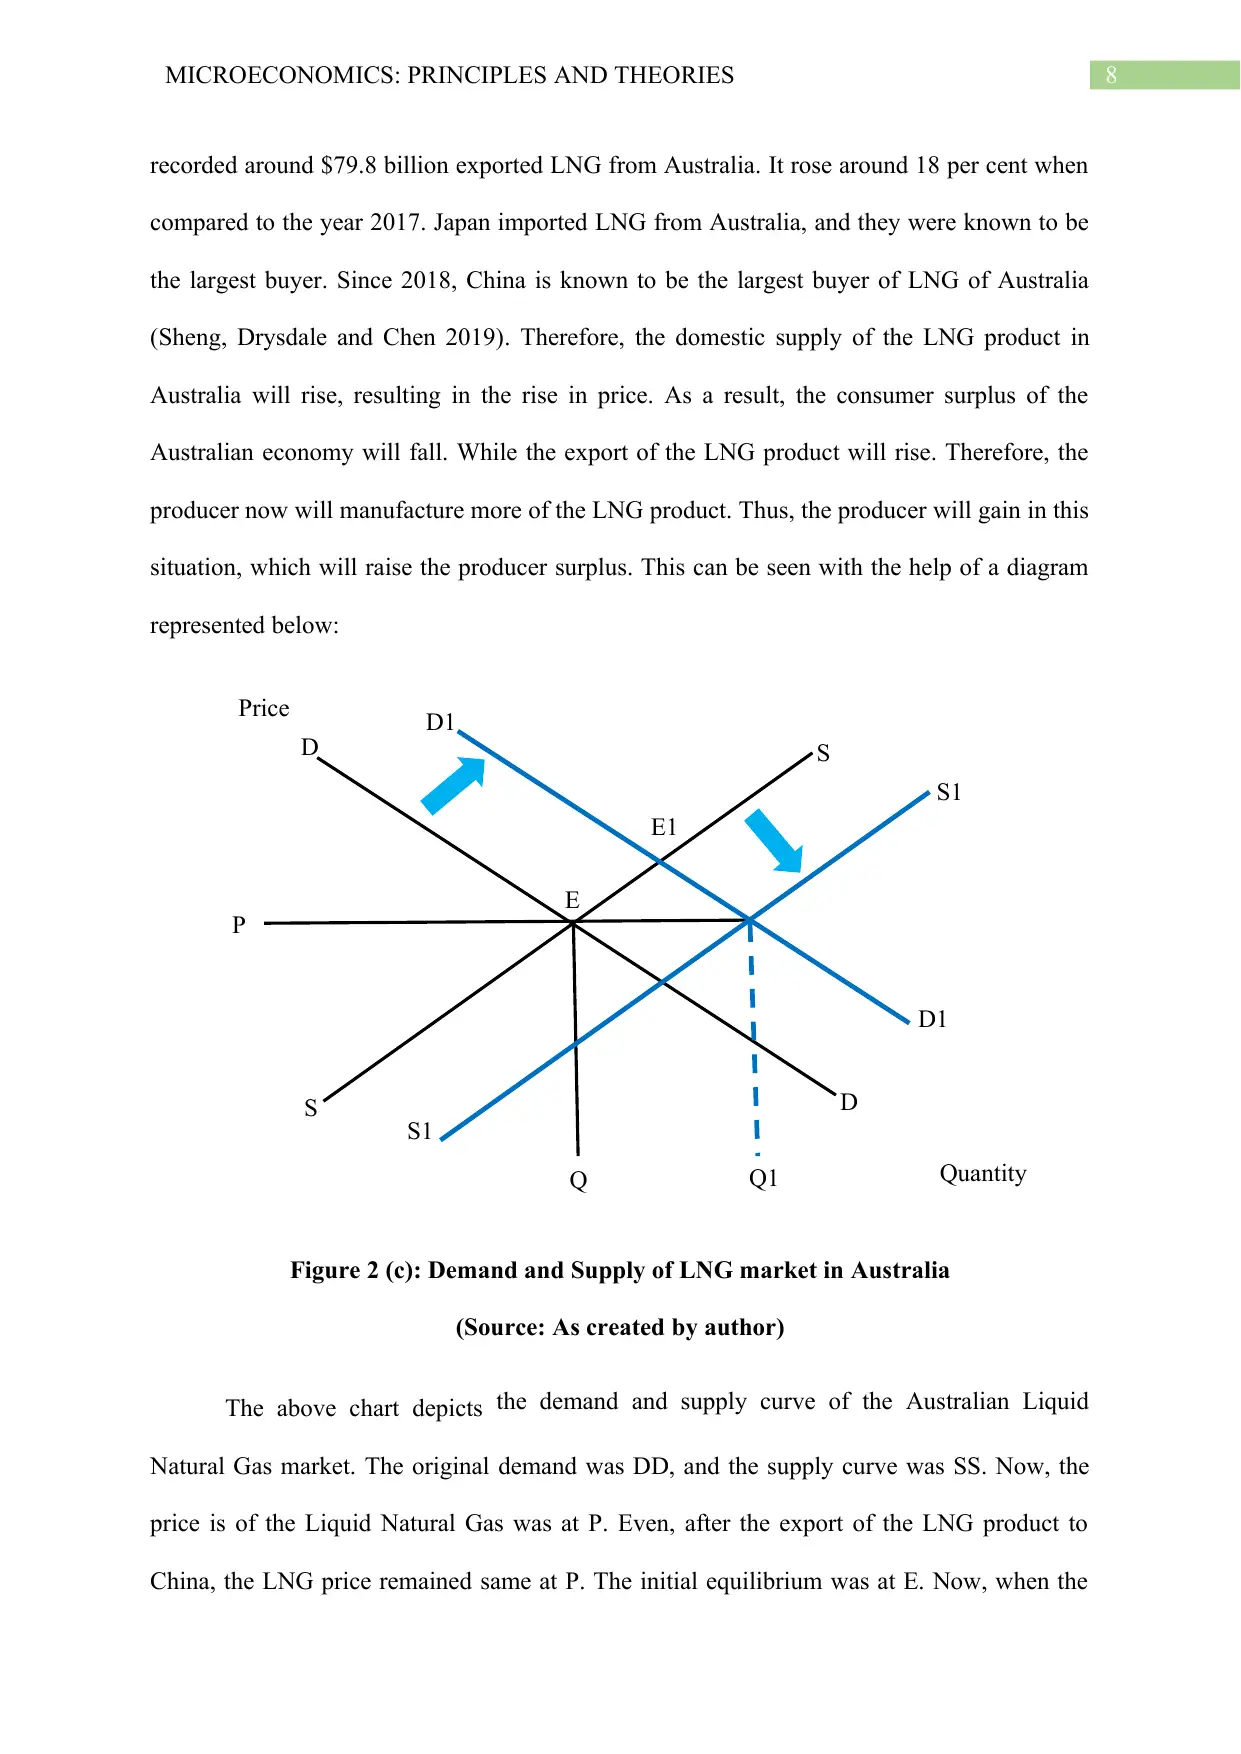
recorded around $79.8 billion exported LNG from Australia. It rose around 18 per cent when
compared to the year 2017. Japan imported LNG from Australia, and they were known to be
the largest buyer. Since 2018, China is known to be the largest buyer of LNG of Australia
(Sheng, Drysdale and Chen 2019). Therefore, the domestic supply of the LNG product in
Australia will rise, resulting in the rise in price. As a result, the consumer surplus of the
Australian economy will fall. While the export of the LNG product will rise. Therefore, the
producer now will manufacture more of the LNG product. Thus, the producer will gain in this
situation, which will raise the producer surplus. This can be seen with the help of a diagram
represented below:
Figure 2 (c): Demand and Supply of LNG market in Australia
(Source: As created by author)
The above chart depicts the demand and supply curve of the Australian Liquid
Natural Gas market. The original demand was DD, and the supply curve was SS. Now, the
price is of the Liquid Natural Gas was at P. Even, after the export of the LNG product to
China, the LNG price remained same at P. The initial equilibrium was at E. Now, when the
S
S D
D D1
D1
E
E1
Price
QuantityQ Q1
P
S1
S1
recorded around $79.8 billion exported LNG from Australia. It rose around 18 per cent when
compared to the year 2017. Japan imported LNG from Australia, and they were known to be
the largest buyer. Since 2018, China is known to be the largest buyer of LNG of Australia
(Sheng, Drysdale and Chen 2019). Therefore, the domestic supply of the LNG product in
Australia will rise, resulting in the rise in price. As a result, the consumer surplus of the
Australian economy will fall. While the export of the LNG product will rise. Therefore, the
producer now will manufacture more of the LNG product. Thus, the producer will gain in this
situation, which will raise the producer surplus. This can be seen with the help of a diagram
represented below:
Figure 2 (c): Demand and Supply of LNG market in Australia
(Source: As created by author)
The above chart depicts the demand and supply curve of the Australian Liquid
Natural Gas market. The original demand was DD, and the supply curve was SS. Now, the
price is of the Liquid Natural Gas was at P. Even, after the export of the LNG product to
China, the LNG price remained same at P. The initial equilibrium was at E. Now, when the
⊘ This is a preview!⊘
Do you want full access?
Subscribe today to unlock all pages.
Trusted by 1+ million students worldwide
9MICROECONOMICS: PRINCIPLES AND THEORIES
export of the mentioned good pushes up the demand of the good rises in the importing
country. This results in the rightward movement in the demand curve (Feenstra 2015).
Though, the supply of the product of LNG decreases in the domestic market but rises in the
international market. Thus, there is a change in the position of the supply curve. The supply
curve moves from SS to its right that is S1S1.
The equilibrium of the product also changes to E1. Even the price remained the same,
the quantity demanded and supplied changed from Q to Q1. Thus, the producer in the country
Australia is experiencing a high producer surplus but low consumer surplus due to the trade
war, which is going amid the United States and China recently. Ultimately, Australia is
gaining due to the situation stated above.
Paraphrase This Document
Need a fresh take? Get an instant paraphrase of this document with our AI Paraphraser
10MICROECONOMICS: PRINCIPLES AND THEORIES
References
AFR.com 2019. The trade war is making China more reliant on Australia. [online]
Australian Financial Review. Available at: https://www.afr.com/companies/energy/the-trade-
war-is-making-china-more-reliant-on-australia-20190814-p52gyn [Accessed 4 Oct. 2019].
BBC.com 2019. US-China trade war in 300 words. [online] BBC News. Available at:
https://www.bbc.com/news/business-45899310 [Accessed 4 Oct. 2019].
Feenstra, R.C., 2015. Advanced international trade: theory and evidence. Princeton
university press.
Felbermayr, G., Jung, B. and Larch, M., 2015. The welfare consequences of import tariffs: A
quantitative perspective. Journal of International Economics, 97(2), pp.295-309.
Gordon, B.R., Goldfarb, A. and Li, Y., 2013. Does price elasticity vary with economic
growth? A cross-category analysis. Journal of Marketing Research, 50(1), pp.4-23.
Pindyck, R.S. and Rubinfeld, D.L., 2015. Microeconomics. Boston: Pearson,.
Sheng, Y., Drysdale, P. and Chen, C., 2019. Economic Growth In China And Its Potential
Impact On Australia–China Bilateral Trade: A Projection For 2025 Based On The Cge
Analysis. The Singapore Economic Review, 64(04), pp.839-862.
Swanson, A., 2018. US and China Expand Trade War as Beijing Matches Trumpʼs Tariffs.
Worldbank.org 2019. [online] Siteresources.worldbank.org. Available at:
http://siteresources.worldbank.org/CGCSRLP/Resources/SIPACSRFINALREPORT.doc
[Accessed 4 Oct. 2019].

11MICROECONOMICS: PRINCIPLES AND THEORIES
WSJ 2019. Cemex Thrives by Selling CementTo Mexico's Poor a Bag at a Time. [online]
WSJ. Available at: https://www.wsj.com/articles/SB1019426769244153760 [Accessed 4 Oct.
2019].
WSJ 2019. Cemex Thrives by Selling CementTo Mexico's Poor a Bag at a Time. [online]
WSJ. Available at: https://www.wsj.com/articles/SB1019426769244153760 [Accessed 4 Oct.
2019].
⊘ This is a preview!⊘
Do you want full access?
Subscribe today to unlock all pages.
Trusted by 1+ million students worldwide
1 out of 12
Related Documents


Your All-in-One AI-Powered Toolkit for Academic Success.
+13062052269
info@desklib.com
Available 24*7 on WhatsApp / Email
![[object Object]](/_next/static/media/star-bottom.7253800d.svg)
Unlock your academic potential
Copyright © 2020–2026 A2Z Services. All Rights Reserved. Developed and managed by ZUCOL.