Microeconomics Project: Opportunity Cost and PPF Analysis
VerifiedAdded on 2022/09/13
|12
|2514
|33
Project
AI Summary
This project applies microeconomic principles to a business scenario focusing on the production of coffee and dates in Saudi Arabia. It begins with an executive summary and introduction to the market dynamics of these two products, including their growth and market perspective. The project then delves into the concept of opportunity cost, explaining explicit and implicit costs and their role in production decisions, with calculations of economic and accounting profit. The analysis extends to the application of the Production Possibility Frontier (PPF) to illustrate the trade-offs in resource allocation between coffee and date production. Finally, it examines consumer behavior, particularly the impact of price changes and taxes on coffee demand, calculating price elasticity and its implications on revenue. The project utilizes tables and a figure to visualize the data and concepts discussed, providing a comprehensive understanding of microeconomic principles in a practical context.
Running head: PRINCIPLE OF MICROECONOMICS
Principle of Microeconomics
Name of the Student
Name of the University
Author Note
Principle of Microeconomics
Name of the Student
Name of the University
Author Note
Paraphrase This Document
Need a fresh take? Get an instant paraphrase of this document with our AI Paraphraser
1PRINCIPLE OF MICROECONOMICS
Executive Summary
The objective of the study is to discuss the concept of the Production Possibility Frontier (PPF)
considering two products date and coffee in Saudi Arabia. These two are investigated as normal
goods implying that increasing price reduces consumer demand. Meanwhile, the paper explains
briefly the functions of the opportunity cost, explicit cost, implicit cost, economic profit and
accounting profit during the course of taking the production decision. Furthermore, it
incorporates mathematical conclusion to analyze the consumer’s behavior.
2PRINCIPLE OF MICROECONOMICS
Table of Contents
First: Introduction............................................................................................................................4
Second: Apply the concept of opportunity cost...............................................................................5
Third: Application of PPF...............................................................................................................7
Fourth: Consumers’ behavior..........................................................................................................9
Reference list.................................................................................................................................11
⊘ This is a preview!⊘
Do you want full access?
Subscribe today to unlock all pages.
Trusted by 1+ million students worldwide
3PRINCIPLE OF MICROECONOMICS
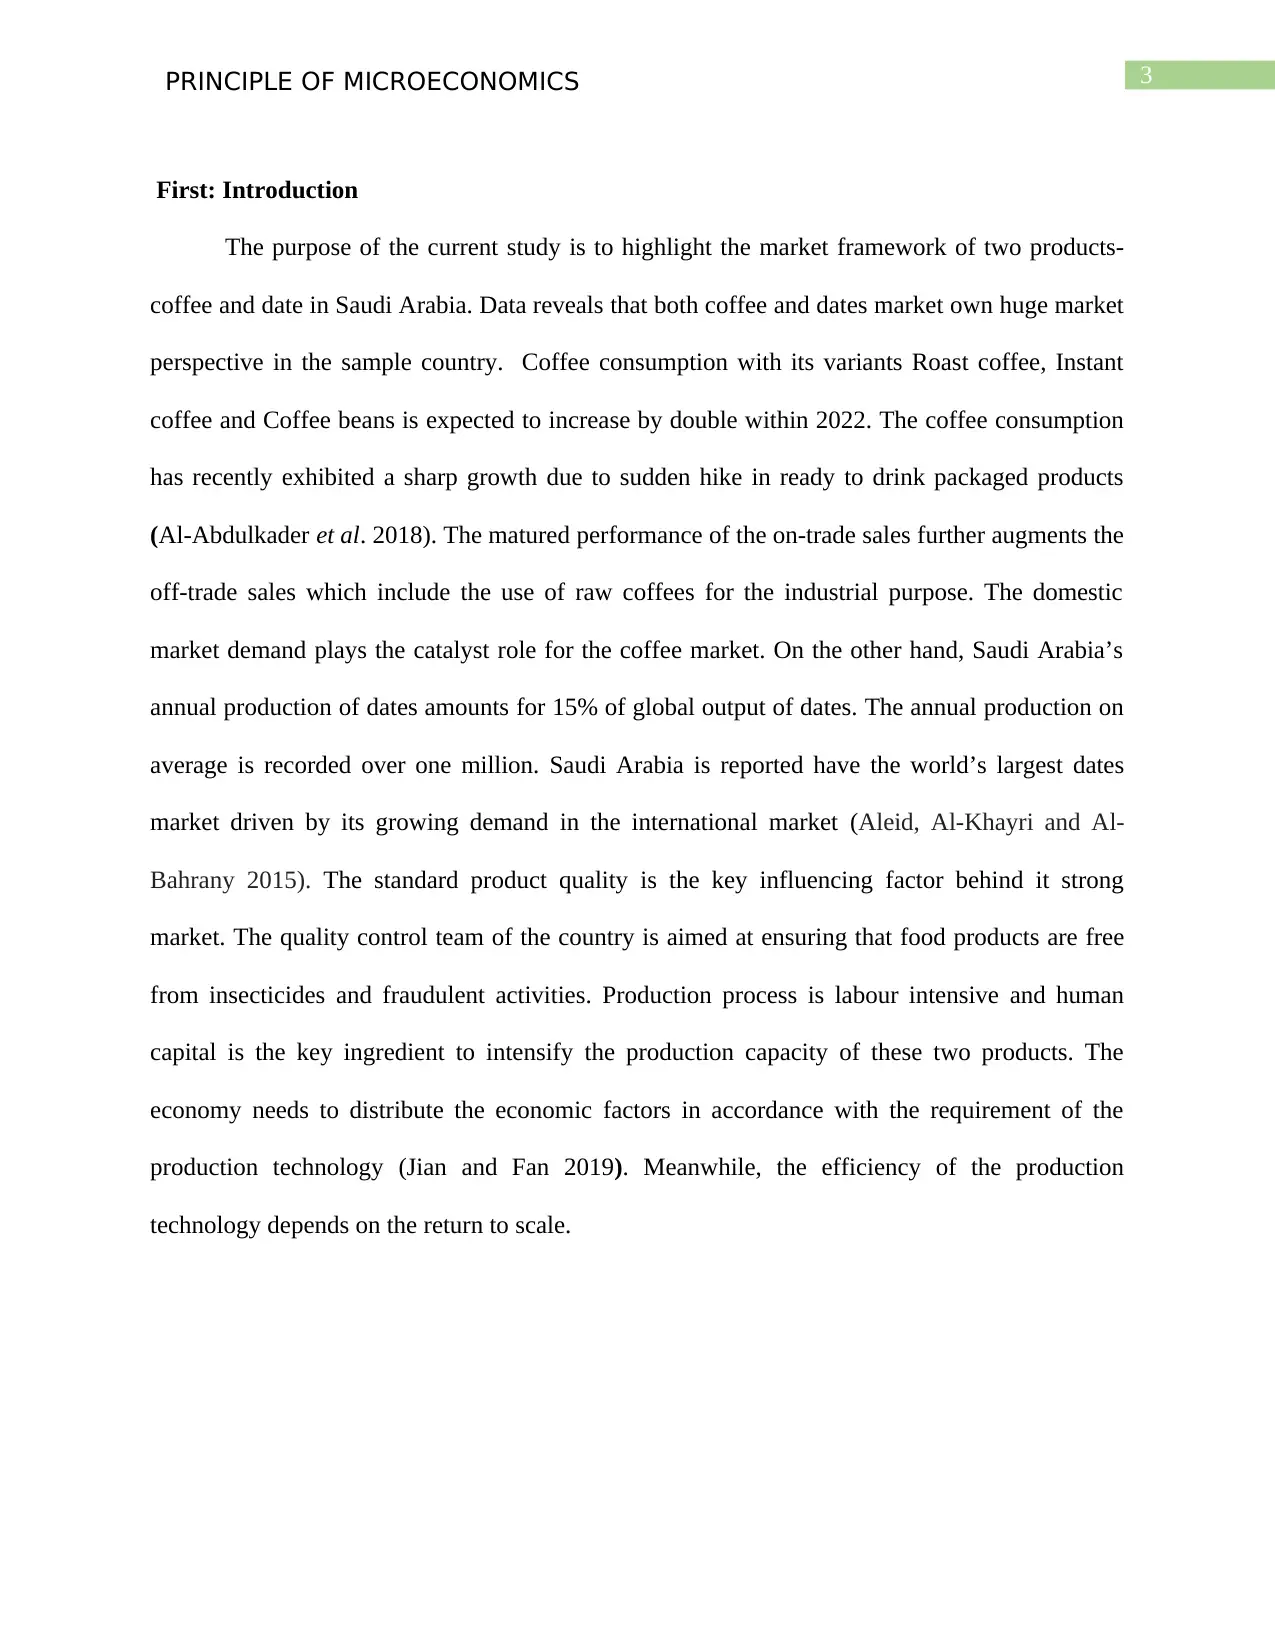
First: Introduction
The purpose of the current study is to highlight the market framework of two products-
coffee and date in Saudi Arabia. Data reveals that both coffee and dates market own huge market
perspective in the sample country. Coffee consumption with its variants Roast coffee, Instant
coffee and Coffee beans is expected to increase by double within 2022. The coffee consumption
has recently exhibited a sharp growth due to sudden hike in ready to drink packaged products
(Al-Abdulkader et al. 2018). The matured performance of the on-trade sales further augments the
off-trade sales which include the use of raw coffees for the industrial purpose. The domestic
market demand plays the catalyst role for the coffee market. On the other hand, Saudi Arabia’s
annual production of dates amounts for 15% of global output of dates. The annual production on
average is recorded over one million. Saudi Arabia is reported have the world’s largest dates
market driven by its growing demand in the international market (Aleid, Al-Khayri and Al-
Bahrany 2015). The standard product quality is the key influencing factor behind it strong
market. The quality control team of the country is aimed at ensuring that food products are free
from insecticides and fraudulent activities. Production process is labour intensive and human
capital is the key ingredient to intensify the production capacity of these two products. The
economy needs to distribute the economic factors in accordance with the requirement of the
production technology (Jian and Fan 2019). Meanwhile, the efficiency of the production
technology depends on the return to scale.
Paraphrase This Document
Need a fresh take? Get an instant paraphrase of this document with our AI Paraphraser
4PRINCIPLE OF MICROECONOMICS
Second: Apply the concept of opportunity cost
Factors used in the production of the sample products are limited. The consumption of
the economic factors cannot be continued for an indefinite period. From the producer’s
perspective, the capital is limited. Capital determines the financial strength of the producers.
Similarly, labor supply can be extended to a certain level (Assirey 2015). Henceforth, the
producers need to decide production of which good will derive the maximum profit. On the basis
of that, the producer will allocate the input resources into the production process. Suppose a
country produces two goods, such that, dates and coffee. In this regard, a producer can apply the
concept of opportunity cost including explicit and implicit cost to select an appropriate
production strategy (Lin, Che and Lo 2014). The following five decisions a producer can adopt
from the production aspect.
First, scarcity is the fundamental concept of the opportunity cost. The amount is compromised by
an individual to gain something, is referred as the opportunity cost (Krosch and Amodio 2014).
The economy needs to select between the alternatives (dates and coffee) while deciding how it
should expense for these two products. Milton Friedman, the Nobel laureate economist, suggests
that a trade-off is the integral part of the production decision. The economy would prefer to
invest economic resources into the coffee production if its opportunity cost is comparatively less
(Fiore, Contò and Pellegrini 2015).
Second, opportunity cost determines the comparative advantageous position of the economy. It
can be asserted that the economy will have the comparative advantageous position if the product
owns highest opportunity cost. As Saudi Arabia is naturally in advantageous position in the date
production, the economy will incur high opportunity cost if it emphasizes on the coffee
production rather than on the dates.
5PRINCIPLE OF MICROECONOMICS
Third, the degree of the opportunity cost needs to be measured by the explicit and implicit cost.
Explicit cost is identified as those payments which are already incurred (Polley 2015). For
example, wages paid for the employees and rental payment as a part of the establishment cost.
On the contrary, the implicit cost represents the cost of the resources consumed by the firms
including the depreciation expenditure related to the materials, equipment and products.
For instance, let us assume that the coffee producer expected to earn $100,000 per annum after
the full establishment. The producer needs to hire labor and a property to continue its production
process. In that case, the rental fee is $20,000 per year and annual cost of $10,000 is dedicated
for the employment expenditure. Henceforth, explicit cost can be explained as
Explicit cost = official rent + wage = $20,000 + $10,000 = $ 30,000.
Now, the producer wants to endeavor new business in the dates. In this case, some resources
need to be shifted from the coffee production to the date production, which in turn, causes
machinery depression cost of $50,000. This depression cost will be accounted as implicit cost. In
this regard, it is important to note that loss related to the leisure of employees is also counted
under the implicit cost.
Fourth, economic profit is significant parameter to determine the opportunity cost of the
producer (Dudin et al. 2018). Economic profit is measured by the subtraction of the total cost
including explicit and implicit cost from total revenue.
Therefore, economic profit = total revenue – explicit cost – implicit cost = $100,000 - $30,000 -
$50,000 = $20,000
Fifth, apart from the economic profit, accounting profit is another important aspect to measure
the opportunity. It illustrates the cash concept. The difference between total revenue and explicit
⊘ This is a preview!⊘
Do you want full access?
Subscribe today to unlock all pages.
Trusted by 1+ million students worldwide
6PRINCIPLE OF MICROECONOMICS
cost is equal to the accounting profit (Levy 2014). A producer pays the income tax depending on
the accounting profit. However, economic profit is the key indicator to measure the economic
success of the firm. Hence, accounting profit = revenues – explicit cost = $100,000-$30,000 =
$70,000.
Third: Application of PPF
Table 1: Production of Coffee and Dates
Coffee production (number
per year)
Dates production (number per
year)
0.00 100000.00
1000.00 90000.00
2000.00 70000.00
3000.00 50000.00
4000.00 0.00
Source: (as created by the author)
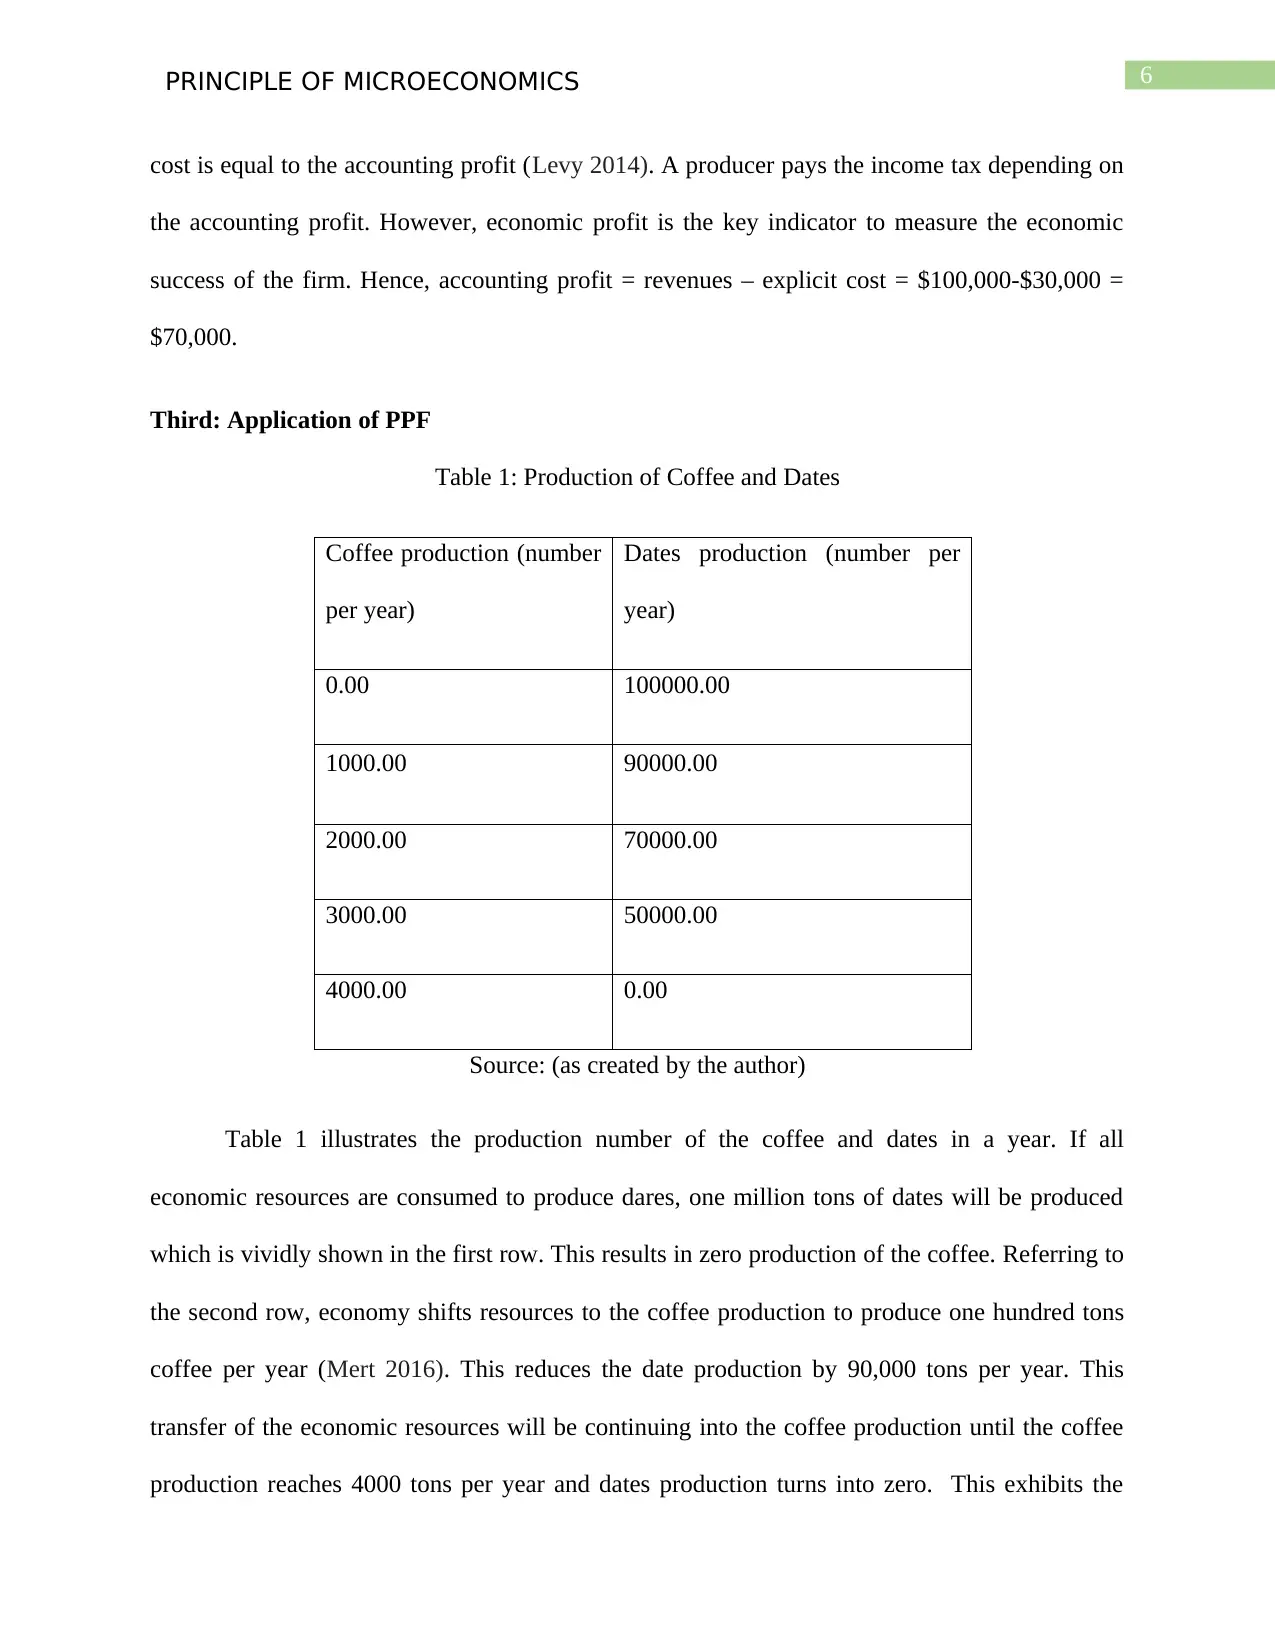
Table 1 illustrates the production number of the coffee and dates in a year. If all
economic resources are consumed to produce dares, one million tons of dates will be produced
which is vividly shown in the first row. This results in zero production of the coffee. Referring to
the second row, economy shifts resources to the coffee production to produce one hundred tons
coffee per year (Mert 2016). This reduces the date production by 90,000 tons per year. This
transfer of the economic resources will be continuing into the coffee production until the coffee
production reaches 4000 tons per year and dates production turns into zero. This exhibits the
cost is equal to the accounting profit (Levy 2014). A producer pays the income tax depending on
the accounting profit. However, economic profit is the key indicator to measure the economic
success of the firm. Hence, accounting profit = revenues – explicit cost = $100,000-$30,000 =
$70,000.
Third: Application of PPF
Table 1: Production of Coffee and Dates
Coffee production (number
per year)
Dates production (number per
year)
0.00 100000.00
1000.00 90000.00
2000.00 70000.00
3000.00 50000.00
4000.00 0.00
Source: (as created by the author)
Table 1 illustrates the production number of the coffee and dates in a year. If all
economic resources are consumed to produce dares, one million tons of dates will be produced
which is vividly shown in the first row. This results in zero production of the coffee. Referring to
the second row, economy shifts resources to the coffee production to produce one hundred tons
coffee per year (Mert 2016). This reduces the date production by 90,000 tons per year. This
transfer of the economic resources will be continuing into the coffee production until the coffee
production reaches 4000 tons per year and dates production turns into zero. This exhibits the
Paraphrase This Document
Need a fresh take? Get an instant paraphrase of this document with our AI Paraphraser
7PRINCIPLE OF MICROECONOMICS
trade-off between coffee and date (Almubidin 2019). This different set of the production amount
can be plotted into a curve which is termed Production Possibility Frontier (PPF).
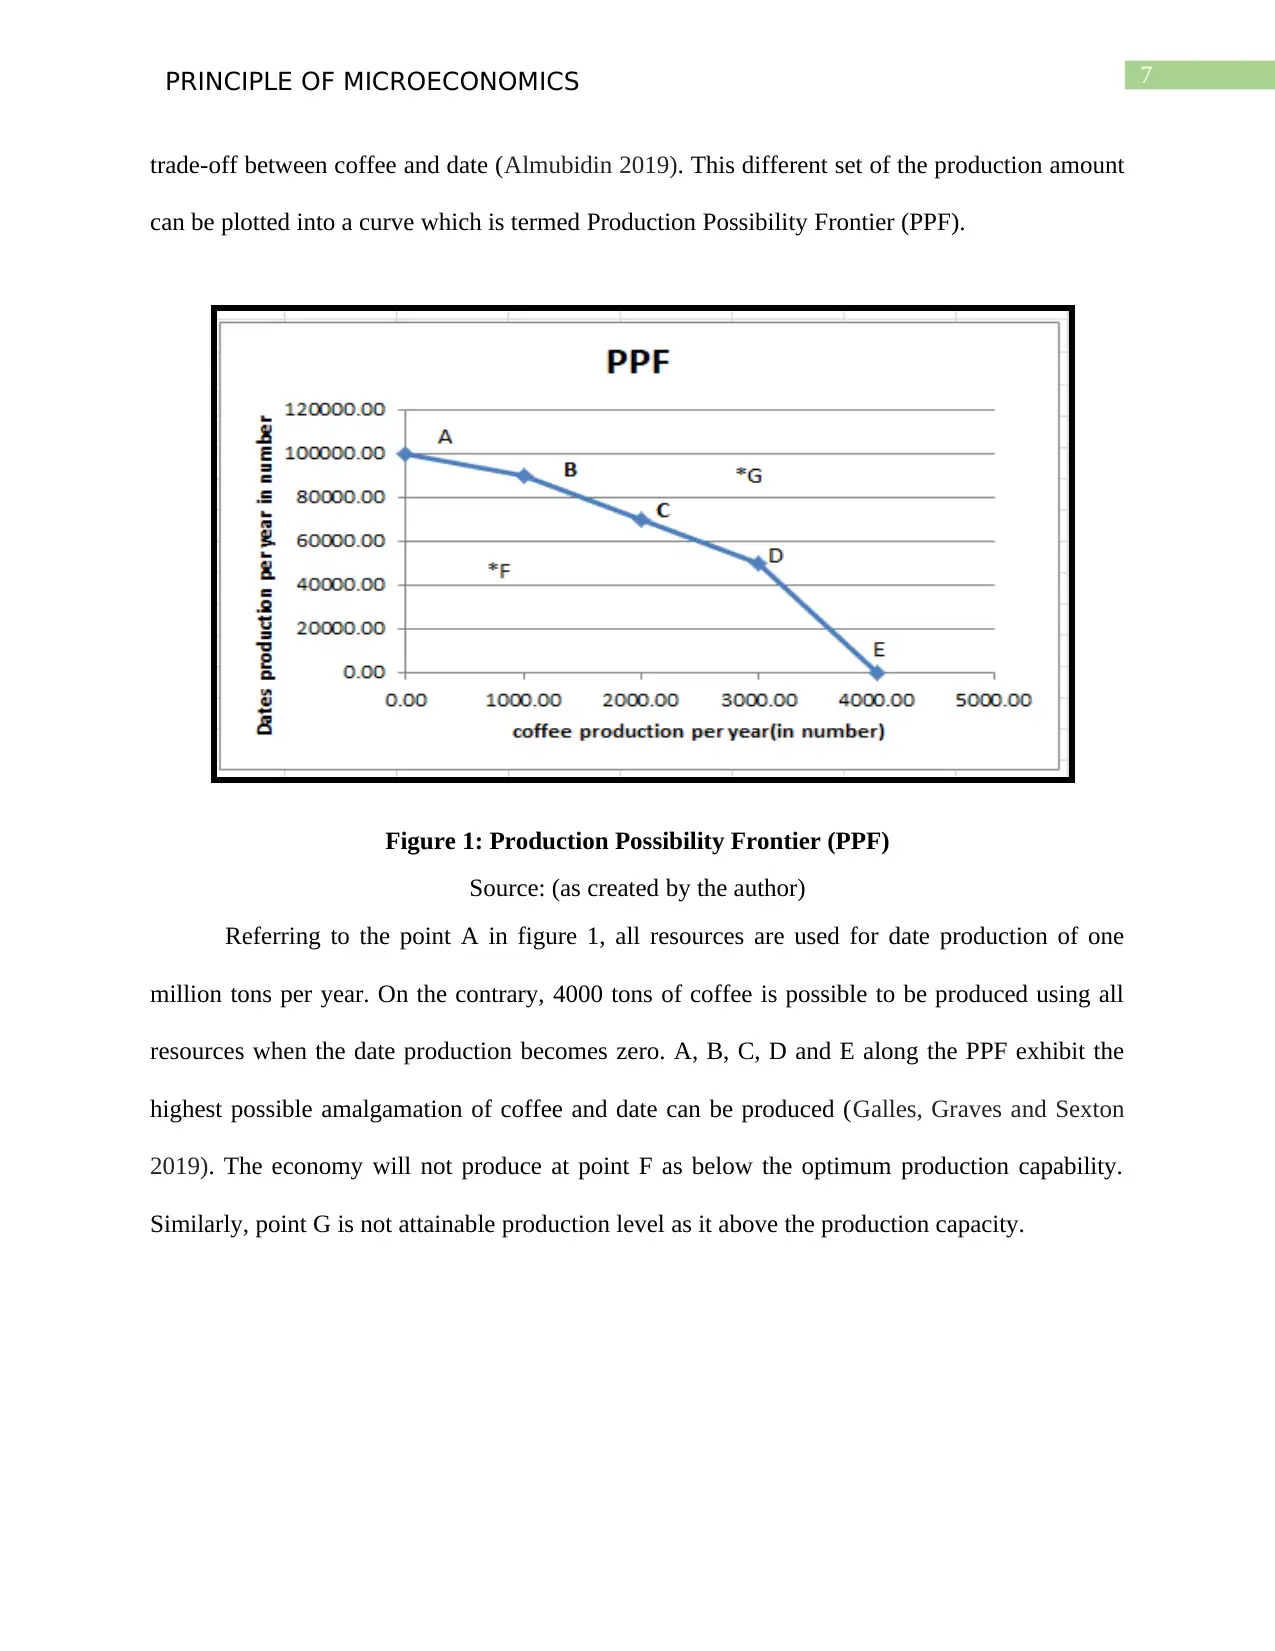
Figure 1: Production Possibility Frontier (PPF)
Source: (as created by the author)
Referring to the point A in figure 1, all resources are used for date production of one
million tons per year. On the contrary, 4000 tons of coffee is possible to be produced using all
resources when the date production becomes zero. A, B, C, D and E along the PPF exhibit the
highest possible amalgamation of coffee and date can be produced (Galles, Graves and Sexton
2019). The economy will not produce at point F as below the optimum production capability.
Similarly, point G is not attainable production level as it above the production capacity.
trade-off between coffee and date (Almubidin 2019). This different set of the production amount
can be plotted into a curve which is termed Production Possibility Frontier (PPF).
Figure 1: Production Possibility Frontier (PPF)
Source: (as created by the author)
Referring to the point A in figure 1, all resources are used for date production of one
million tons per year. On the contrary, 4000 tons of coffee is possible to be produced using all
resources when the date production becomes zero. A, B, C, D and E along the PPF exhibit the
highest possible amalgamation of coffee and date can be produced (Galles, Graves and Sexton
2019). The economy will not produce at point F as below the optimum production capability.
Similarly, point G is not attainable production level as it above the production capacity.
8PRINCIPLE OF MICROECONOMICS
Fourth: Consumers’ behavior
1.
Original After value-added tax
(10%)
Quantity
(in tons)
50 40
Price
(in
dollar)
100 110
Source: (as created by the author)
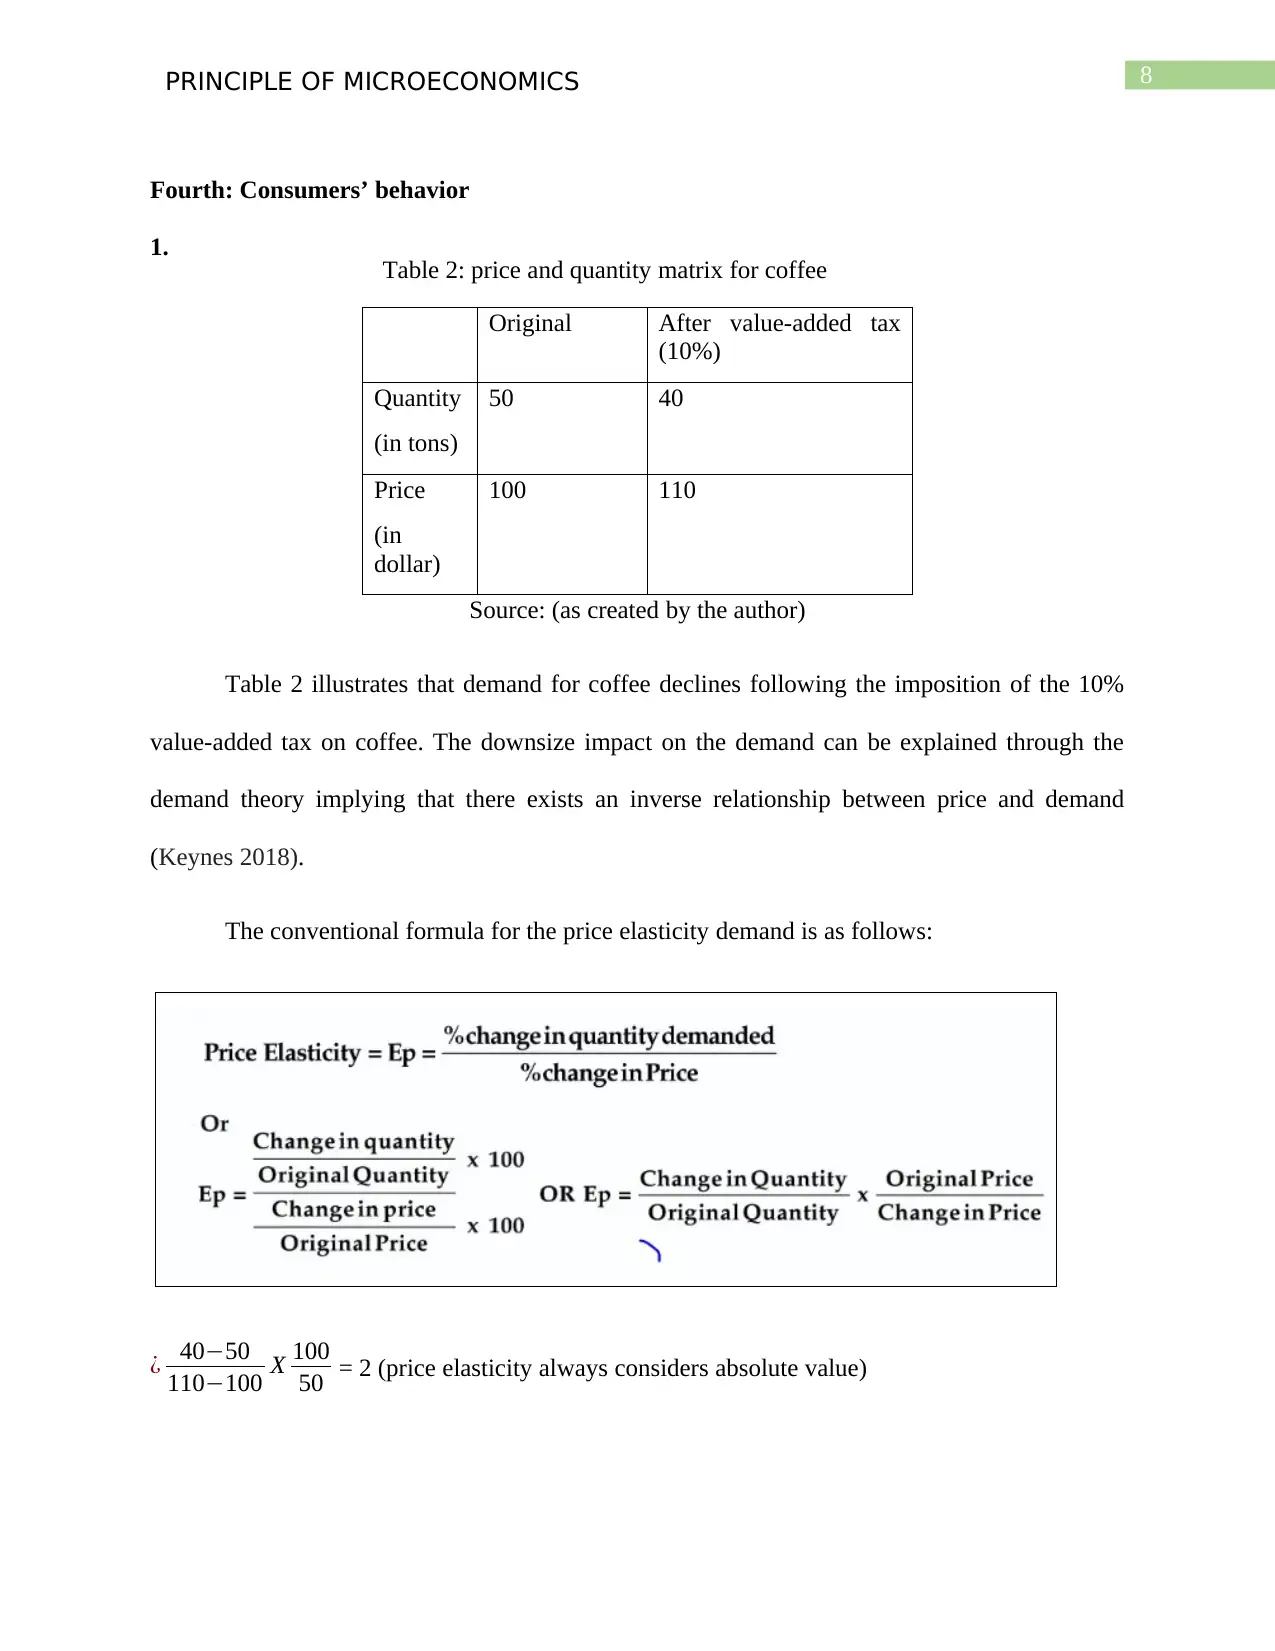
Table 2 illustrates that demand for coffee declines following the imposition of the 10%
value-added tax on coffee. The downsize impact on the demand can be explained through the
demand theory implying that there exists an inverse relationship between price and demand
(Keynes 2018).
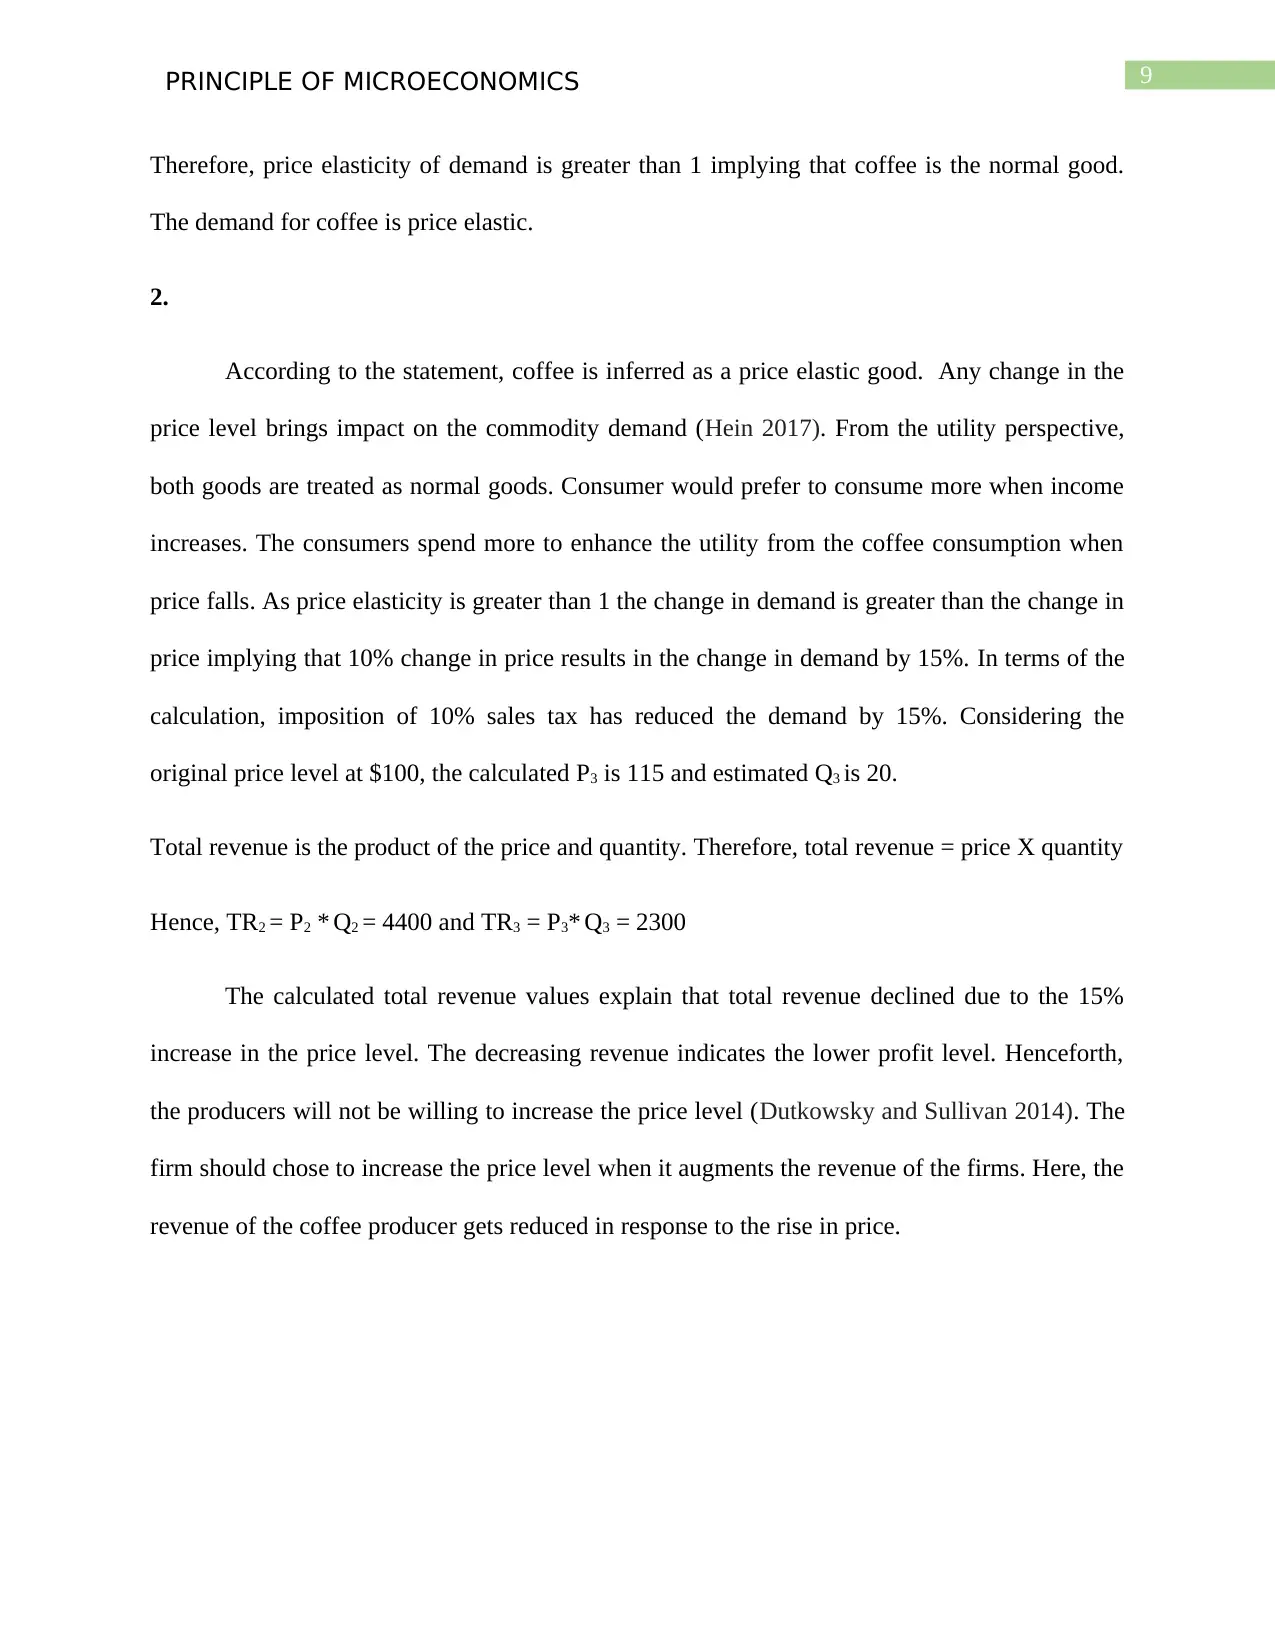
The conventional formula for the price elasticity demand is as follows:
¿ 40−50
110−100 X 100
50 = 2 (price elasticity always considers absolute value)
Table 2: price and quantity matrix for coffee
Fourth: Consumers’ behavior
1.
Original After value-added tax
(10%)
Quantity
(in tons)
50 40
Price
(in
dollar)
100 110
Source: (as created by the author)
Table 2 illustrates that demand for coffee declines following the imposition of the 10%
value-added tax on coffee. The downsize impact on the demand can be explained through the
demand theory implying that there exists an inverse relationship between price and demand
(Keynes 2018).
The conventional formula for the price elasticity demand is as follows:
¿ 40−50
110−100 X 100
50 = 2 (price elasticity always considers absolute value)
Table 2: price and quantity matrix for coffee
⊘ This is a preview!⊘
Do you want full access?
Subscribe today to unlock all pages.
Trusted by 1+ million students worldwide
9PRINCIPLE OF MICROECONOMICS
Therefore, price elasticity of demand is greater than 1 implying that coffee is the normal good.
The demand for coffee is price elastic.
2.
According to the statement, coffee is inferred as a price elastic good. Any change in the
price level brings impact on the commodity demand (Hein 2017). From the utility perspective,
both goods are treated as normal goods. Consumer would prefer to consume more when income
increases. The consumers spend more to enhance the utility from the coffee consumption when
price falls. As price elasticity is greater than 1 the change in demand is greater than the change in
price implying that 10% change in price results in the change in demand by 15%. In terms of the
calculation, imposition of 10% sales tax has reduced the demand by 15%. Considering the
original price level at $100, the calculated P3 is 115 and estimated Q3 is 20.
Total revenue is the product of the price and quantity. Therefore, total revenue = price X quantity
Hence, TR2 = P2 * Q2 = 4400 and TR3 = P3* Q3 = 2300
The calculated total revenue values explain that total revenue declined due to the 15%
increase in the price level. The decreasing revenue indicates the lower profit level. Henceforth,
the producers will not be willing to increase the price level (Dutkowsky and Sullivan 2014). The
firm should chose to increase the price level when it augments the revenue of the firms. Here, the
revenue of the coffee producer gets reduced in response to the rise in price.
Paraphrase This Document
Need a fresh take? Get an instant paraphrase of this document with our AI Paraphraser
10PRINCIPLE OF MICROECONOMICS
Reference list
Al-Abdulkader, A.M., Al-Namazi, A.A., AlTurki, T.A., Al-Khuraish, M.M. and Al-Dakhil, A.I.,
2018. Optimizing coffee cultivation and its impact on economic growth and export earnings of
the producing countries: the case of Saudi Arabia. Saudi journal of biological sciences, 25(4),
pp.776-782.
Aleid, S.M., Al-Khayri, J.M. and Al-Bahrany, A.M., 2015. Date palm status and perspective in
Saudi Arabia. In Date palm genetic resources and utilization (pp. 49-95). Springer, Dordrecht.
Almubidin, S., 2019. Production Possibility Frontier & its Relation to Other Costs. International
Journal of Tax Economics and Management.
Assirey, E.A.R., 2015. Nutritional composition of fruit of 10 date palm (Phoenix dactylifera L.)
cultivars grown in Saudi Arabia. Journal of Taibah University for science, 9(1), pp.75-79.
Dudin, M.N., Lyasnikov, N.V., Reshetov, K.Y., Smirnova, O.O. and Vysotskaya, N.V., 2018.
Economic profit as indicator of food retailing enterprises’ performance.
Dutkowsky, D.H. and Sullivan, R.S., 2014. Excise taxes, consumer demand, over‐shifting, and
tax revenue. Public Budgeting & Finance, 34(3), pp.111-125.
Fiore, M., Contò, F. and Pellegrini, G., 2015. Reducing food losses: A (dis)-opportunity cost
model. RIVISTA DI STUDI SULLA SOSTENIBILITA'.
Galles, G.M., Graves, P.E. and Sexton, R.L., 2019. Leisure and the Production Possibility
Frontier: A Two-Step Pedagogy. The American Economist, 64(1), pp.123-130.
Hein, E., 2017. The principle of effective demand: Marx, Kalecki, Keynes, and beyond. In The
Routledge Handbook of Heterodox Economics (pp. 84-100). Routledge.
11PRINCIPLE OF MICROECONOMICS
Jiang, W. and Fan, J., 2019, May. Study on Production Possibility Frontier Under Different
Production Function Assumptions. In International Conference on Data Service (pp. 121-131).
Springer, Singapore.
Keynes, J.M., 2018. The principle of effective demand. In The General Theory of Employment,
Interest, and Money (pp. 21-30). Palgrave Macmillan, Cham.
Krosch, A.R. and Amodio, D.M., 2014. Economic scarcity alters the perception of
race. Proceedings of the National Academy of Sciences, 111(25), pp.9079-9084.
Levy, J., 2014. Accounting for Profit and the History of Capital. Critical Historical Studies, 1(2),
pp.171-214.
Lin, F.J., Chen, Y.M. and Lo, F.Y., 2014. The persistence of economic profit. International
Entrepreneurship and Management Journal, 10(4), pp.767-780.
Mert, M., 2016. A Note on the Relationship among the Shape of the Production Possibility
Frontier,‘Returns to Scale’and ‘Returns to Factors’ under Cobb–Douglas Production
Function. Studies in Microeconomics, 4(2), pp.173-184.
Polley, W.J., 2015. The rhetoric of opportunity cost. The American Economist, 60(1), pp.9-19.
⊘ This is a preview!⊘
Do you want full access?
Subscribe today to unlock all pages.
Trusted by 1+ million students worldwide
1 out of 12
Related Documents


Your All-in-One AI-Powered Toolkit for Academic Success.
+13062052269
info@desklib.com
Available 24*7 on WhatsApp / Email
![[object Object]](/_next/static/media/star-bottom.7253800d.svg)
Unlock your academic potential
Copyright © 2020–2026 A2Z Services. All Rights Reserved. Developed and managed by ZUCOL.