Microeconomics Assignment: Price, Surplus, and Budget
VerifiedAdded on 2022/09/06
|8
|502
|27
Homework Assignment
AI Summary
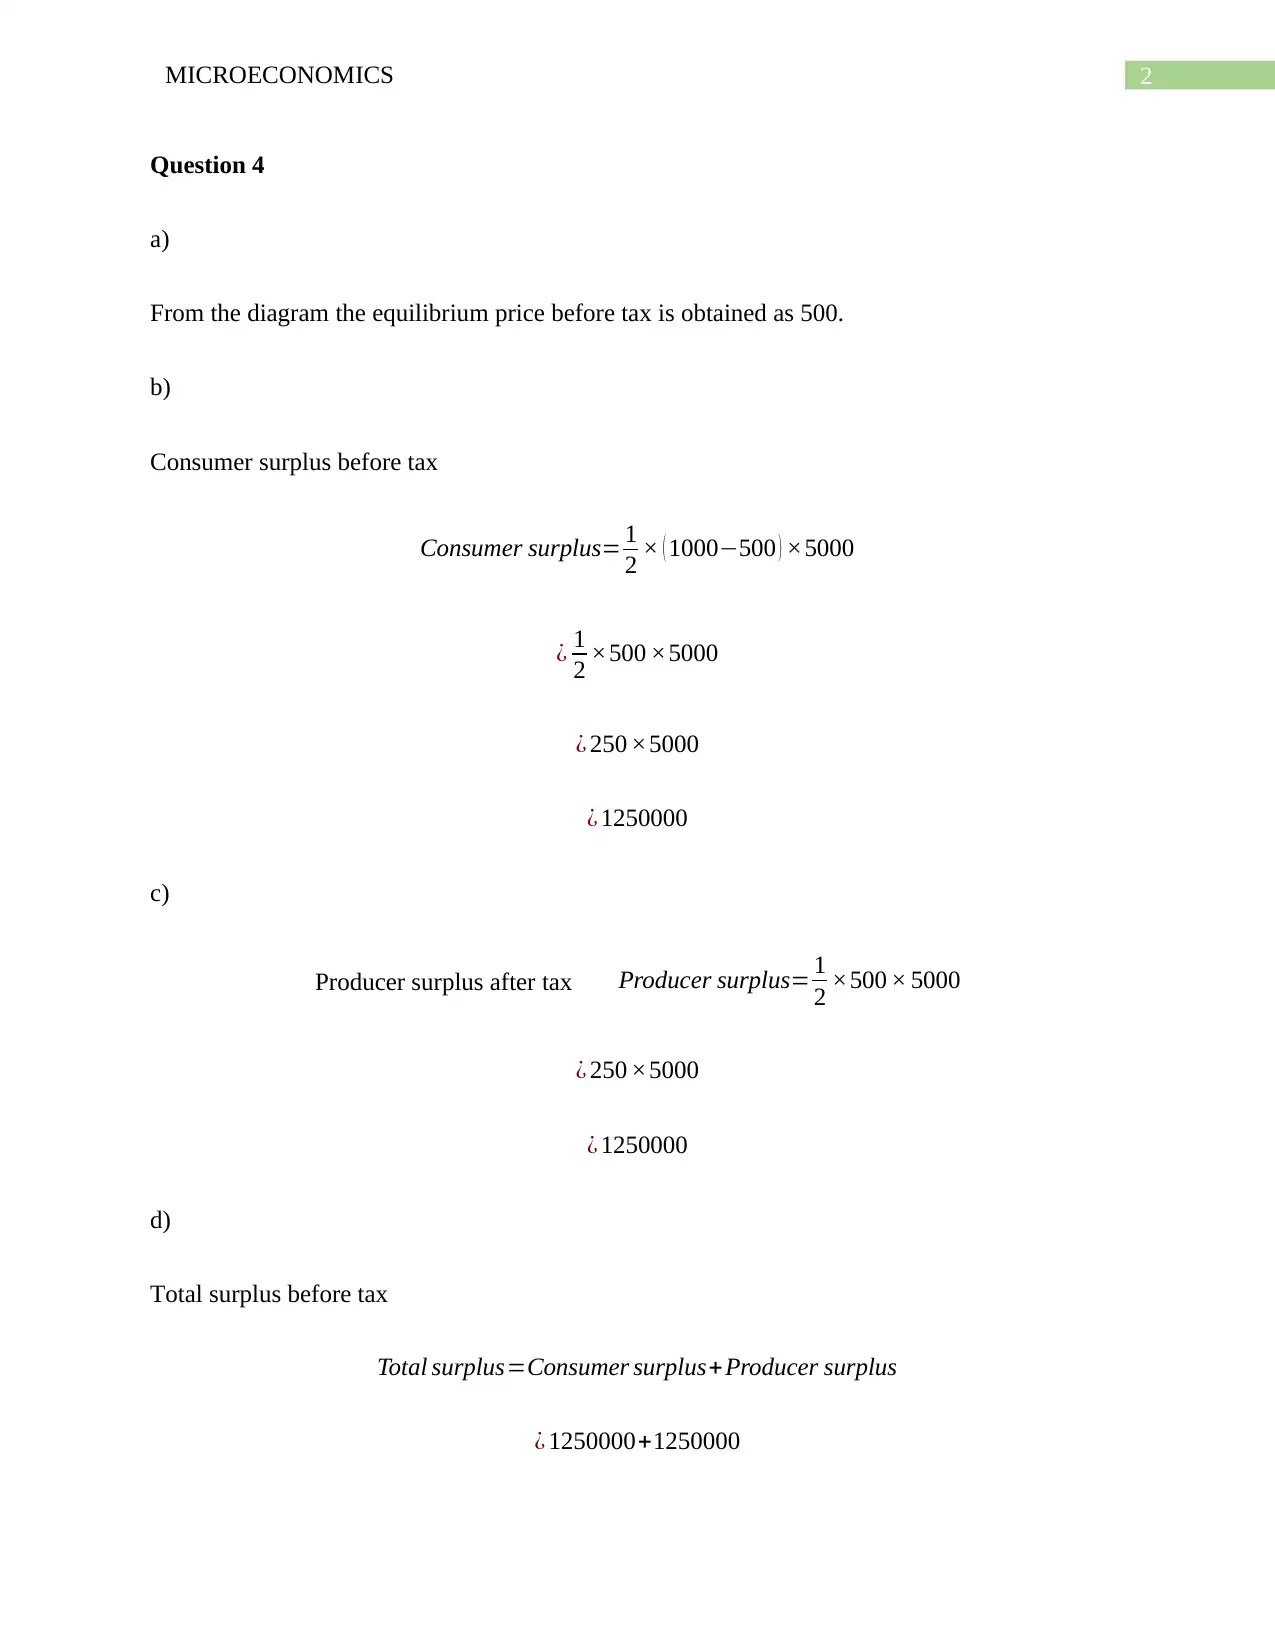
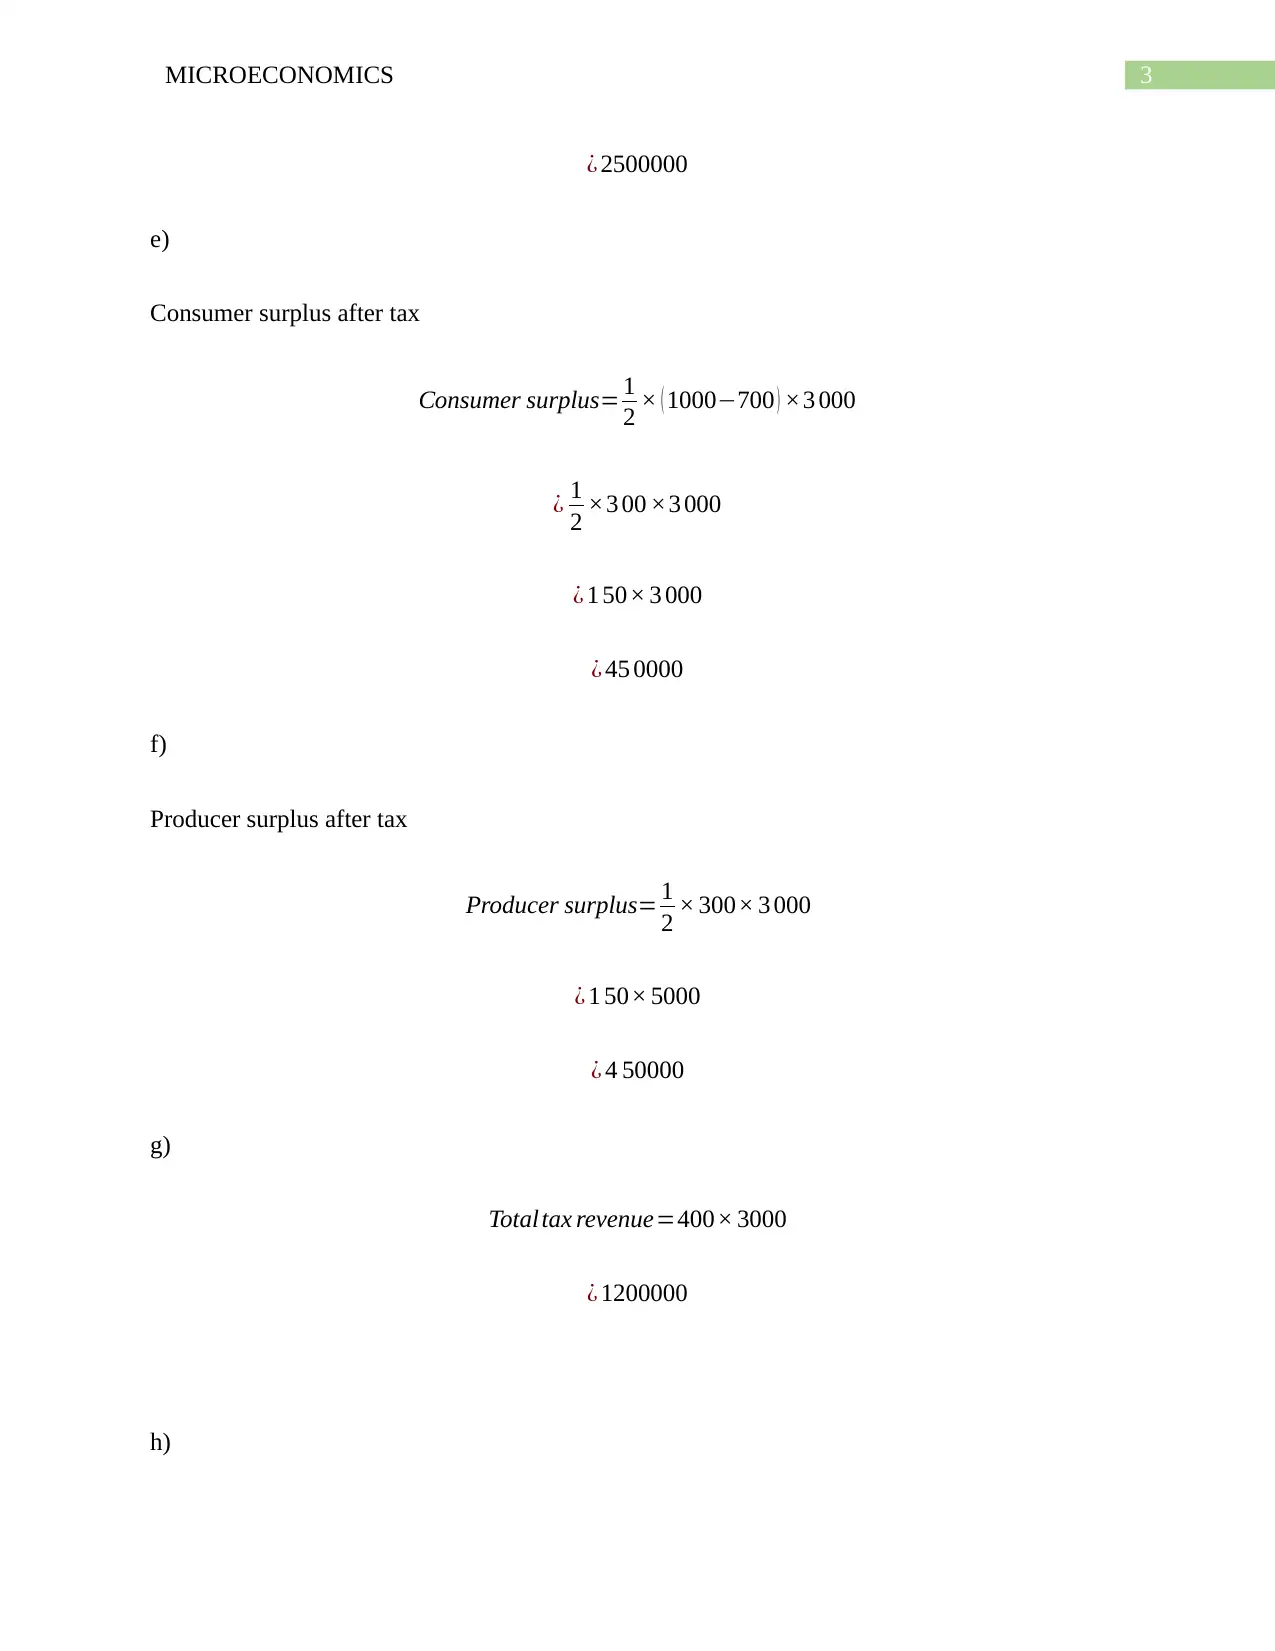
This microeconomics assignment solution addresses several key concepts. It begins with an analysis of market equilibrium, consumer and producer surplus, and the impact of taxes. The solution then explores budget lines and indifference curves, explaining attainable and unattainable consumption points. It examines the relationship between the slope of the budget line and the indifference curve, highlighting the optimal consumption bundle. Finally, the assignment analyzes shifts in the budget line due to changes in income and prices of goods. The solution references relevant economic literature, including works by Cowell, Fine, and Mankiw, to support its analysis.

Running head: MICROECONOMICS
Microeconomics
Name of the Student
Name of the University
Course ID
Microeconomics
Name of the Student
Name of the University
Course ID
Paraphrase This Document
Need a fresh take? Get an instant paraphrase of this document with our AI Paraphraser

1MICROECONOMICS
Table of Contents
Question 4........................................................................................................................................2
Question 8........................................................................................................................................4
Question 7........................................................................................................................................5
References........................................................................................................................................7

2MICROECONOMICS
Question 4
a)
From the diagram the equilibrium price before tax is obtained as 500.
b)
Consumer surplus before tax
Consumer surplus= 1
2 × ( 1000−500 ) ×5000
¿ 1
2 ×500 ×5000
¿ 250 ×5000
¿ 1250000
c)
Producer surplus after tax Producer surplus= 1
2 ×500 × 5000
¿ 250 ×5000
¿ 1250000
d)
Total surplus before tax
Total surplus=Consumer surplus+ Producer surplus
¿ 1250000+1250000
⊘ This is a preview!⊘
Do you want full access?
Subscribe today to unlock all pages.

Trusted by 1+ million students worldwide

3MICROECONOMICS
¿ 2500000
e)
Consumer surplus after tax
Consumer surplus= 1
2 × ( 1000−700 ) ×3 000
¿ 1
2 ×3 00 ×3 000
¿ 1 50× 3 000
¿ 45 0000
f)
Producer surplus after tax
Producer surplus= 1
2 × 300× 3 000
¿ 1 50× 5000
¿ 4 50000
g)
Total tax revenue=400× 3000
¿ 1200000
h)
¿ 2500000
e)
Consumer surplus after tax
Consumer surplus= 1
2 × ( 1000−700 ) ×3 000
¿ 1
2 ×3 00 ×3 000
¿ 1 50× 3 000
¿ 45 0000
f)
Producer surplus after tax
Producer surplus= 1
2 × 300× 3 000
¿ 1 50× 5000
¿ 4 50000
g)
Total tax revenue=400× 3000
¿ 1200000
h)
Paraphrase This Document
Need a fresh take? Get an instant paraphrase of this document with our AI Paraphraser

4MICROECONOMICS
Total surplus=Consumer surplus+Producer surplus+Tax revenue
¿ 450000+ 450000+1200000
¿ 2100000
i)
Deadweight loss= 1
2 × ( 700−500 ) × ( 5000−3000 ) + 1
2 × ( 700−500 ) × ( 5000−3000 )
¿ 1
2 ×200 ×2000+ 1
2 × 200× 2000
¿ 2000+2000
¿ 4000
Question 8
A)
The point A in the diagram shows a point that is not attainable at the current price and
given level of income. The two possible ways for the consumers to consume at point A are either
an increase in income or a decrease in price of commodity Y. If income of the consumer
increases, then this will make a parallel shift of the budget line under which the A can be a
feasible consumption point (Fine). A decrease in price of commodity Y will make a pivotal shift
of the budget line towards Y axis under which A can be an attainable consumption point.
B)
The feasible consumption points are B, C and D.
Consumption points that are not attainable are A and E.

5MICROECONOMICS
C)
Of the given pairs, the one which consumer prefers is C and B.
D)
At point D slope of the indifference curve is flatter than the slope of the budget line implying at
this pony MRSxy < Px/Py
E)
Given the budget the consumer consumes point C which is the optimal consumption
bundle.
Question 7
Case a
The shift in budget line from BC-1 to BC-2 shows the effect of an increase in price of
good X which reduces maximum amount of good that can be consumed with the given level of
income.
Case b
The shift in the budget line is either due to an increase in income or due to equal
proportionate decrease in price of both goods X and Y (Mankiw). In both the cases, consumers
can afford a larger amount of both the good which make a parallel shift of the budget line.
Case c
⊘ This is a preview!⊘
Do you want full access?
Subscribe today to unlock all pages.

Trusted by 1+ million students worldwide

6MICROECONOMICS
In this case shift in the budget line is due to an increase in price of commodity Y which
reduces the maximum amount of commodity Y that can be consumed with given level of income
(Cowell).
Case d
Here, shift in the budget line is due to the combined effect of an increase in price of
commodity X and decrease in price of commodity Y.
Paraphrase This Document
Need a fresh take? Get an instant paraphrase of this document with our AI Paraphraser

7MICROECONOMICS
References
Cowell, Frank. Microeconomics: principles and analysis. Oxford University Press, 2018.
Fine, Ben. "Microeconomics." University of Chicago Press Economics Books (2016).
Mankiw, N. Gregory. Principles of microeconomics. Cengage Learning, 2020.
References
Cowell, Frank. Microeconomics: principles and analysis. Oxford University Press, 2018.
Fine, Ben. "Microeconomics." University of Chicago Press Economics Books (2016).
Mankiw, N. Gregory. Principles of microeconomics. Cengage Learning, 2020.
1 out of 8
Related Documents

Your All-in-One AI-Powered Toolkit for Academic Success.
+13062052269
info@desklib.com
Available 24*7 on WhatsApp / Email
Unlock your academic potential
Copyright © 2020–2025 A2Z Services. All Rights Reserved. Developed and managed by ZUCOL.