Economics Assignment: Microeconomic Principles and Market Dynamics
VerifiedAdded on  2020/03/07
|14
|1907
|409
Homework Assignment
AI Summary
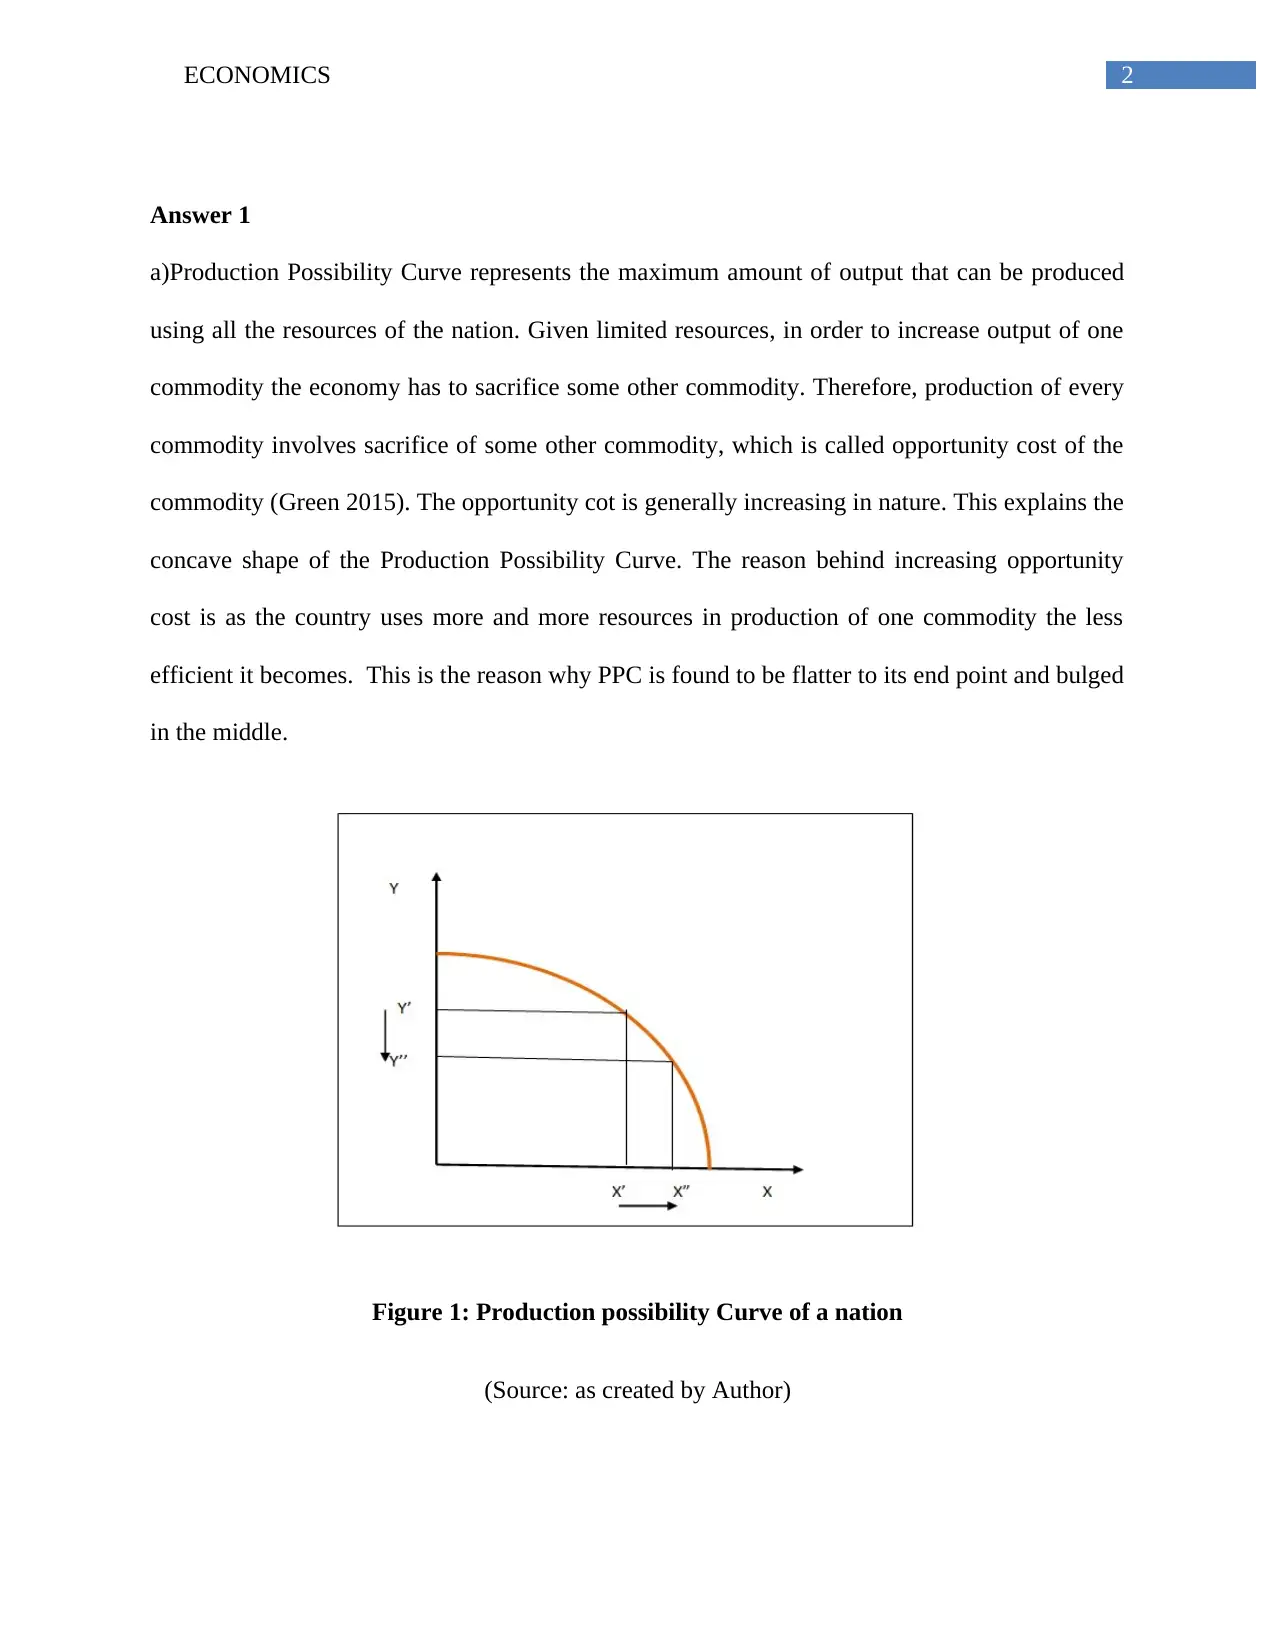
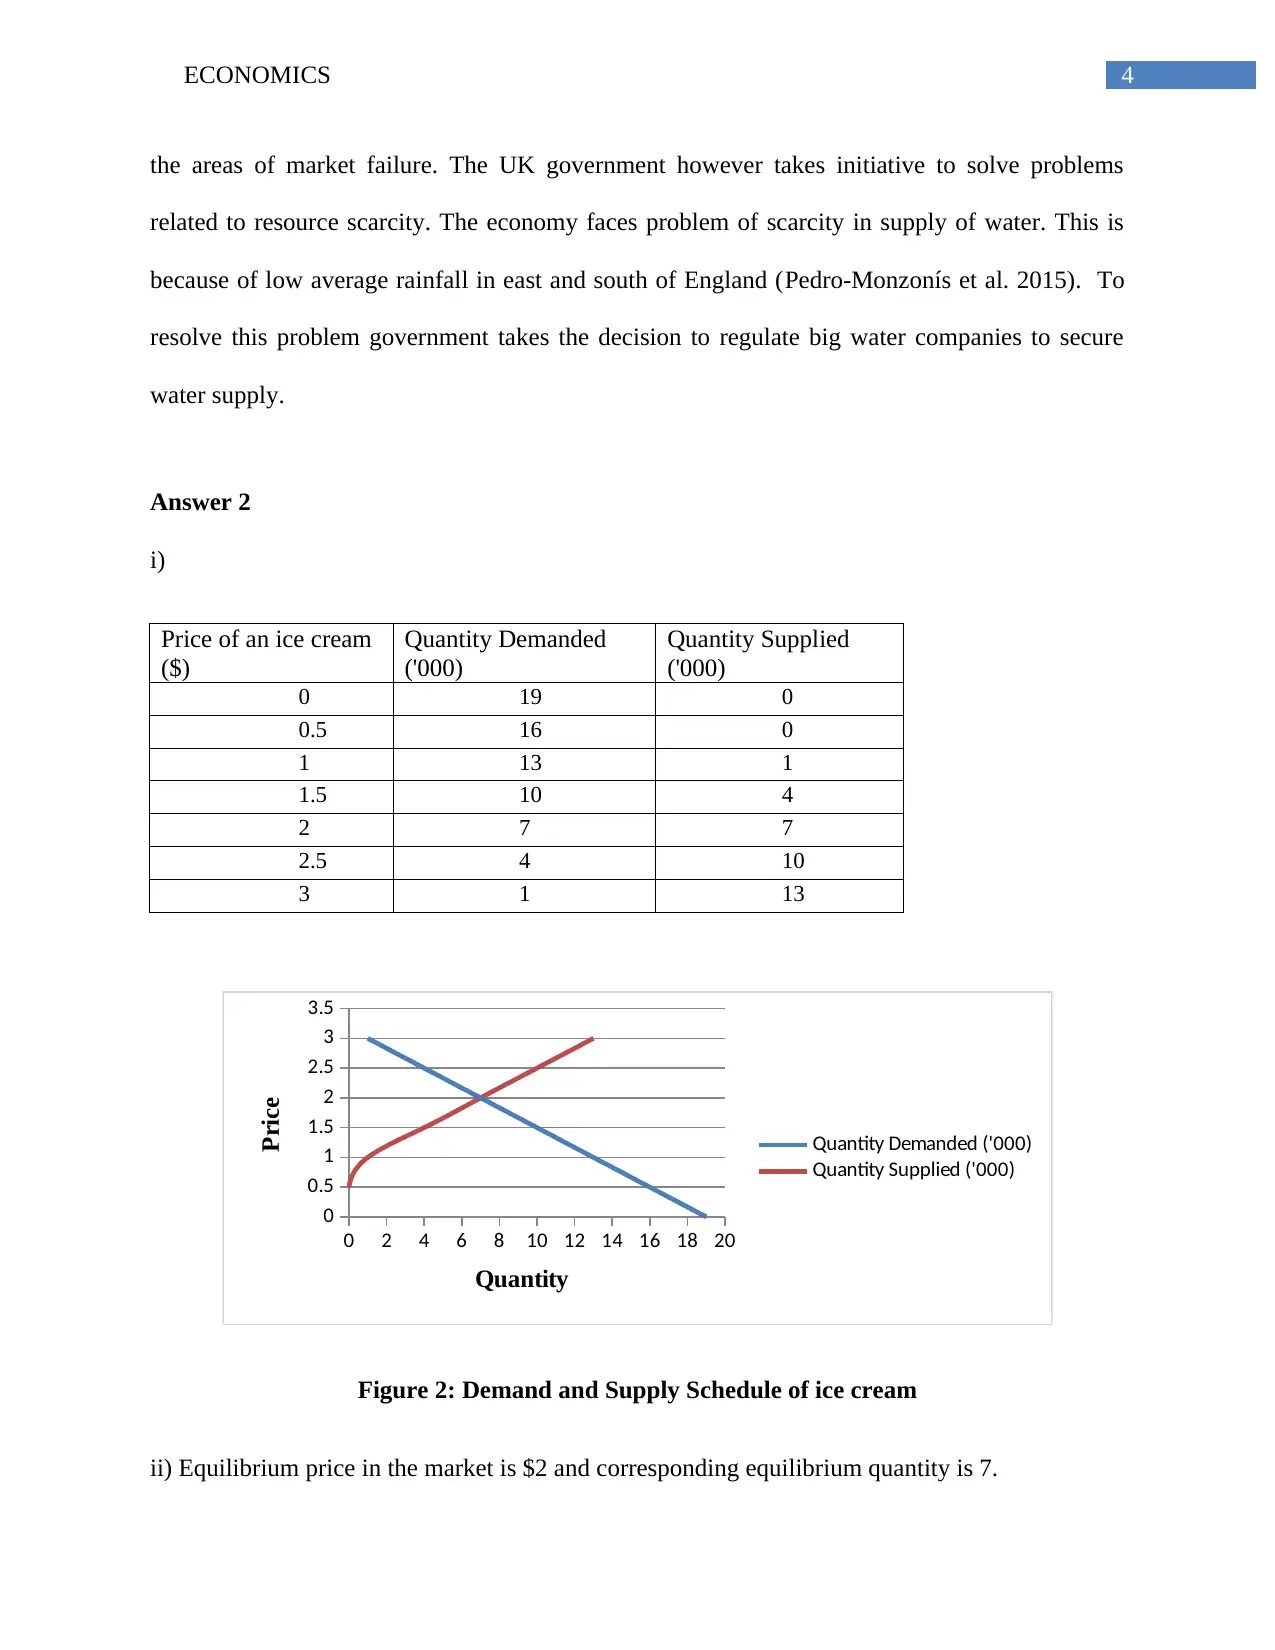
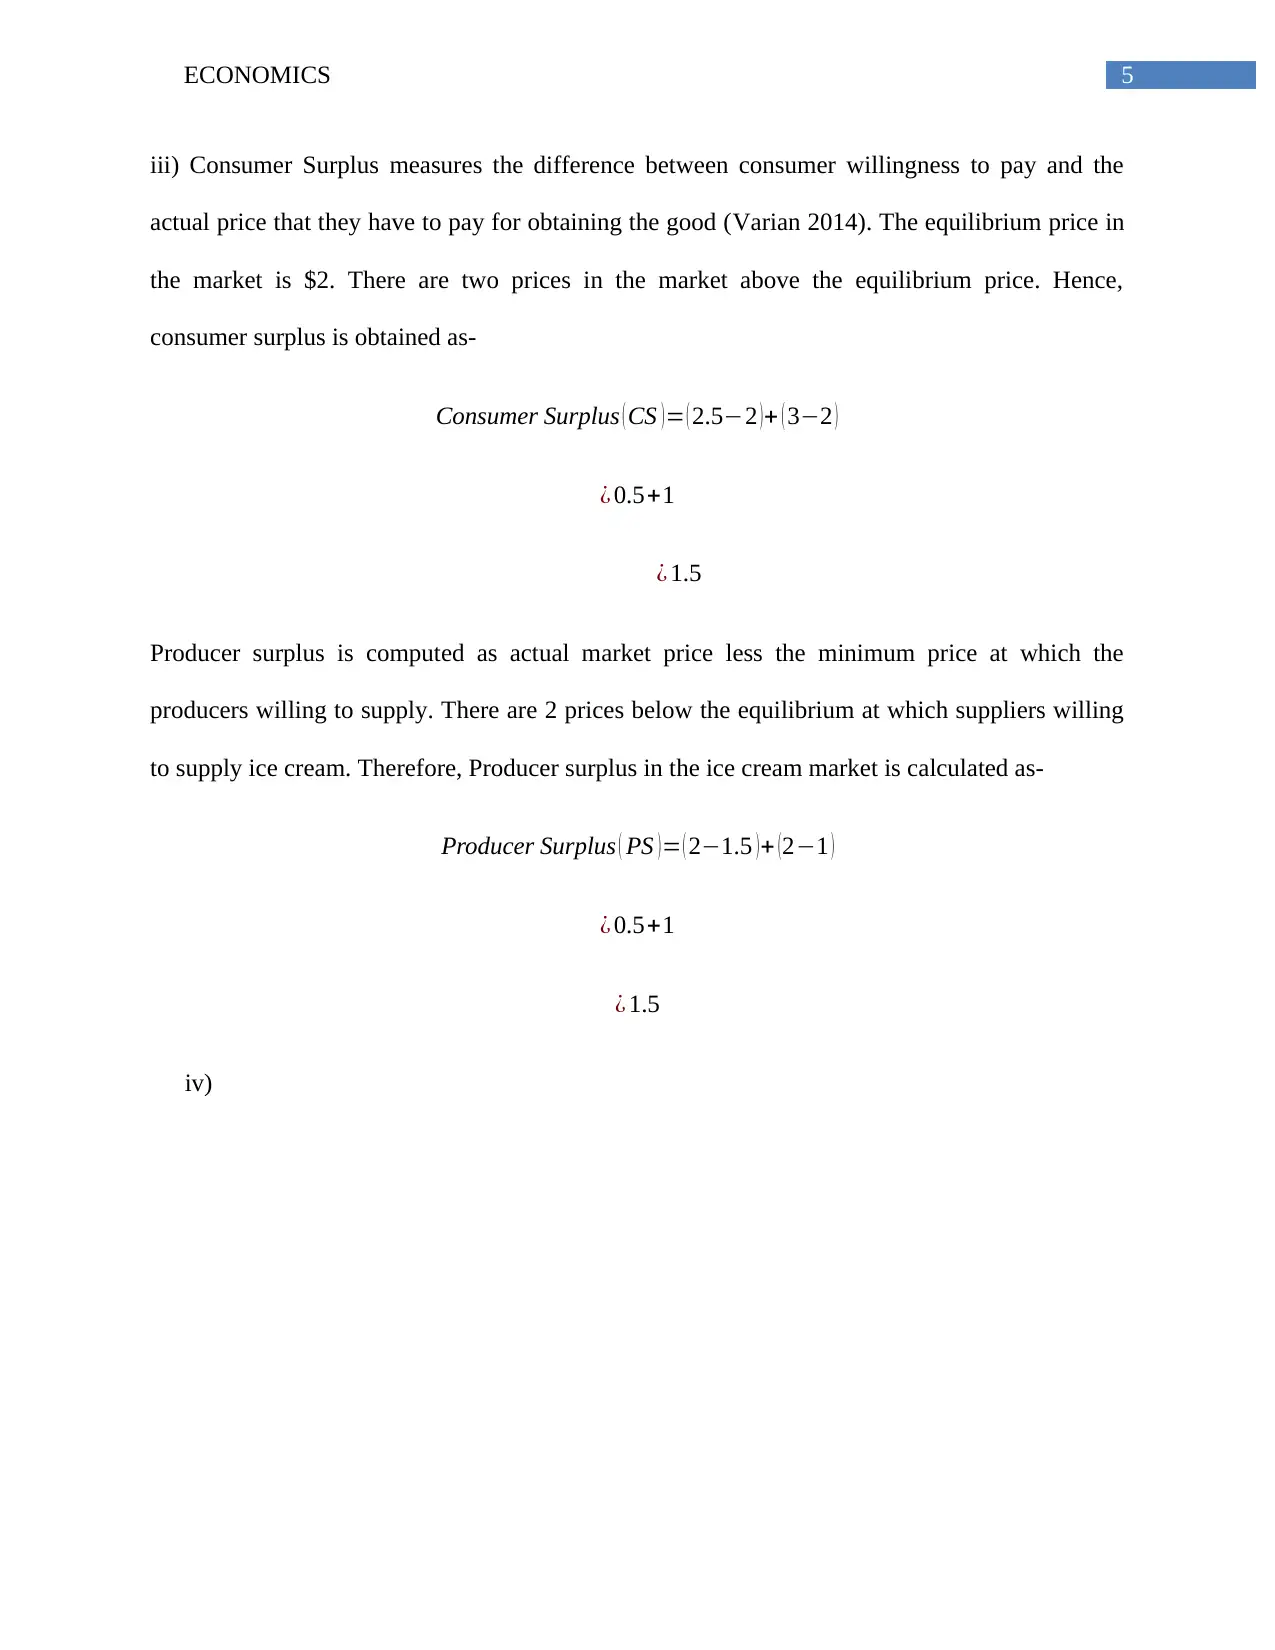
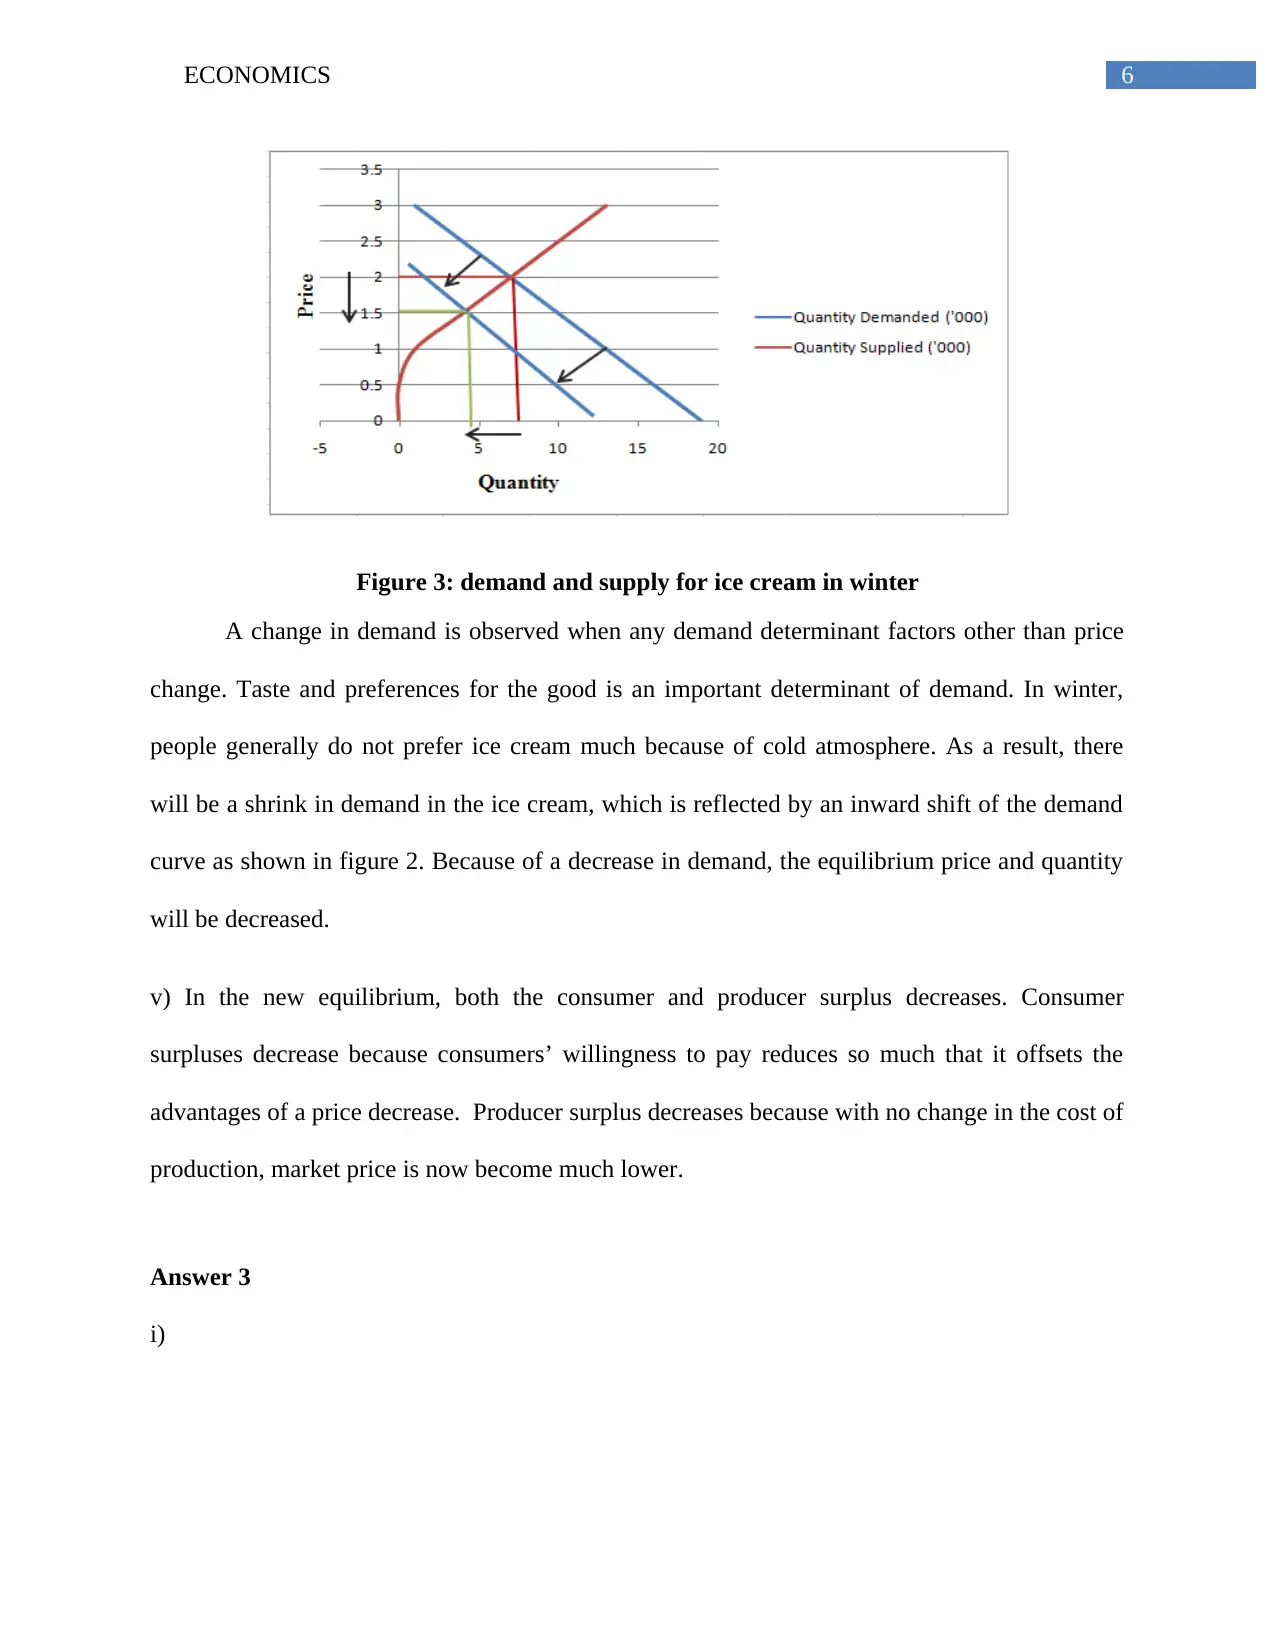
This economics assignment explores fundamental microeconomic principles. It begins by analyzing the production possibility curve and the concept of scarcity, illustrating how limited resources necessitate trade-offs. The assignment then delves into market dynamics, examining supply and demand schedules, equilibrium price and quantity, and consumer and producer surplus. It further investigates how shifts in demand, such as those caused by seasonal changes, affect market outcomes. The assignment also covers government interventions like price floors and their impact on market efficiency and welfare. Elasticity of demand is analyzed in the context of airline tickets, demonstrating how price changes affect consumer behavior. Finally, the assignment explores cost structures in a perfectly competitive market, determining profit-maximizing output levels and illustrating the relationship between marginal cost, average cost, and market price. The assignment concludes with references to relevant economic literature.

Running head: ECONOMICS
Economics
Name of the Student
Name of the University
Author note
Economics
Name of the Student
Name of the University
Author note
Paraphrase This Document
Need a fresh take? Get an instant paraphrase of this document with our AI Paraphraser

1ECONOMICS
Table of Contents
Answer 1..........................................................................................................................................2
Answer 2..........................................................................................................................................4
Answer 3..........................................................................................................................................6
Answer 4..........................................................................................................................................8
Answer 5..........................................................................................................................................9
References......................................................................................................................................12

2ECONOMICS
Answer 1
a)Production Possibility Curve represents the maximum amount of output that can be produced
using all the resources of the nation. Given limited resources, in order to increase output of one
commodity the economy has to sacrifice some other commodity. Therefore, production of every
commodity involves sacrifice of some other commodity, which is called opportunity cost of the
commodity (Green 2015). The opportunity cot is generally increasing in nature. This explains the
concave shape of the Production Possibility Curve. The reason behind increasing opportunity
cost is as the country uses more and more resources in production of one commodity the less
efficient it becomes. This is the reason why PPC is found to be flatter to its end point and bulged
in the middle.
Figure 1: Production possibility Curve of a nation
(Source: as created by Author)
⊘ This is a preview!⊘
Do you want full access?
Subscribe today to unlock all pages.

Trusted by 1+ million students worldwide

3ECONOMICS
Figure 1 shows the PPC for a nation. In order production of good X from X’ to X’’, production
of some other goods namely Y must needs to be reduced from Y’ to Y’’.
b) In economic terms, scarcity refers to inability of the limited resources to fulfill unlimited
wants. Scarcity as goes by its name not refers lack of something that can be fulfilled using
money or in exchange of something valuables. Rather it is a persistent problem in the economy.
In order to make a decision people always faces a trade off in terms of sacrificing some other
choices. The high paying job can solve Jane’s monetary problem but cannot get him red off the
economic choice or trade off problem. Then problem will stay always stay in the economy until
things become as completely free lunch. Therefore, it is not be the case that Jane will no longer
face the problem of scarcity.
c) Every economy has its own way of handling the problem of scarcity. The three foremost
important question of the economy what to produce, how to produce and for whom to produce
are answered in different way depending on the structure of the economy. For example in a
command-economy where government intervention is supposed to be the highest, government
takes the decisions about output and resource allocation. Government there allows t6he
production of goods that satisfy the needs of most of the people in the economy. in a free market
economy government intervention is the least. Resources are left in the hands of free market
economy and forces of supply and demand ensure efficient production. An efficient form of
economy is c\some combination of these two called the mixed economy. Here free market forces
as well as government intervention work together depending on the economic situation.
The economic structure of UK is very much similar to that of a mixed economy. For most
of the sectors in the economy, there is free market environment. Government intervenes only in
Paraphrase This Document
Need a fresh take? Get an instant paraphrase of this document with our AI Paraphraser

4ECONOMICS
the areas of market failure. The UK government however takes initiative to solve problems
related to resource scarcity. The economy faces problem of scarcity in supply of water. This is
because of low average rainfall in east and south of England (Pedro-MonzonÃs et al. 2015). To
resolve this problem government takes the decision to regulate big water companies to secure
water supply.
Answer 2
i)
Price of an ice cream
($)
Quantity Demanded
('000)
Quantity Supplied
('000)
0 19 0
0.5 16 0
1 13 1
1.5 10 4
2 7 7
2.5 4 10
3 1 13
0 2 4 6 8 10 12 14 16 18 20
0
0.5
1
1.5
2
2.5
3
3.5
Quantity Demanded ('000)
Quantity Supplied ('000)
Quantity
Price
Figure 2: Demand and Supply Schedule of ice cream
ii) Equilibrium price in the market is $2 and corresponding equilibrium quantity is 7.

5ECONOMICS
iii) Consumer Surplus measures the difference between consumer willingness to pay and the
actual price that they have to pay for obtaining the good (Varian 2014). The equilibrium price in
the market is $2. There are two prices in the market above the equilibrium price. Hence,
consumer surplus is obtained as-
Consumer Surplus ( CS )= ( 2.5−2 )+ ( 3−2 )
¿ 0.5+1
¿ 1.5
Producer surplus is computed as actual market price less the minimum price at which the
producers willing to supply. There are 2 prices below the equilibrium at which suppliers willing
to supply ice cream. Therefore, Producer surplus in the ice cream market is calculated as-
Producer Surplus ( PS )= ( 2−1.5 )+ (2−1 )
¿ 0.5+1
¿ 1.5
iv)
⊘ This is a preview!⊘
Do you want full access?
Subscribe today to unlock all pages.

Trusted by 1+ million students worldwide

6ECONOMICS
Figure 3: demand and supply for ice cream in winter
A change in demand is observed when any demand determinant factors other than price
change. Taste and preferences for the good is an important determinant of demand. In winter,
people generally do not prefer ice cream much because of cold atmosphere. As a result, there
will be a shrink in demand in the ice cream, which is reflected by an inward shift of the demand
curve as shown in figure 2. Because of a decrease in demand, the equilibrium price and quantity
will be decreased.
v) In the new equilibrium, both the consumer and producer surplus decreases. Consumer
surpluses decrease because consumers’ willingness to pay reduces so much that it offsets the
advantages of a price decrease. Producer surplus decreases because with no change in the cost of
production, market price is now become much lower.
Answer 3
i)
Paraphrase This Document
Need a fresh take? Get an instant paraphrase of this document with our AI Paraphraser

7ECONOMICS
Figure 4: Effect of the policy of price floor in the market for milk
( Source: as created by the Author)
Figure 3 explains the effect of price floor policy taken by the government. Without
government intervention the free market price and quantity is given as P* and Q* respectively.
Suppose the government set a minimum price in the market as P min. As a result of increase in
price, consumers respond by decreasing their demand. In the free market, situation buyers enjoy
a consumer surplus given by the area ‘abe’. With price floor, consumer surplus has reduced to
area ‘a’ only.
ii) The dairy farmers now received an increased price for their product. This increases their
income to some extent. However, the producers now face a decreased demand. This offsets the
gain from increased price. With price floor, demand in the market reduced from Q* to QM.
Whereas, supply in the market increased from Q* to QT. Dairy farmers left with an excess supply
in the market. Thus, the benefit from price increases offset by the depressed demand resulting in
a deadweight loss to the society.

8ECONOMICS
iii) In the dairy market, there is now an excess supply of the amount (QT-QM). In order to
continue the policy of price floor the excess supply must be absorbed in the market. Otherwise,
the excess product will again push the prices down. The government has to buy the residual
products from the market at the existing price. These will add to the buffer stocks of the
government and can be supplied at a low price in times of food crisis. However, in most of the
times these are wasted due to insufficient storage facilities. Without proper arrangement if the
government purchases all the surplus product then a considerable portion of the tax revenue will
be wasted and creates additional burden of tax revenues to common people in the nation.
⊘ This is a preview!⊘
Do you want full access?
Subscribe today to unlock all pages.

Trusted by 1+ million students worldwide

9ECONOMICS
Answer 4
a)
Price(
P)
Quantity
(Q)
d
P
(P1+P2
)/2
% change in
price
d
Q
(Q1+Q2
)/2
% change in
quantity
Elastici
ty
2 10
3 8 1 2.5 40.00 2 9 22.22 0.56
4 6 1 3.5 28.57 2 7 28.57 1
5 4 1 4.5 22.22 2 5 40 1.80
Price
($)
Quantity
demanded
Total
revenue
($)
Percent
change in
price
Percentage
change in
quantity
demanded
Elasticity Assessment of
Elasticity
2 10 20
3 8 24 40 22.22 0.56 Inelastic
demand
4 6 24 28.57 28.57 1 Unitary elastic
demand
5 4 20 22.22 40 1.80 Relatively
elastic
demand.
b) During the holiday period, the demand for airline tickets is generally high. During this time,
people value their leisure time more. A small decrease in the airline fare can attracts many
travelers at the same time. Those who previously prefer train journey will respond to decreasing
price by raising their demand. Thus, demand is expected to be more elastic during this time.
Paraphrase This Document
Need a fresh take? Get an instant paraphrase of this document with our AI Paraphraser

10ECONOMICS

11ECONOMICS
Answer 5
a)
Quantity
of gardens
Total
Fixed
Cost
Total
Variable
Cost
Total
Cost
Margin
al Cost
Average
Fixed Cost
Average
Variable
Cost
Average
Total Cost
0 10 0 10 0.00 0 0.00
4
1 10 4 14 10.00 4 14.00
8
2 10 12 22 5.00 6 11.00
12
3 10 24 34 3.33 8 11.33
16
4 10 40 50 2.50 10 12.50
20
5 10 60 70 2.00 12 14.00
24
6 10 84 94 1.67 14 15.67
28
7 10 112 122 1.43 16 17.43
32
8 10 144 154 1.25 18 19.25
b) In a perfectly competitive market, neither the consumer nor the producer can influence price
(Thomas, Lubinda and Angula 2015). Hence, price is fixed in this market. Profit in the market is
defined as
Profit = Total Revenue (TR)- Total Cost (TC)
= P* Q- TC ; [ Q is the quantity sols in the market and P is the unit price]
The first order condition of profit maximization is-
⊘ This is a preview!⊘
Do you want full access?
Subscribe today to unlock all pages.

Trusted by 1+ million students worldwide
1 out of 14
Related Documents

Your All-in-One AI-Powered Toolkit for Academic Success.
 +13062052269
info@desklib.com
Available 24*7 on WhatsApp / Email
Unlock your academic potential
Copyright © 2020–2025 A2Z Services. All Rights Reserved. Developed and managed by ZUCOL.