BUS-7120 V2: Business Financial Systems - Microsoft Report
VerifiedAdded on 2023/04/22
|16
|3733
|308
Report
AI Summary
This report provides a comprehensive financial analysis of Microsoft Corporation, covering various aspects of its business and financial performance. The analysis begins with an overview of Microsoft's business, products, and operational history, followed by an assessment of its operations from a microeconomic perspective, including demand characteristics and competitive landscape. The report then evaluates the current macroeconomic situation in the US, discussing the implications of government actions on the company's profitability and growth. A detailed ratio analysis is conducted, examining gross profit margin, operating profit margin, net profit margin, liquidity ratios, solvency ratios, and turnover ratios to assess Microsoft's financial health. The report further includes a pro forma income statement to estimate earnings per share (EPS) for the next fiscal year, along with an explanation of beta and calculation of the CAPM value. Additionally, it determines the growth rate of the organization using the valuation model and discusses the reasons behind any discrepancies between the calculated growth and growth estimates. Finally, the report concludes with a justification for pursuing the CFO position, based on the comprehensive analysis and understanding of Microsoft's financial position and future prospects.
Running head: BUS-7120 V2: BUSINESS FINANCIAL SYSTEMS
BUS-7120 V2: Business Financial Systems
Name of the Student:
Name of the University:
Author’s Note:
Course ID:
BUS-7120 V2: Business Financial Systems
Name of the Student:
Name of the University:
Author’s Note:
Course ID:
Paraphrase This Document
Need a fresh take? Get an instant paraphrase of this document with our AI Paraphraser
1BUS-7120 V2: BUSINESS FINANCIAL SYSTEMS
Table of Contents
Part I: Choosing the adequate organization, while providing relevant information regarding the
business, product, operational time and main location....................................................................2
Part II: Assessing the operations of the organization from a microeconomic point of view, while
discussing its demand characteristics..............................................................................................3
Part III: Evaluating the current macroeconomic situations of US, while discussing the
implications of the actions taken by the government......................................................................4
Part IV: Conducting ratio analysis of the company.........................................................................5
Part V: Creating proforma income statement for the company, while detecting its EPS for the
next fiscal year.................................................................................................................................9
Part VI: Explaining about beta and calculating the CAPM value of the organization..................10
Part VII: Detecting the growth rate of the organization by using the valuation model.................11
Part VIII: Providing several reasons behind the difference between the calculated growth and the
growth provided in growth estimates............................................................................................11
Part IX: Providing reasons behind the decision of becoming the CFO of the organization..........12
References and Bibliography:........................................................................................................13
2BUS-7120 V2: BUSINESS FINANCIAL SYSTEMS
Part I: Choosing the adequate organization, while providing relevant information
regarding the business, product, operational time and main location
Microsoft has been one of the major organizations in US who has generated constant
growth in their share price. In addition, investors believe that Microsoft is one of the safest
investment havens, which can help them increase their return from investment. Microsoft has
been operating since 1975, where it was founded in New Mexico USA. The company has been
one the major contributors in the industry of computer software and hardware, which has
allowed the organization to become one of the major contributions in the computer industry
(Microsoft.com, 2019).
The main operations of the Microsoft are to provide computer-based products to
individual consumers and companies all around the world. The company has been providing
products such as windows, office, servers, skype, Visual Studio, Xbox, Dynamics and list of
other software. The company has also been providing adequate services such as Office 365,
Windows Store, Windows Update, Outlook, LinkedIn, Bing and Azure. The company has been
operating from New Mexico, where the current headquarters is in Redmond, Washington USA.
The other aspects of the organization are the rising popularity of computer components
all around the world that has increased profits and demand of the products produced by
Microsoft. Both services and products adequately demanded by the retail and corporate
customers to utilize them to increase their efficiency. Microsoft is also one of the largest
producers of corporate security products and servers, which is highly demanded by the corporate
world. The super computers and high-end machines products has allowed Microsoft to increase
their exposure in corporate world (Microsoft.com, 2019).
⊘ This is a preview!⊘
Do you want full access?
Subscribe today to unlock all pages.
Trusted by 1+ million students worldwide
3BUS-7120 V2: BUSINESS FINANCIAL SYSTEMS
Part II: Assessing the operations of the organization from a microeconomic point of view,
while discussing its demand characteristics
After analyzing the demand characteristics of Microsoft it could be identified that the
organization has a huge customer base which is distributed around the world. The products and
services offered by the organization are used adequately by maximum of the computing world.
Microsoft has customer base from normal individuals to high end corporate MNCs, as the
organization provides all range of products and services to its customers. Moreover, the major
competition of Microsoft is in different sectors, which compare comprises of companies such as
Apple Inc., IBM, Ericsson and other software providing company. The competition of Microsoft
is a relatively high as maximum of the customer that is targeted by its competitors is related to
corporate field and normal individuals. Apple Inc. relatively provides the intense competition, as
Microsoft generates adequate revenues from computer sales around the world (Microsoft.com,
2019).
The cost factors of the organization are adequately evaluated from its financial report,
where both variable and fixed costs are adequately insured by the organization. The major fixed
cost that is conducted by the Microsoft is from salary expenses, administrative expenses, and
research expenses that need to be conducted by the management to maintain adequate operations.
Moreover, the variable cost comprises of the cost of sales that needs to be incurred by the
organization to produce the relevant products for sale. From the valuation of Microsoft annual
report it will be identified that the organization is currently under oligopoly market, where some
of the companies are controlling the maximum market share of the industry.
Paraphrase This Document
Need a fresh take? Get an instant paraphrase of this document with our AI Paraphraser
4BUS-7120 V2: BUSINESS FINANCIAL SYSTEMS
Part III: Evaluating the current macroeconomic situations of US, while discussing the
implications of the actions taken by the government
The current Macroeconomic conditions of US is relatively volatile, as the government
has come out from recent shutdown, which mainly wiped out maximum of the GDP is that was
gained during the past fiscal year. However, the shutdown of the government has not changed
the economist point of view for the growing US market, which will increase the economic
conditions of the country. The economist directly belief the country is currently in economic
boom, which resulted in higher growth, prospects and pushed the market index to a higher level.
Moreover, the decision that has been made by the Trump government has relatively highlighted
the progress that was being made by the corporation in USA, where adequate production in
corporate tax rate has boosted the company's profits (Taxfoundation.org, 2018).
The anticipated growth rate of United States For 2019 is a relatively at the levels of 3.5%,
which is mainly evaluated to grow to 3.6% in 2020 and 3.8% in 2021 (Thebalance.com, 2019).
This economic growth rate eventually allows the organization in the country to progress rapidly
and increase the revenues in the long run. The current proposal of the President is relatively not
clear, where he aims only to make America great again but no adequate or policies have been
implemented by the US government. The decisions made by the government has improved the
profitability conditions of Microsoft as corporate tax level has been reduced, which has allowed
the company to improve its retained income. However, there is no clear understanding of the
future economic condition of USA until President Donald Trump is in charge of the country and
government.
5BUS-7120 V2: BUSINESS FINANCIAL SYSTEMS
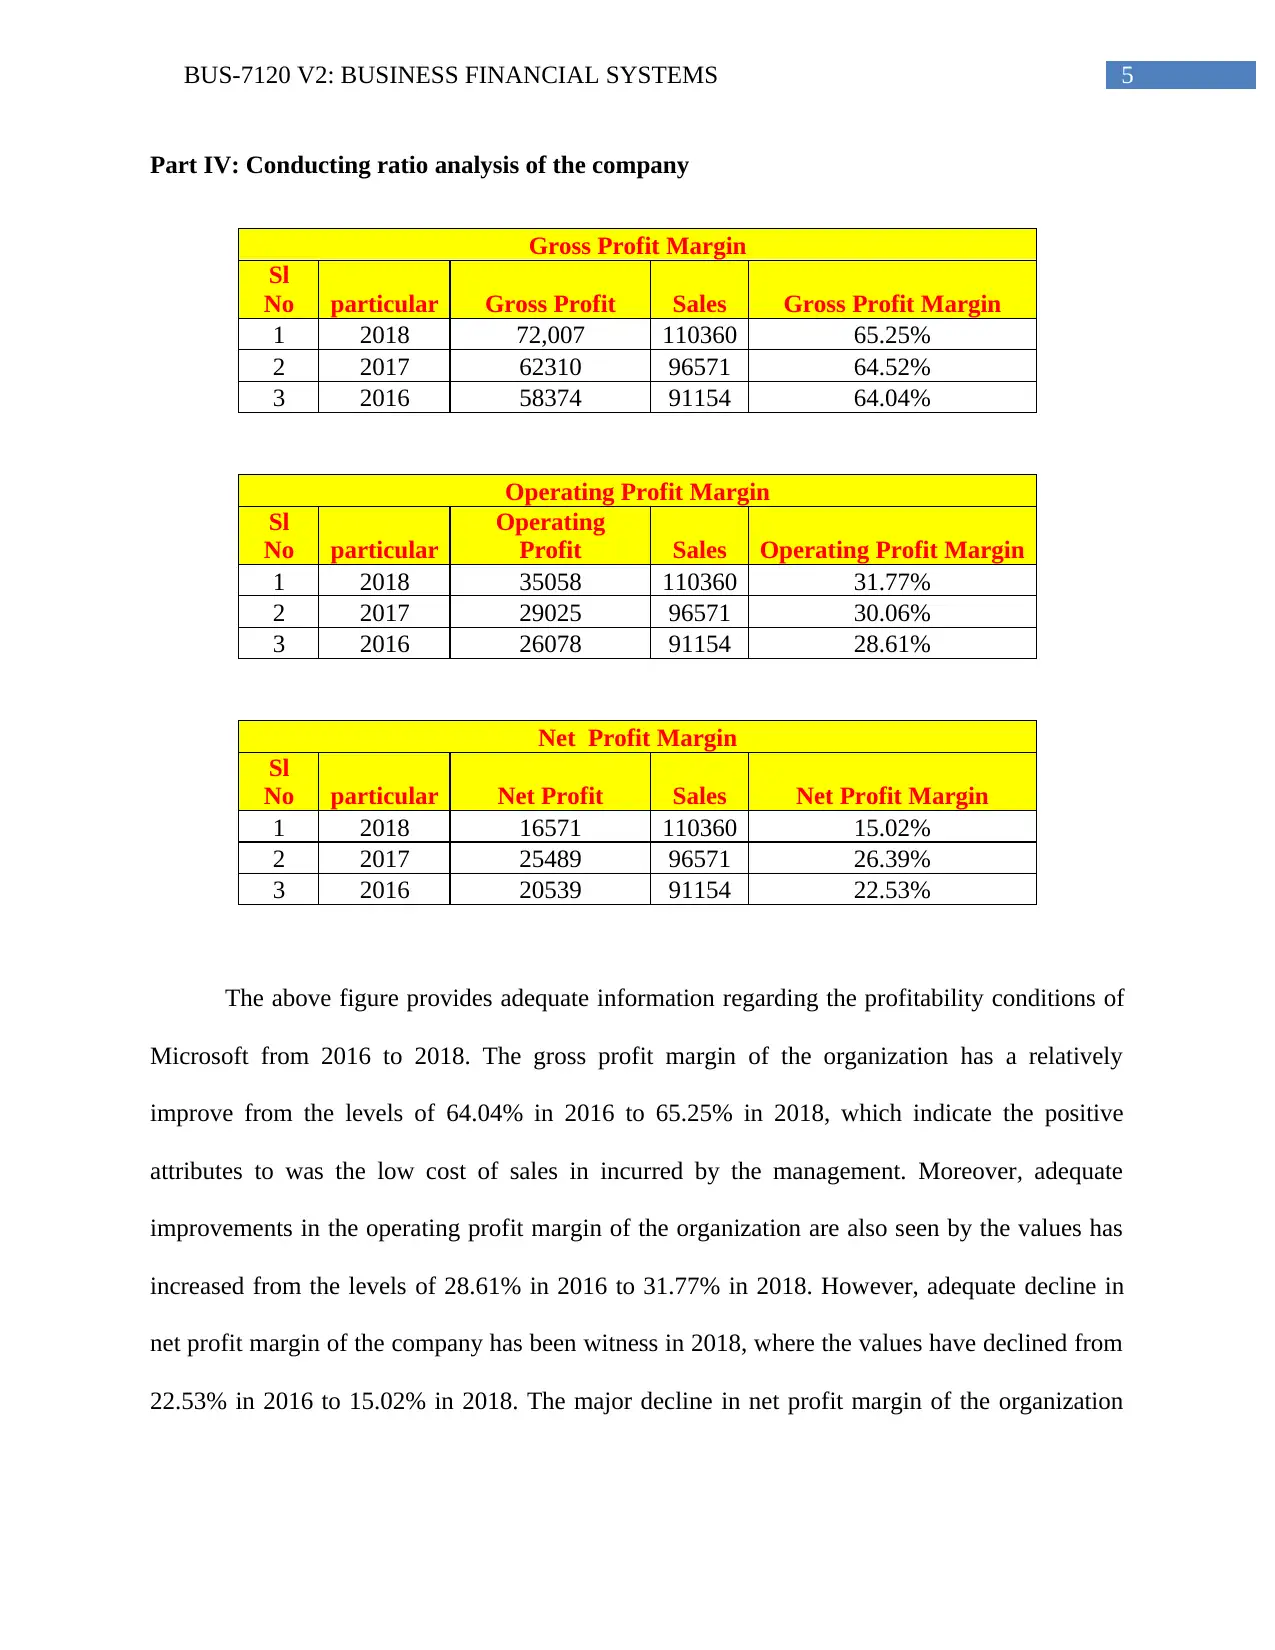
Part IV: Conducting ratio analysis of the company
Gross Profit Margin
Sl
No particular Gross Profit Sales Gross Profit Margin
1 2018 72,007 110360 65.25%
2 2017 62310 96571 64.52%
3 2016 58374 91154 64.04%
Operating Profit Margin
Sl
No particular
Operating
Profit Sales Operating Profit Margin
1 2018 35058 110360 31.77%
2 2017 29025 96571 30.06%
3 2016 26078 91154 28.61%
Net Profit Margin
Sl
No particular Net Profit Sales Net Profit Margin
1 2018 16571 110360 15.02%
2 2017 25489 96571 26.39%
3 2016 20539 91154 22.53%
The above figure provides adequate information regarding the profitability conditions of
Microsoft from 2016 to 2018. The gross profit margin of the organization has a relatively
improve from the levels of 64.04% in 2016 to 65.25% in 2018, which indicate the positive
attributes to was the low cost of sales in incurred by the management. Moreover, adequate
improvements in the operating profit margin of the organization are also seen by the values has
increased from the levels of 28.61% in 2016 to 31.77% in 2018. However, adequate decline in
net profit margin of the company has been witness in 2018, where the values have declined from
22.53% in 2016 to 15.02% in 2018. The major decline in net profit margin of the organization
⊘ This is a preview!⊘
Do you want full access?
Subscribe today to unlock all pages.
Trusted by 1+ million students worldwide
6BUS-7120 V2: BUSINESS FINANCIAL SYSTEMS
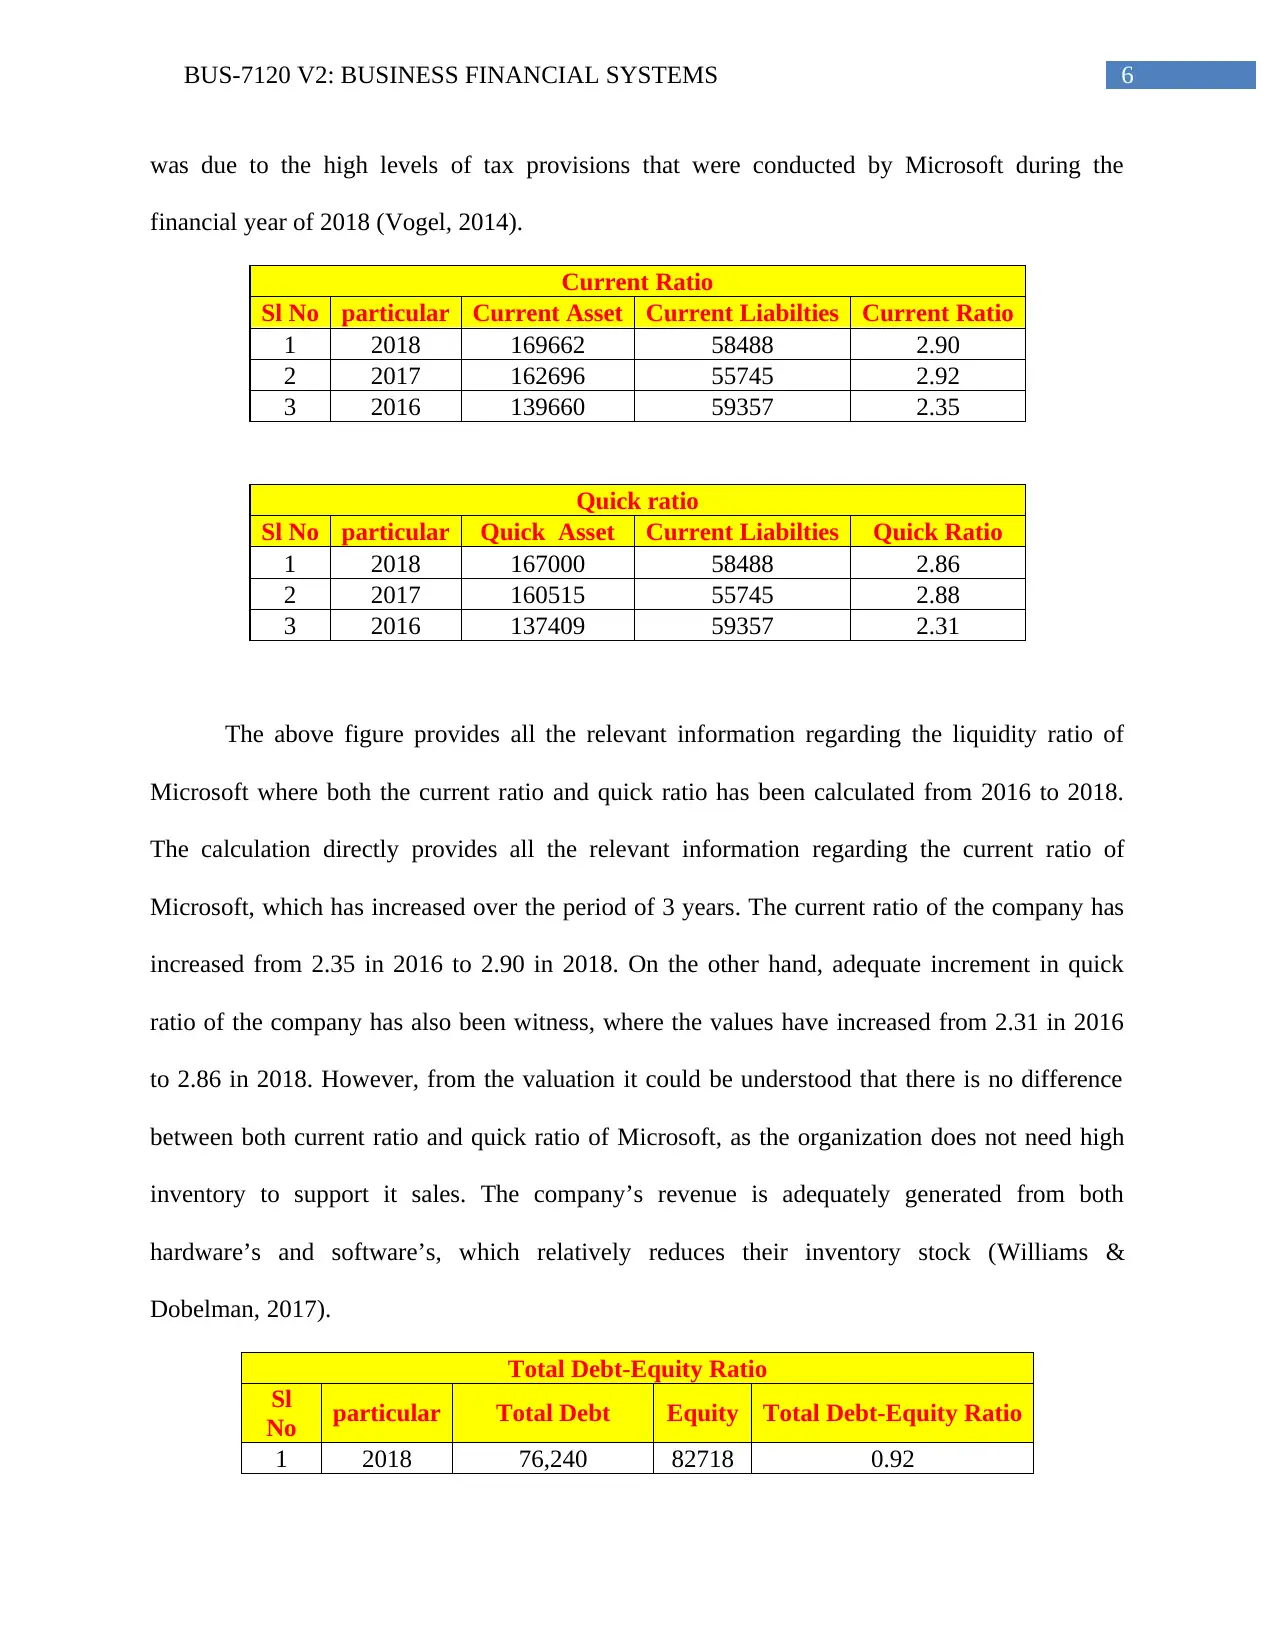
was due to the high levels of tax provisions that were conducted by Microsoft during the
financial year of 2018 (Vogel, 2014).
Current Ratio
Sl No particular Current Asset Current Liabilties Current Ratio
1 2018 169662 58488 2.90
2 2017 162696 55745 2.92
3 2016 139660 59357 2.35
Quick ratio
Sl No particular Quick Asset Current Liabilties Quick Ratio
1 2018 167000 58488 2.86
2 2017 160515 55745 2.88
3 2016 137409 59357 2.31
The above figure provides all the relevant information regarding the liquidity ratio of
Microsoft where both the current ratio and quick ratio has been calculated from 2016 to 2018.
The calculation directly provides all the relevant information regarding the current ratio of
Microsoft, which has increased over the period of 3 years. The current ratio of the company has
increased from 2.35 in 2016 to 2.90 in 2018. On the other hand, adequate increment in quick
ratio of the company has also been witness, where the values have increased from 2.31 in 2016
to 2.86 in 2018. However, from the valuation it could be understood that there is no difference
between both current ratio and quick ratio of Microsoft, as the organization does not need high
inventory to support it sales. The company’s revenue is adequately generated from both
hardware’s and software’s, which relatively reduces their inventory stock (Williams &
Dobelman, 2017).
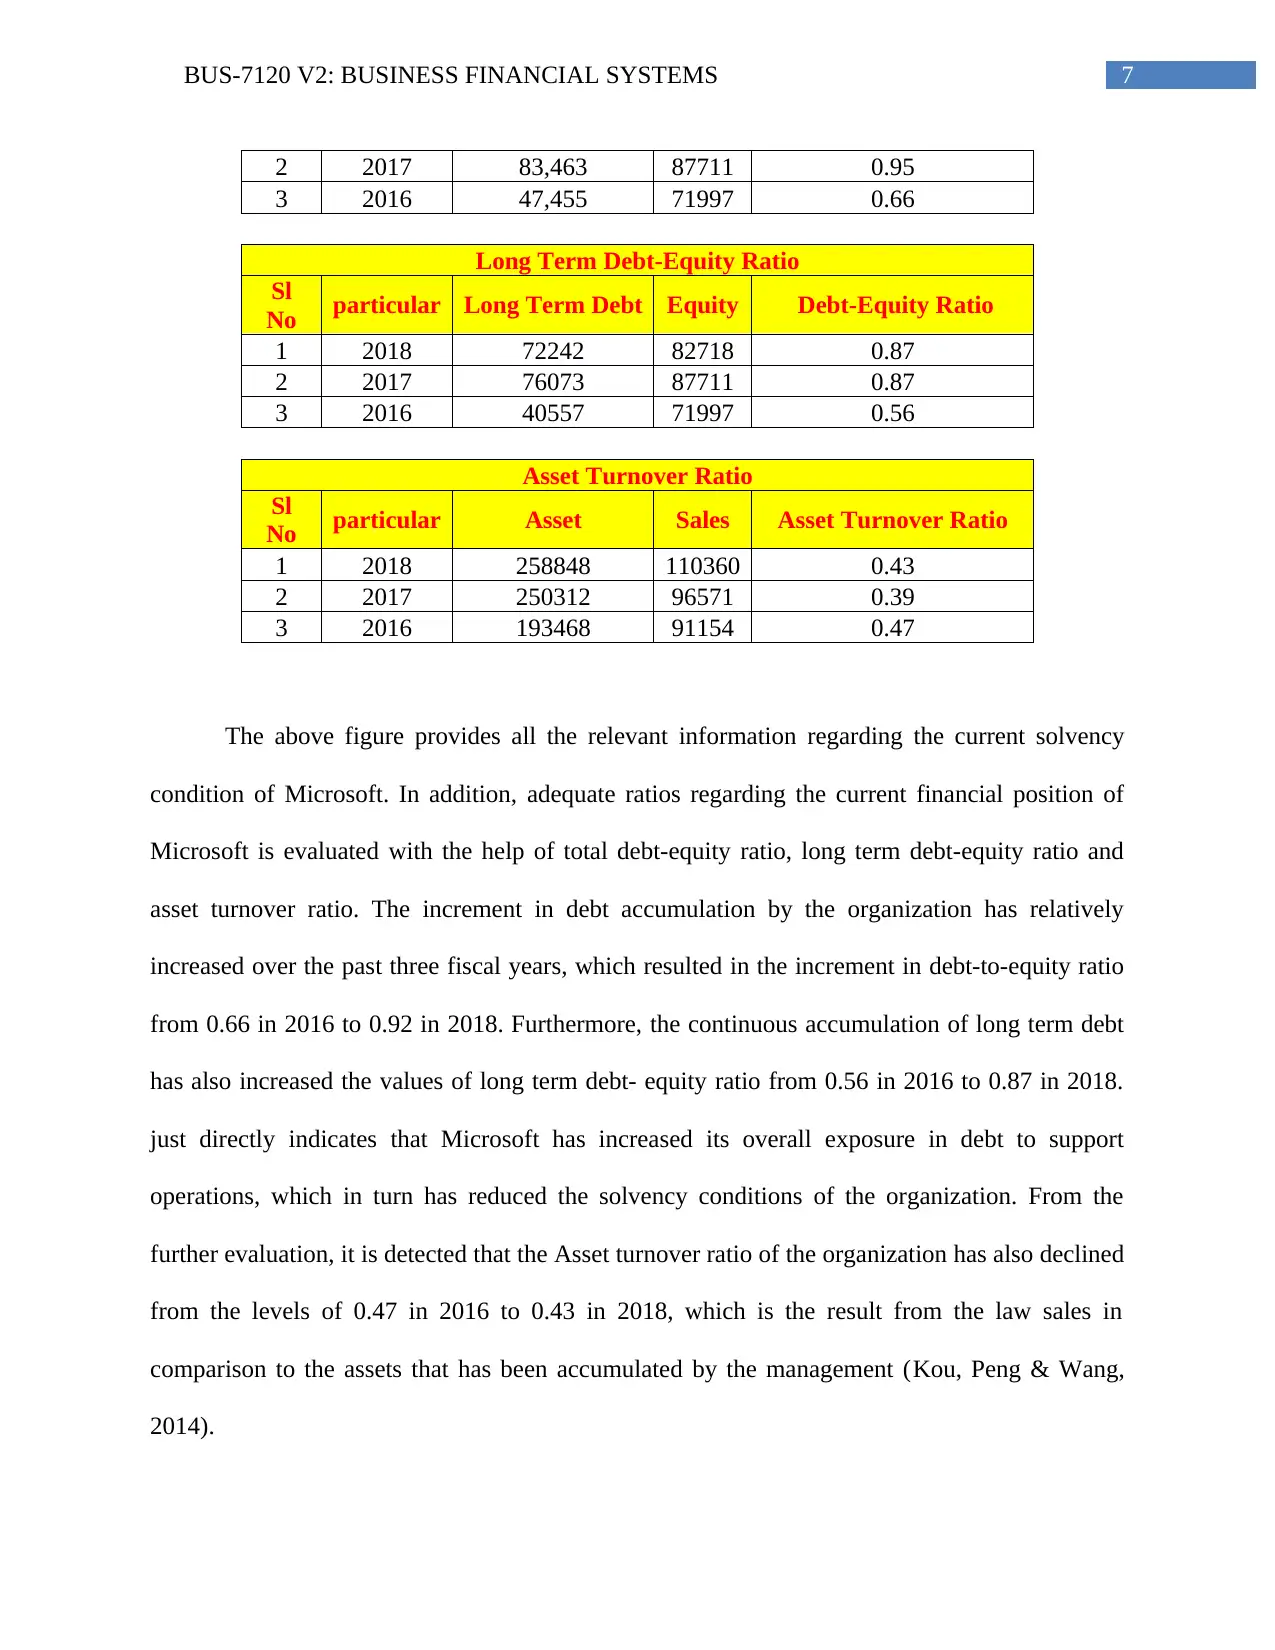
Total Debt-Equity Ratio
Sl
No particular Total Debt Equity Total Debt-Equity Ratio
1 2018 76,240 82718 0.92
was due to the high levels of tax provisions that were conducted by Microsoft during the
financial year of 2018 (Vogel, 2014).
Current Ratio
Sl No particular Current Asset Current Liabilties Current Ratio
1 2018 169662 58488 2.90
2 2017 162696 55745 2.92
3 2016 139660 59357 2.35
Quick ratio
Sl No particular Quick Asset Current Liabilties Quick Ratio
1 2018 167000 58488 2.86
2 2017 160515 55745 2.88
3 2016 137409 59357 2.31
The above figure provides all the relevant information regarding the liquidity ratio of
Microsoft where both the current ratio and quick ratio has been calculated from 2016 to 2018.
The calculation directly provides all the relevant information regarding the current ratio of
Microsoft, which has increased over the period of 3 years. The current ratio of the company has
increased from 2.35 in 2016 to 2.90 in 2018. On the other hand, adequate increment in quick
ratio of the company has also been witness, where the values have increased from 2.31 in 2016
to 2.86 in 2018. However, from the valuation it could be understood that there is no difference
between both current ratio and quick ratio of Microsoft, as the organization does not need high
inventory to support it sales. The company’s revenue is adequately generated from both
hardware’s and software’s, which relatively reduces their inventory stock (Williams &
Dobelman, 2017).
Total Debt-Equity Ratio
Sl
No particular Total Debt Equity Total Debt-Equity Ratio
1 2018 76,240 82718 0.92
Paraphrase This Document
Need a fresh take? Get an instant paraphrase of this document with our AI Paraphraser
7BUS-7120 V2: BUSINESS FINANCIAL SYSTEMS
2 2017 83,463 87711 0.95
3 2016 47,455 71997 0.66
Long Term Debt-Equity Ratio
Sl
No particular Long Term Debt Equity Debt-Equity Ratio
1 2018 72242 82718 0.87
2 2017 76073 87711 0.87
3 2016 40557 71997 0.56
Asset Turnover Ratio
Sl
No particular Asset Sales Asset Turnover Ratio
1 2018 258848 110360 0.43
2 2017 250312 96571 0.39
3 2016 193468 91154 0.47
The above figure provides all the relevant information regarding the current solvency
condition of Microsoft. In addition, adequate ratios regarding the current financial position of
Microsoft is evaluated with the help of total debt-equity ratio, long term debt-equity ratio and
asset turnover ratio. The increment in debt accumulation by the organization has relatively
increased over the past three fiscal years, which resulted in the increment in debt-to-equity ratio
from 0.66 in 2016 to 0.92 in 2018. Furthermore, the continuous accumulation of long term debt
has also increased the values of long term debt- equity ratio from 0.56 in 2016 to 0.87 in 2018.
just directly indicates that Microsoft has increased its overall exposure in debt to support
operations, which in turn has reduced the solvency conditions of the organization. From the
further evaluation, it is detected that the Asset turnover ratio of the organization has also declined
from the levels of 0.47 in 2016 to 0.43 in 2018, which is the result from the law sales in
comparison to the assets that has been accumulated by the management (Kou, Peng & Wang,
2014).
8BUS-7120 V2: BUSINESS FINANCIAL SYSTEMS
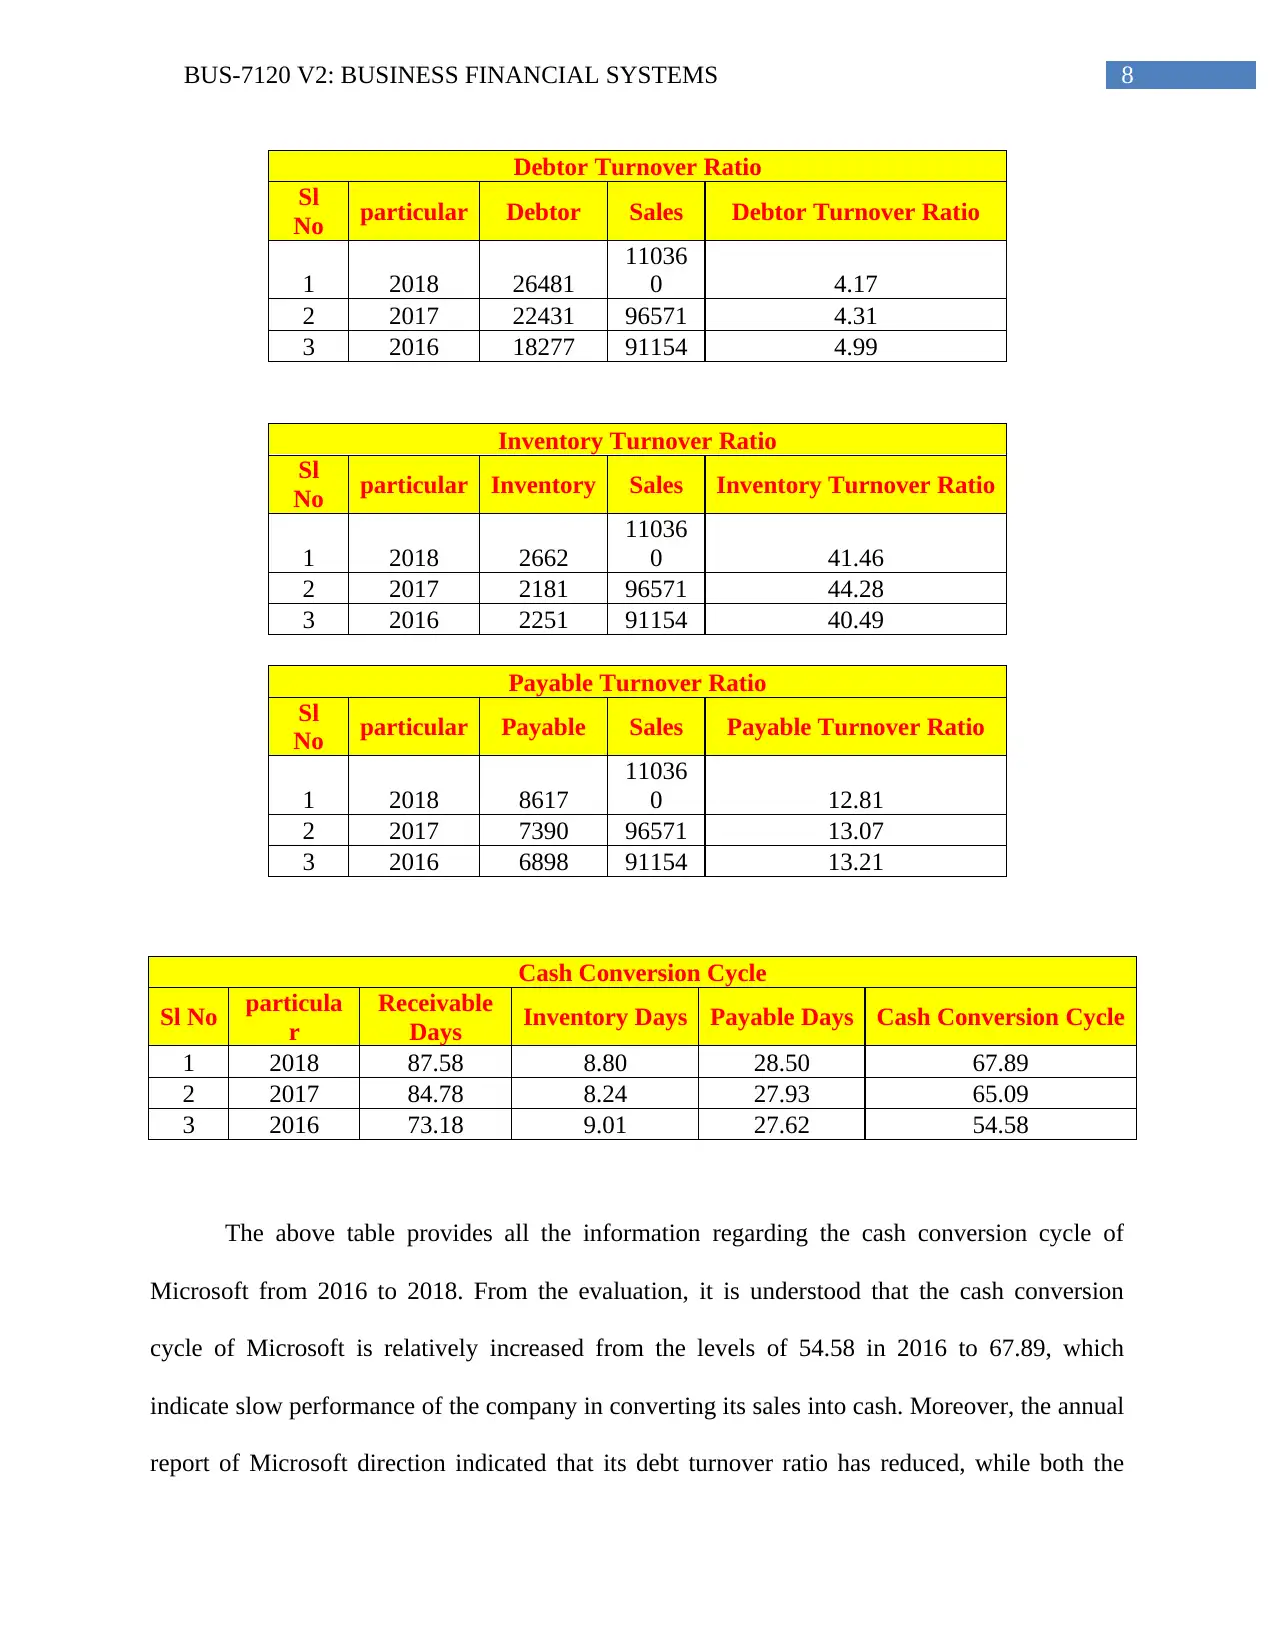
Debtor Turnover Ratio
Sl
No particular Debtor Sales Debtor Turnover Ratio
1 2018 26481
11036
0 4.17
2 2017 22431 96571 4.31
3 2016 18277 91154 4.99
Inventory Turnover Ratio
Sl
No particular Inventory Sales Inventory Turnover Ratio
1 2018 2662
11036
0 41.46
2 2017 2181 96571 44.28
3 2016 2251 91154 40.49
Payable Turnover Ratio
Sl
No particular Payable Sales Payable Turnover Ratio
1 2018 8617
11036
0 12.81
2 2017 7390 96571 13.07
3 2016 6898 91154 13.21
Cash Conversion Cycle
Sl No particula
r
Receivable
Days Inventory Days Payable Days Cash Conversion Cycle
1 2018 87.58 8.80 28.50 67.89
2 2017 84.78 8.24 27.93 65.09
3 2016 73.18 9.01 27.62 54.58
The above table provides all the information regarding the cash conversion cycle of
Microsoft from 2016 to 2018. From the evaluation, it is understood that the cash conversion
cycle of Microsoft is relatively increased from the levels of 54.58 in 2016 to 67.89, which
indicate slow performance of the company in converting its sales into cash. Moreover, the annual
report of Microsoft direction indicated that its debt turnover ratio has reduced, while both the
⊘ This is a preview!⊘
Do you want full access?
Subscribe today to unlock all pages.
Trusted by 1+ million students worldwide
9BUS-7120 V2: BUSINESS FINANCIAL SYSTEMS
inventory turnover ratio and payable turnover ratio has increased during the past three fiscal
years. The cash conversion conditions of Microsoft have declined, as the company is not able to
convert its overall inventory and credit sales into cash (Wahlen, Baginski & Bradshaw, 2014).
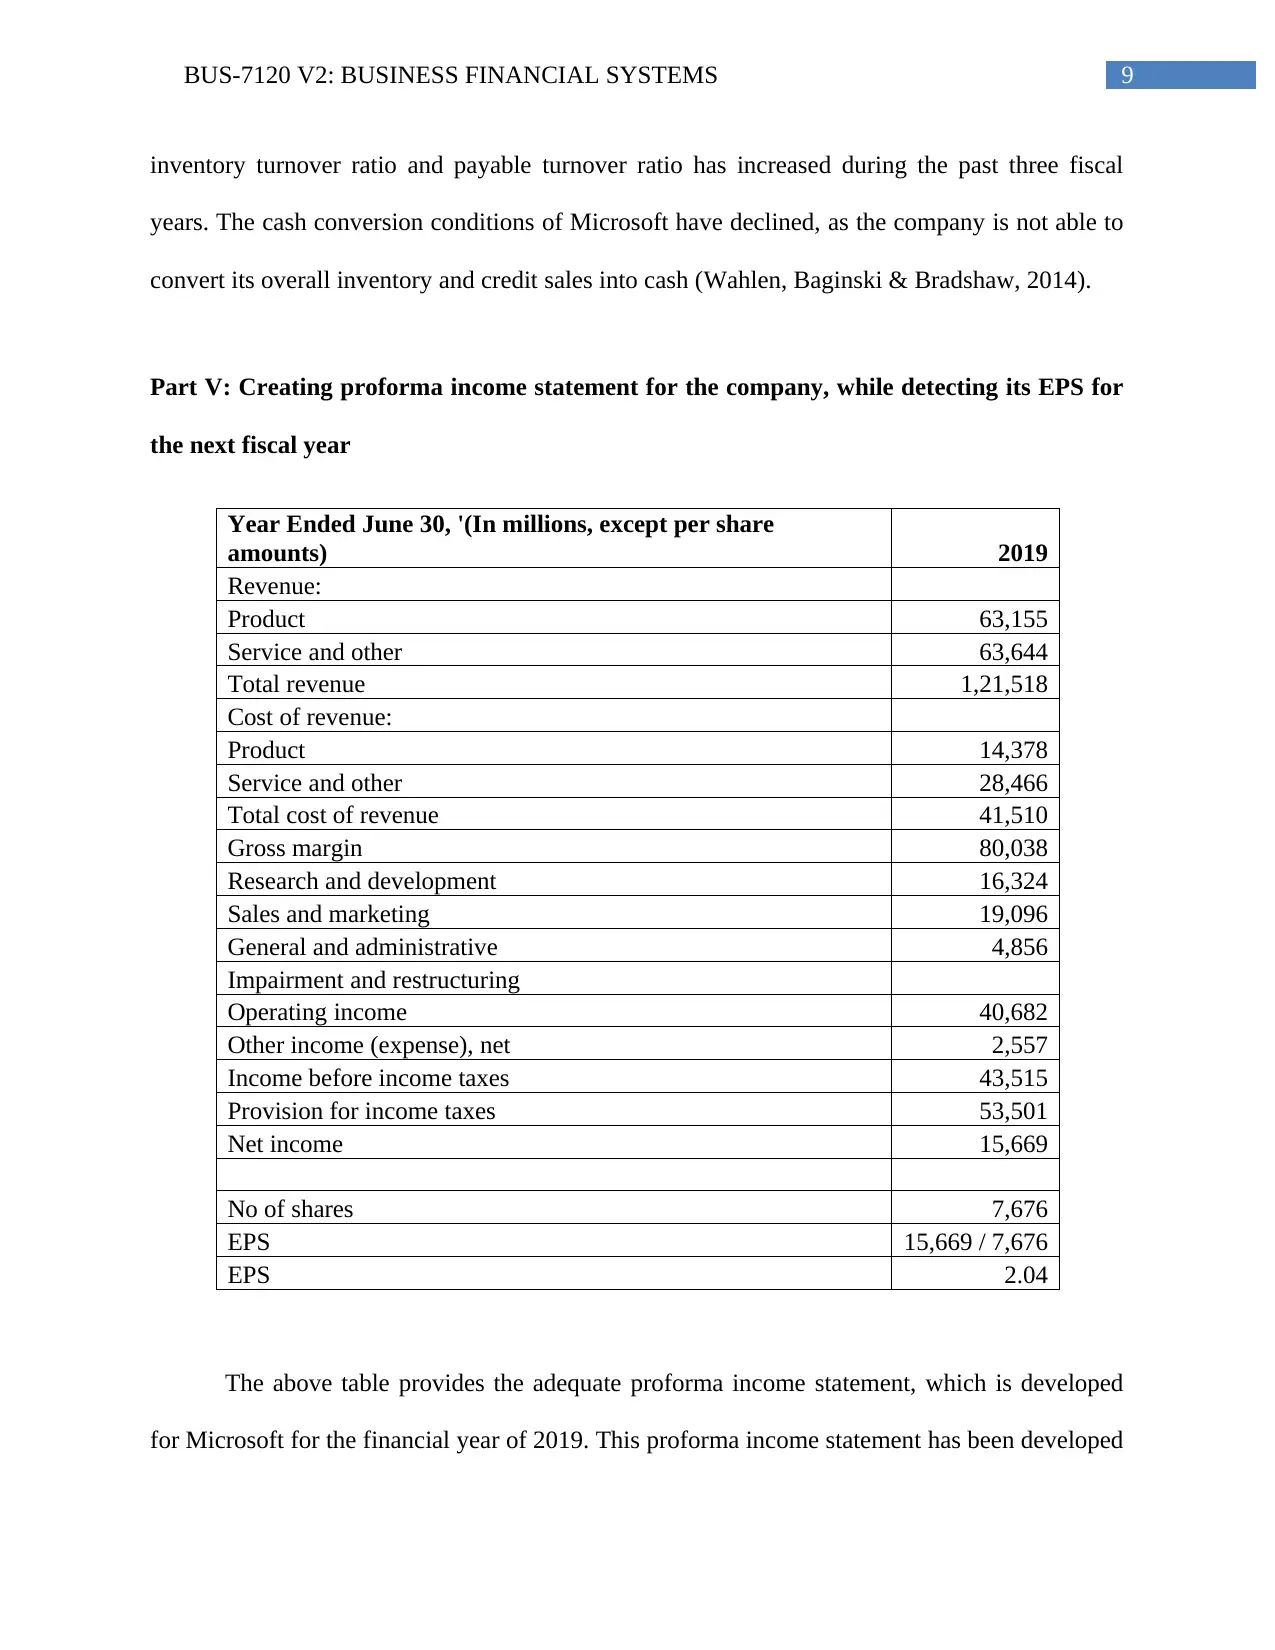
Part V: Creating proforma income statement for the company, while detecting its EPS for
the next fiscal year
Year Ended June 30, '(In millions, except per share
amounts) 2019
Revenue:
Product 63,155
Service and other 63,644
Total revenue 1,21,518
Cost of revenue:
Product 14,378
Service and other 28,466
Total cost of revenue 41,510
Gross margin 80,038
Research and development 16,324
Sales and marketing 19,096
General and administrative 4,856
Impairment and restructuring
Operating income 40,682
Other income (expense), net 2,557
Income before income taxes 43,515
Provision for income taxes 53,501
Net income 15,669
No of shares 7,676
EPS 15,669 / 7,676
EPS 2.04
The above table provides the adequate proforma income statement, which is developed
for Microsoft for the financial year of 2019. This proforma income statement has been developed
inventory turnover ratio and payable turnover ratio has increased during the past three fiscal
years. The cash conversion conditions of Microsoft have declined, as the company is not able to
convert its overall inventory and credit sales into cash (Wahlen, Baginski & Bradshaw, 2014).
Part V: Creating proforma income statement for the company, while detecting its EPS for
the next fiscal year
Year Ended June 30, '(In millions, except per share
amounts) 2019
Revenue:
Product 63,155
Service and other 63,644
Total revenue 1,21,518
Cost of revenue:
Product 14,378
Service and other 28,466
Total cost of revenue 41,510
Gross margin 80,038
Research and development 16,324
Sales and marketing 19,096
General and administrative 4,856
Impairment and restructuring
Operating income 40,682
Other income (expense), net 2,557
Income before income taxes 43,515
Provision for income taxes 53,501
Net income 15,669
No of shares 7,676
EPS 15,669 / 7,676
EPS 2.04
The above table provides the adequate proforma income statement, which is developed
for Microsoft for the financial year of 2019. This proforma income statement has been developed
Paraphrase This Document
Need a fresh take? Get an instant paraphrase of this document with our AI Paraphraser
10BUS-7120 V2: BUSINESS FINANCIAL SYSTEMS
with the help of adequate growth rate, which is derived from the values of the income statement
through 2016 to 2018. Therefore, the values of the income statement have been anticipated to
determine the level of net income that will be generated by the organization over the financial
year of 2019. This relatively helps in identifying the levels of EPS, which is anticipated to be at
the levels of 2.04 in 2019. This income statement has been created for identifying the level of
earnings per share for the financial year of 2019, which is used for further calculation (Almamy,
Aston & Ngwa, 2016).
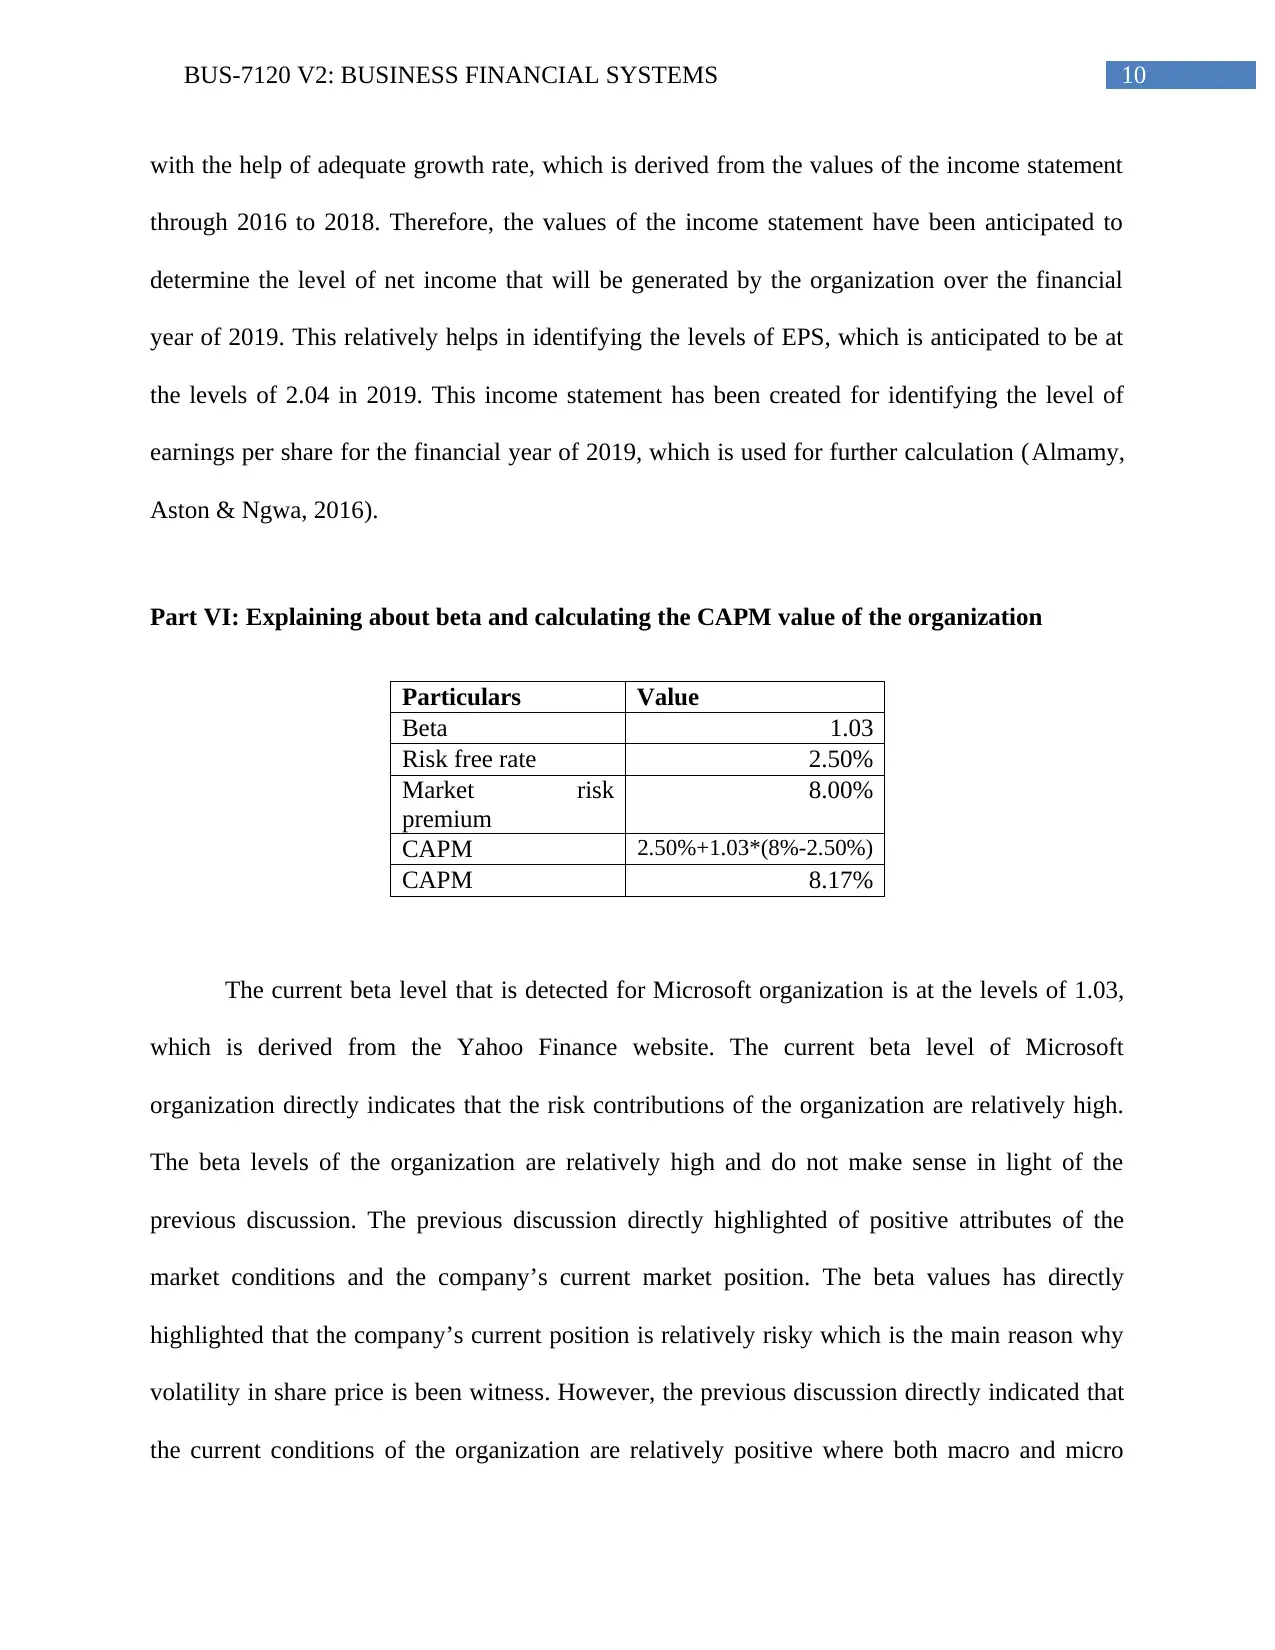
Part VI: Explaining about beta and calculating the CAPM value of the organization
Particulars Value
Beta 1.03
Risk free rate 2.50%
Market risk
premium
8.00%
CAPM 2.50%+1.03*(8%-2.50%)
CAPM 8.17%
The current beta level that is detected for Microsoft organization is at the levels of 1.03,
which is derived from the Yahoo Finance website. The current beta level of Microsoft
organization directly indicates that the risk contributions of the organization are relatively high.
The beta levels of the organization are relatively high and do not make sense in light of the
previous discussion. The previous discussion directly highlighted of positive attributes of the
market conditions and the company’s current market position. The beta values has directly
highlighted that the company’s current position is relatively risky which is the main reason why
volatility in share price is been witness. However, the previous discussion directly indicated that
the current conditions of the organization are relatively positive where both macro and micro
with the help of adequate growth rate, which is derived from the values of the income statement
through 2016 to 2018. Therefore, the values of the income statement have been anticipated to
determine the level of net income that will be generated by the organization over the financial
year of 2019. This relatively helps in identifying the levels of EPS, which is anticipated to be at
the levels of 2.04 in 2019. This income statement has been created for identifying the level of
earnings per share for the financial year of 2019, which is used for further calculation (Almamy,
Aston & Ngwa, 2016).
Part VI: Explaining about beta and calculating the CAPM value of the organization
Particulars Value
Beta 1.03
Risk free rate 2.50%
Market risk
premium
8.00%
CAPM 2.50%+1.03*(8%-2.50%)
CAPM 8.17%
The current beta level that is detected for Microsoft organization is at the levels of 1.03,
which is derived from the Yahoo Finance website. The current beta level of Microsoft
organization directly indicates that the risk contributions of the organization are relatively high.
The beta levels of the organization are relatively high and do not make sense in light of the
previous discussion. The previous discussion directly highlighted of positive attributes of the
market conditions and the company’s current market position. The beta values has directly
highlighted that the company’s current position is relatively risky which is the main reason why
volatility in share price is been witness. However, the previous discussion directly indicated that
the current conditions of the organization are relatively positive where both macro and micro
11BUS-7120 V2: BUSINESS FINANCIAL SYSTEMS
condition has indicated a positive attributes for Microsoft. Therefore, the high level of risk that is
endured by Microsoft is not being anticipated as per their beta values. The above table provides
adequate information regarding the calculated CAPM value for Microsoft, which is relatively at
the levels of 8.17%. This value is adequately derived from the CAPM formula, which helps in
determining the required rate of return of an organization (Barberis et al., 2015).
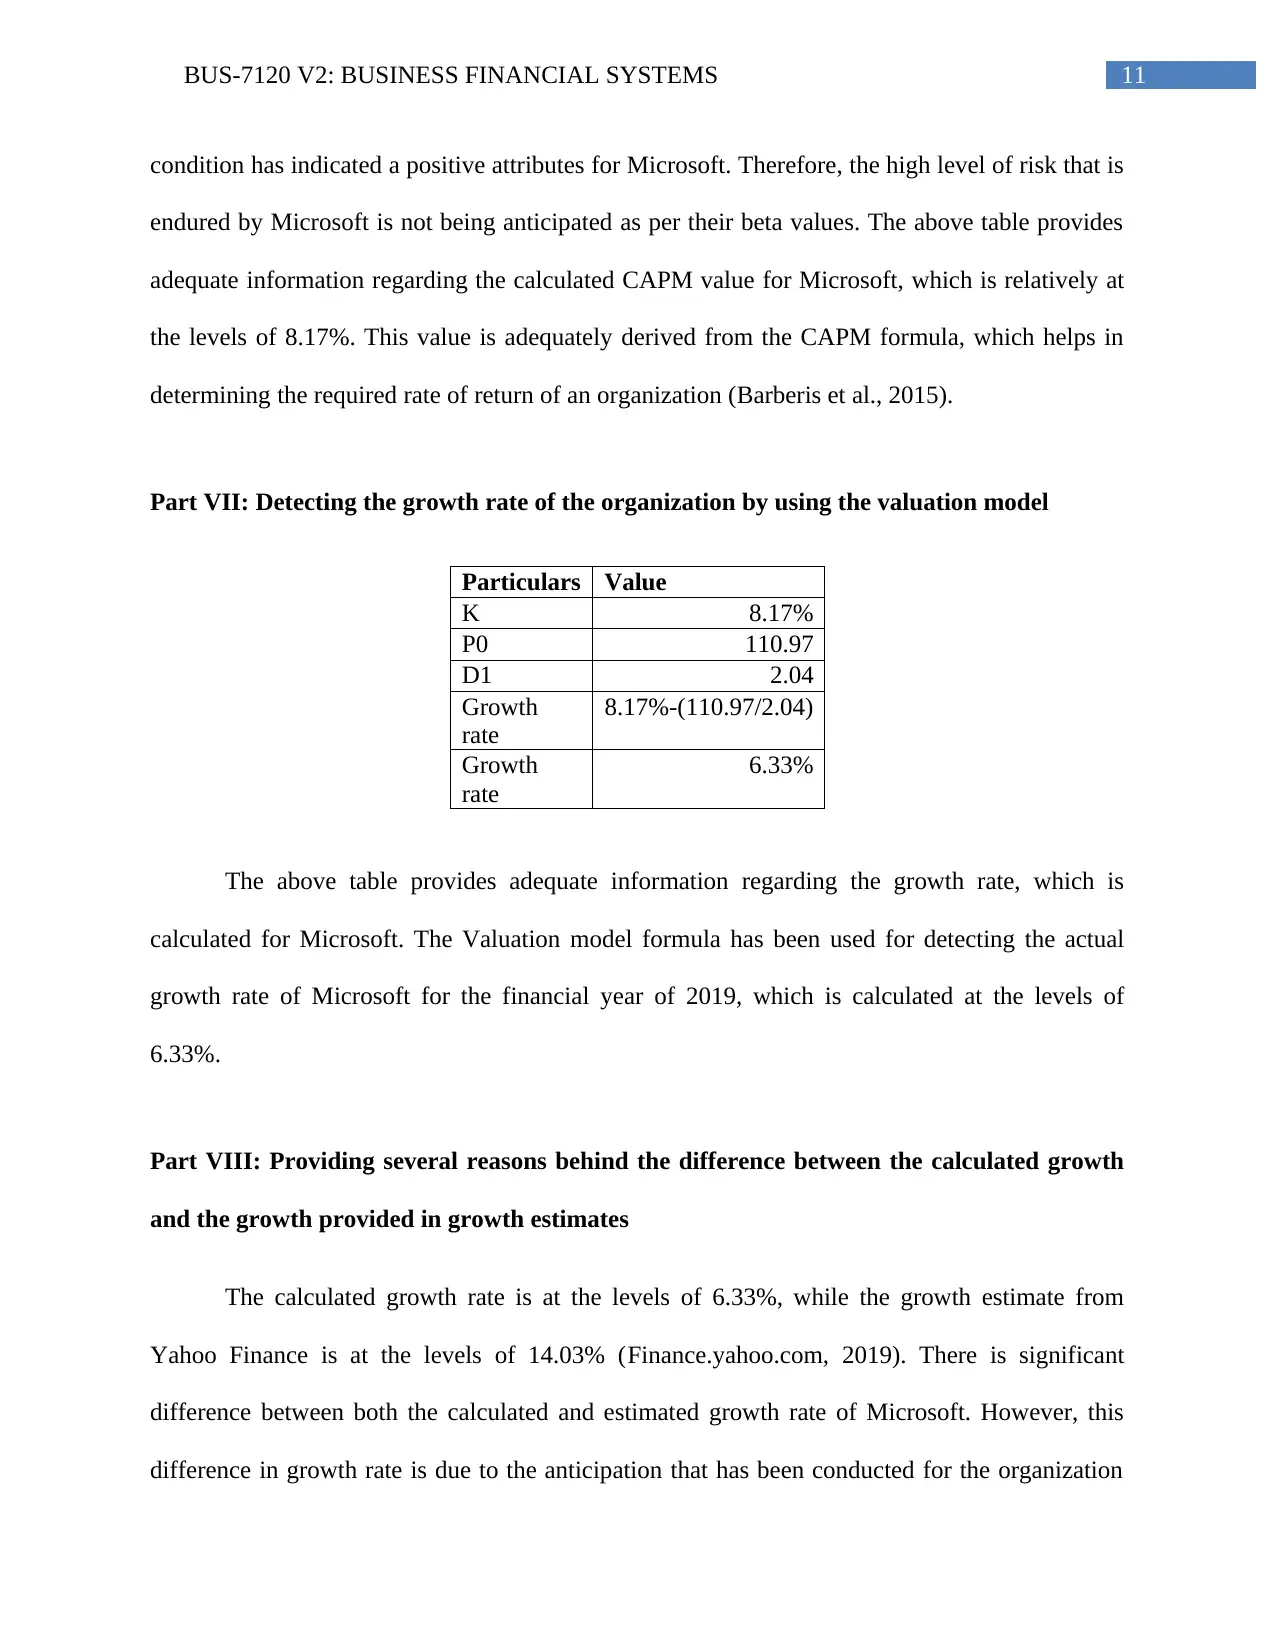
Part VII: Detecting the growth rate of the organization by using the valuation model
Particulars Value
K 8.17%
P0 110.97
D1 2.04
Growth
rate
8.17%-(110.97/2.04)
Growth
rate
6.33%
The above table provides adequate information regarding the growth rate, which is
calculated for Microsoft. The Valuation model formula has been used for detecting the actual
growth rate of Microsoft for the financial year of 2019, which is calculated at the levels of
6.33%.
Part VIII: Providing several reasons behind the difference between the calculated growth
and the growth provided in growth estimates
The calculated growth rate is at the levels of 6.33%, while the growth estimate from
Yahoo Finance is at the levels of 14.03% (Finance.yahoo.com, 2019). There is significant
difference between both the calculated and estimated growth rate of Microsoft. However, this
difference in growth rate is due to the anticipation that has been conducted for the organization
condition has indicated a positive attributes for Microsoft. Therefore, the high level of risk that is
endured by Microsoft is not being anticipated as per their beta values. The above table provides
adequate information regarding the calculated CAPM value for Microsoft, which is relatively at
the levels of 8.17%. This value is adequately derived from the CAPM formula, which helps in
determining the required rate of return of an organization (Barberis et al., 2015).
Part VII: Detecting the growth rate of the organization by using the valuation model
Particulars Value
K 8.17%
P0 110.97
D1 2.04
Growth
rate
8.17%-(110.97/2.04)
Growth
rate
6.33%
The above table provides adequate information regarding the growth rate, which is
calculated for Microsoft. The Valuation model formula has been used for detecting the actual
growth rate of Microsoft for the financial year of 2019, which is calculated at the levels of
6.33%.
Part VIII: Providing several reasons behind the difference between the calculated growth
and the growth provided in growth estimates
The calculated growth rate is at the levels of 6.33%, while the growth estimate from
Yahoo Finance is at the levels of 14.03% (Finance.yahoo.com, 2019). There is significant
difference between both the calculated and estimated growth rate of Microsoft. However, this
difference in growth rate is due to the anticipation that has been conducted for the organization
⊘ This is a preview!⊘
Do you want full access?
Subscribe today to unlock all pages.
Trusted by 1+ million students worldwide
1 out of 16
Related Documents


Your All-in-One AI-Powered Toolkit for Academic Success.
+13062052269
info@desklib.com
Available 24*7 on WhatsApp / Email
![[object Object]](/_next/static/media/star-bottom.7253800d.svg)
Unlock your academic potential
Copyright © 2020–2026 A2Z Services. All Rights Reserved. Developed and managed by ZUCOL.