Financial Strength and Weakness Analysis of Microsoft (2015)
VerifiedAdded on 2020/01/07
|7
|1229
|175
Report
AI Summary
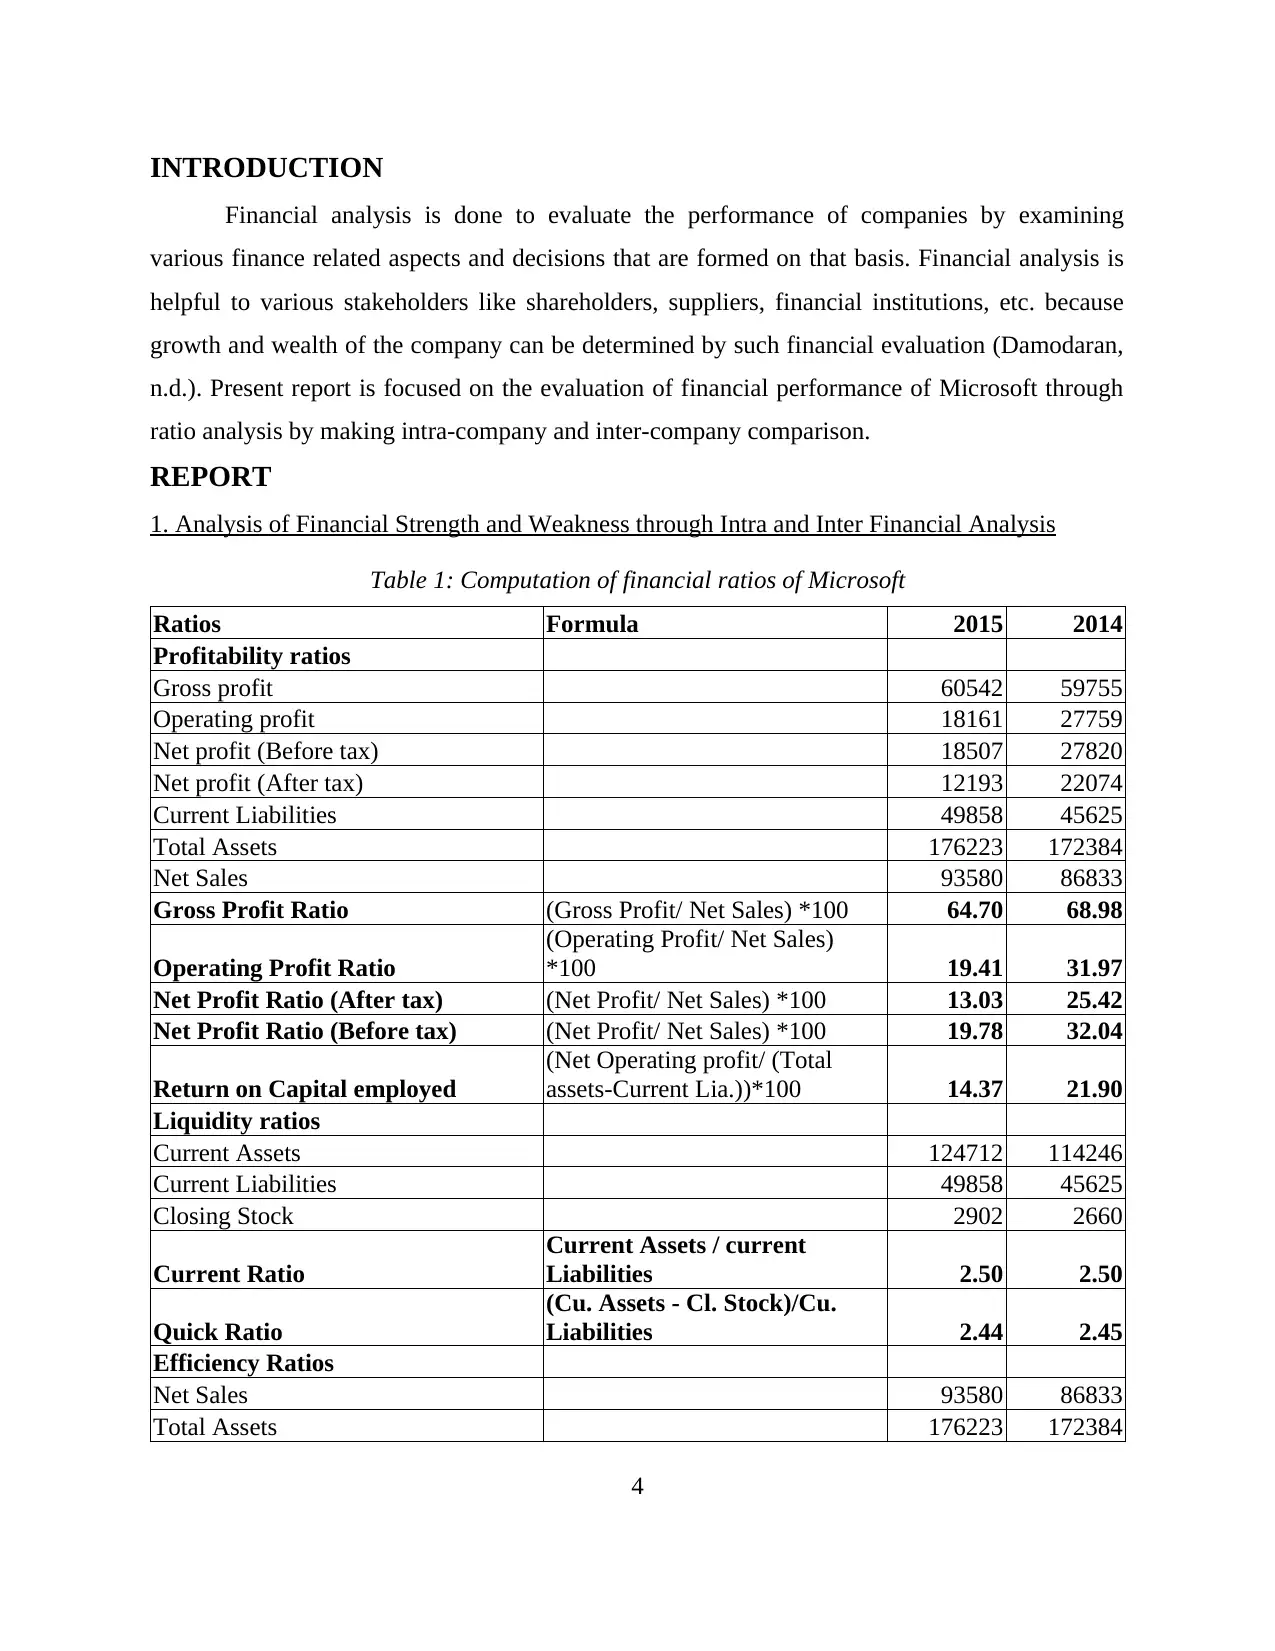
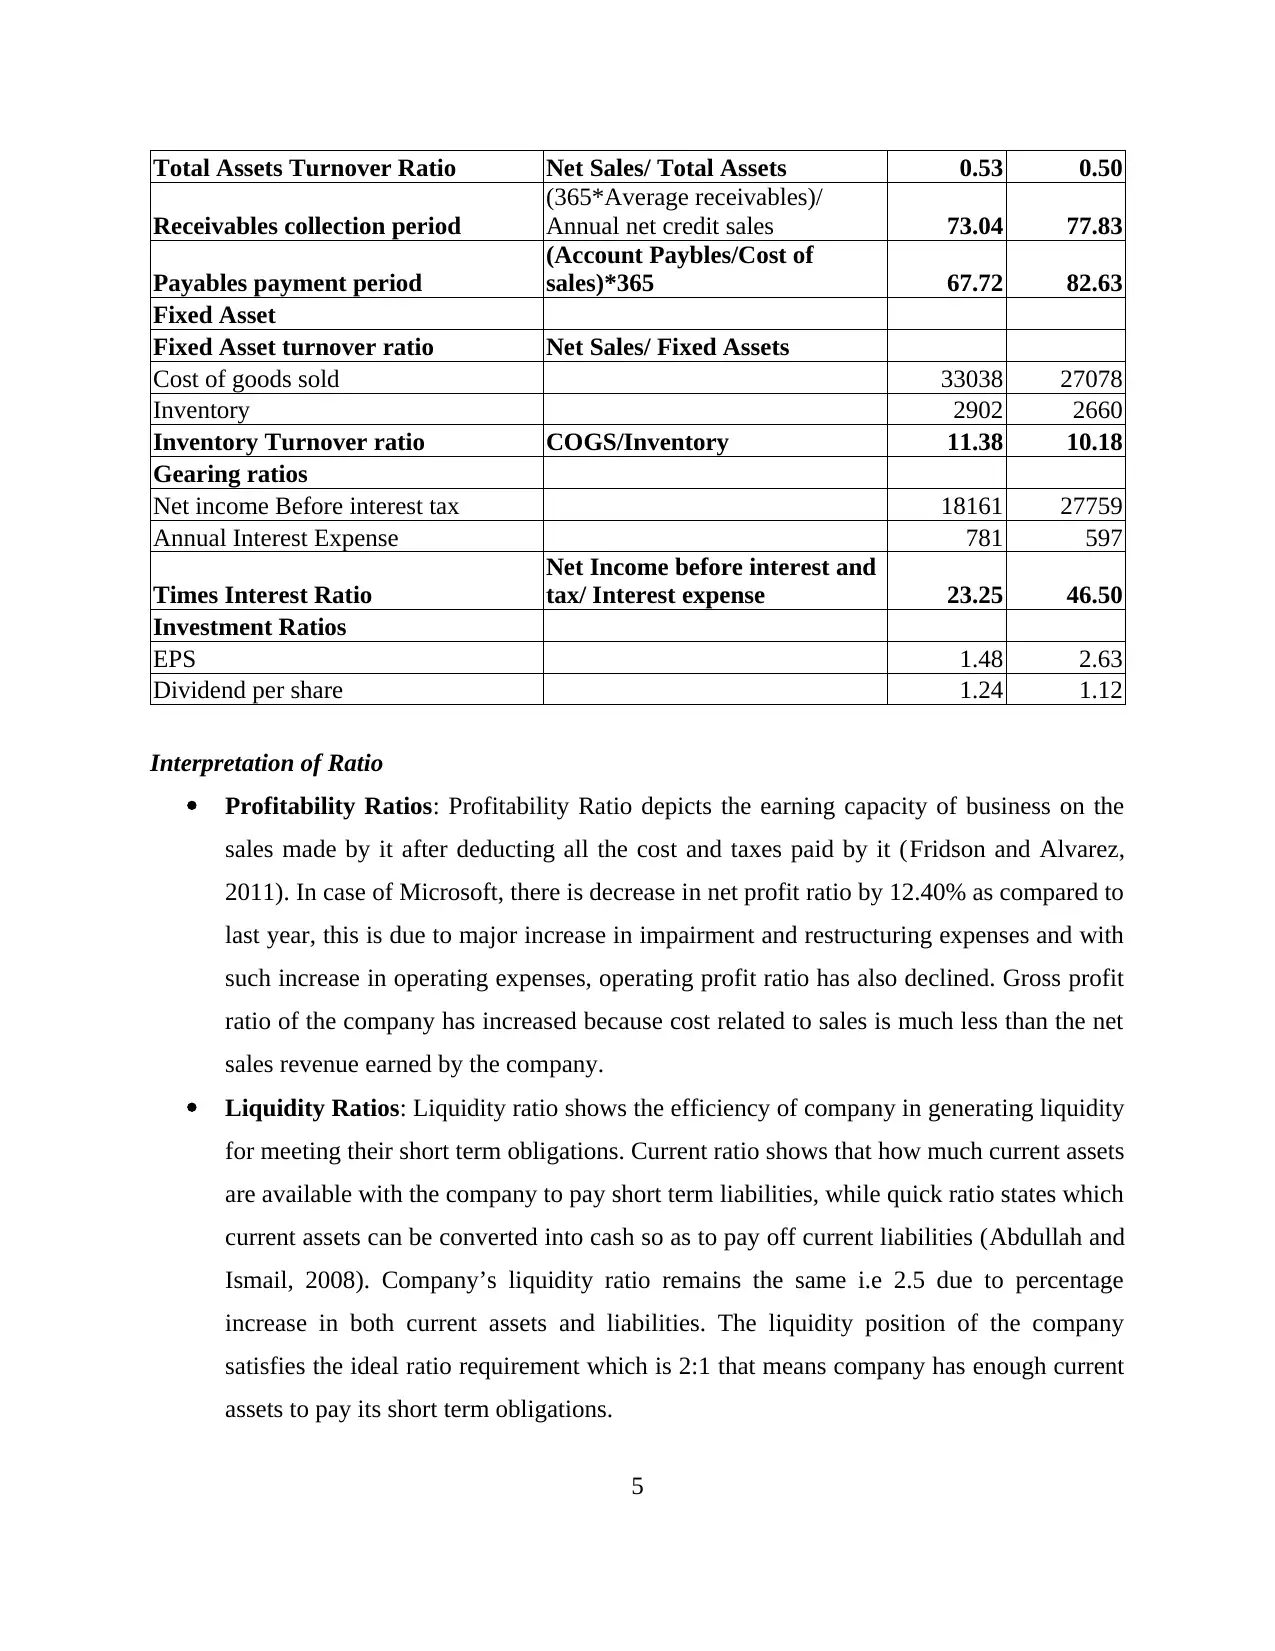
This report presents a financial analysis of Microsoft, focusing on its performance in 2015. The analysis employs various financial ratios, including profitability, liquidity, efficiency, gearing, and investment ratios, to evaluate the company's financial strength and weaknesses. The report provides a detailed computation of these ratios, comparing the results with the previous year (2014) to identify trends and changes in financial health. Key findings include a decrease in net profit ratio due to increased expenses, and a stable liquidity position. The report also discusses efficiency and gearing ratios, along with investment ratios, offering insights into Microsoft's financial management and investment strategies. The analysis is supported by references to relevant financial literature and Microsoft's annual reports.

Finance
Paraphrase This Document
Need a fresh take? Get an instant paraphrase of this document with our AI Paraphraser

TABLE OF CONTENTS
Introduction......................................................................................................................................3
Report ..............................................................................................................................................3
1. Analysis of Financial Strength and Weakness through Intra and Inter Financial Analysis.....3
Conclusion.......................................................................................................................................5
References........................................................................................................................................6
2

INDEX OF TABLES
Table 1: Computation of financial ratios of Microsoft....................................................................4
3
Table 1: Computation of financial ratios of Microsoft....................................................................4
3
⊘ This is a preview!⊘
Do you want full access?
Subscribe today to unlock all pages.

Trusted by 1+ million students worldwide

INTRODUCTION
Financial analysis is done to evaluate the performance of companies by examining
various finance related aspects and decisions that are formed on that basis. Financial analysis is
helpful to various stakeholders like shareholders, suppliers, financial institutions, etc. because
growth and wealth of the company can be determined by such financial evaluation (Damodaran,
n.d.). Present report is focused on the evaluation of financial performance of Microsoft through
ratio analysis by making intra-company and inter-company comparison.
REPORT
1. Analysis of Financial Strength and Weakness through Intra and Inter Financial Analysis
Table 1: Computation of financial ratios of Microsoft
Ratios Formula 2015 2014
Profitability ratios
Gross profit 60542 59755
Operating profit 18161 27759
Net profit (Before tax) 18507 27820
Net profit (After tax) 12193 22074
Current Liabilities 49858 45625
Total Assets 176223 172384
Net Sales 93580 86833
Gross Profit Ratio (Gross Profit/ Net Sales) *100 64.70 68.98
Operating Profit Ratio
(Operating Profit/ Net Sales)
*100 19.41 31.97
Net Profit Ratio (After tax) (Net Profit/ Net Sales) *100 13.03 25.42
Net Profit Ratio (Before tax) (Net Profit/ Net Sales) *100 19.78 32.04
Return on Capital employed
(Net Operating profit/ (Total
assets-Current Lia.))*100 14.37 21.90
Liquidity ratios
Current Assets 124712 114246
Current Liabilities 49858 45625
Closing Stock 2902 2660
Current Ratio
Current Assets / current
Liabilities 2.50 2.50
Quick Ratio
(Cu. Assets - Cl. Stock)/Cu.
Liabilities 2.44 2.45
Efficiency Ratios
Net Sales 93580 86833
Total Assets 176223 172384
4
Paraphrase This Document
Need a fresh take? Get an instant paraphrase of this document with our AI Paraphraser

Total Assets Turnover Ratio Net Sales/ Total Assets 0.53 0.50
Receivables collection period
(365*Average receivables)/
Annual net credit sales 73.04 77.83
Payables payment period
(Account Paybles/Cost of
sales)*365 67.72 82.63
Fixed Asset
Fixed Asset turnover ratio Net Sales/ Fixed Assets
Cost of goods sold 33038 27078
Inventory 2902 2660
Inventory Turnover ratio COGS/Inventory 11.38 10.18
Gearing ratios
Net income Before interest tax 18161 27759
Annual Interest Expense 781 597
Times Interest Ratio
Net Income before interest and
tax/ Interest expense 23.25 46.50
Investment Ratios
EPS 1.48 2.63
Dividend per share 1.24 1.12
Interpretation of Ratio
Profitability Ratios: Profitability Ratio depicts the earning capacity of business on the
sales made by it after deducting all the cost and taxes paid by it (Fridson and Alvarez,
2011). In case of Microsoft, there is decrease in net profit ratio by 12.40% as compared to
last year, this is due to major increase in impairment and restructuring expenses and with
such increase in operating expenses, operating profit ratio has also declined. Gross profit
ratio of the company has increased because cost related to sales is much less than the net
sales revenue earned by the company.
Liquidity Ratios: Liquidity ratio shows the efficiency of company in generating liquidity
for meeting their short term obligations. Current ratio shows that how much current assets
are available with the company to pay short term liabilities, while quick ratio states which
current assets can be converted into cash so as to pay off current liabilities (Abdullah and
Ismail, 2008). Company’s liquidity ratio remains the same i.e 2.5 due to percentage
increase in both current assets and liabilities. The liquidity position of the company
satisfies the ideal ratio requirement which is 2:1 that means company has enough current
assets to pay its short term obligations.
5

Efficiency Ratios: Efficiency ratio shows that in what manner the assets and obligations
are used and managed by the company so as to meet their organizational needs, or how
much the company is able to increase its revenues (Lau and Proimos, 2010). Microsoft is
able to increase its efficiency ratio because of increase in the total assets of the company
and the revenues generated by it. In addition to this, company had invested more in short
term investments and less increment in short and long term debts which contribute to
increase in efficiency of the company.
Gearing Ratios: Gearing ratio defines that how well the company manages its fund by
deciding proper proportions of debt and equity and how much of the owner capital is
used to pay its finance cost (Tracy, 2012). Gearing ratio of Microsoft has reduced as
compared to last year because company debt funds have been increased due to incurring
more interest cost and also the profitability of the company has reduced because of
increase in its operating expenses (Annual Report of Microsoft, 2015).
Investment ratio: Investment ratio simply states that how much a company is earning on
various investments that are made by the company, i.e what portion of net income is
finally available for distributing to its owners (Tracy, 2012). Investment ratio of
Microsoft declines because earnings had reduced resulting in low earning per share as
well as low dividend per share.
6
⊘ This is a preview!⊘
Do you want full access?
Subscribe today to unlock all pages.

Trusted by 1+ million students worldwide

REFERENCES
Books
Fridson, S. M. and Alvarez, F., 2011. Financial Statement Analysis: A Practitioner's Guide. 4th
ed. Wiley.
Tracy, A., 2012. Ratio Analysis Fundamentals: How 17 Financial Ratios Can Allow You to
Analyse Any Business on the Planet. RatioAnalysis.net.
Journals
Abdullah, B. A. and Ismail, K. I. N. K., 2008. Disclosure of Voluntary Accounting Ratios by
Malaysian Listed Companies. Journal of Financial Reporting and Accounting. 6 (1).
pp.1 - 20.
Lau, B. and Proimos, A., 2010. The underperformance of equity‐financed bidders. International
Journal of Managerial Finance. 6 (1). pp.4 - 23.
Online
Damodaran. A. n.d. Financial Statement Analysis. [PDF]. Available through
<http://people.stern.nyu.edu/adamodar/pdfiles/invphiloh/finstatement.pdf>. [Accessed on
25th December 2015].
Annual Report of Microsoft. 2015. [Online]. Available through
<http://www.microsoft.com/investor/reports/ar15/index.html>. [Accessed on 25th
December 2015].
7
1 out of 7
Related Documents

Your All-in-One AI-Powered Toolkit for Academic Success.
+13062052269
info@desklib.com
Available 24*7 on WhatsApp / Email
Unlock your academic potential
Copyright © 2020–2025 A2Z Services. All Rights Reserved. Developed and managed by ZUCOL.