Financial Analysis: Microsoft Corporation Report for Finance Course

Verified

Added on  2023/04/26

|17
|1202
|50
Report
AI Summary
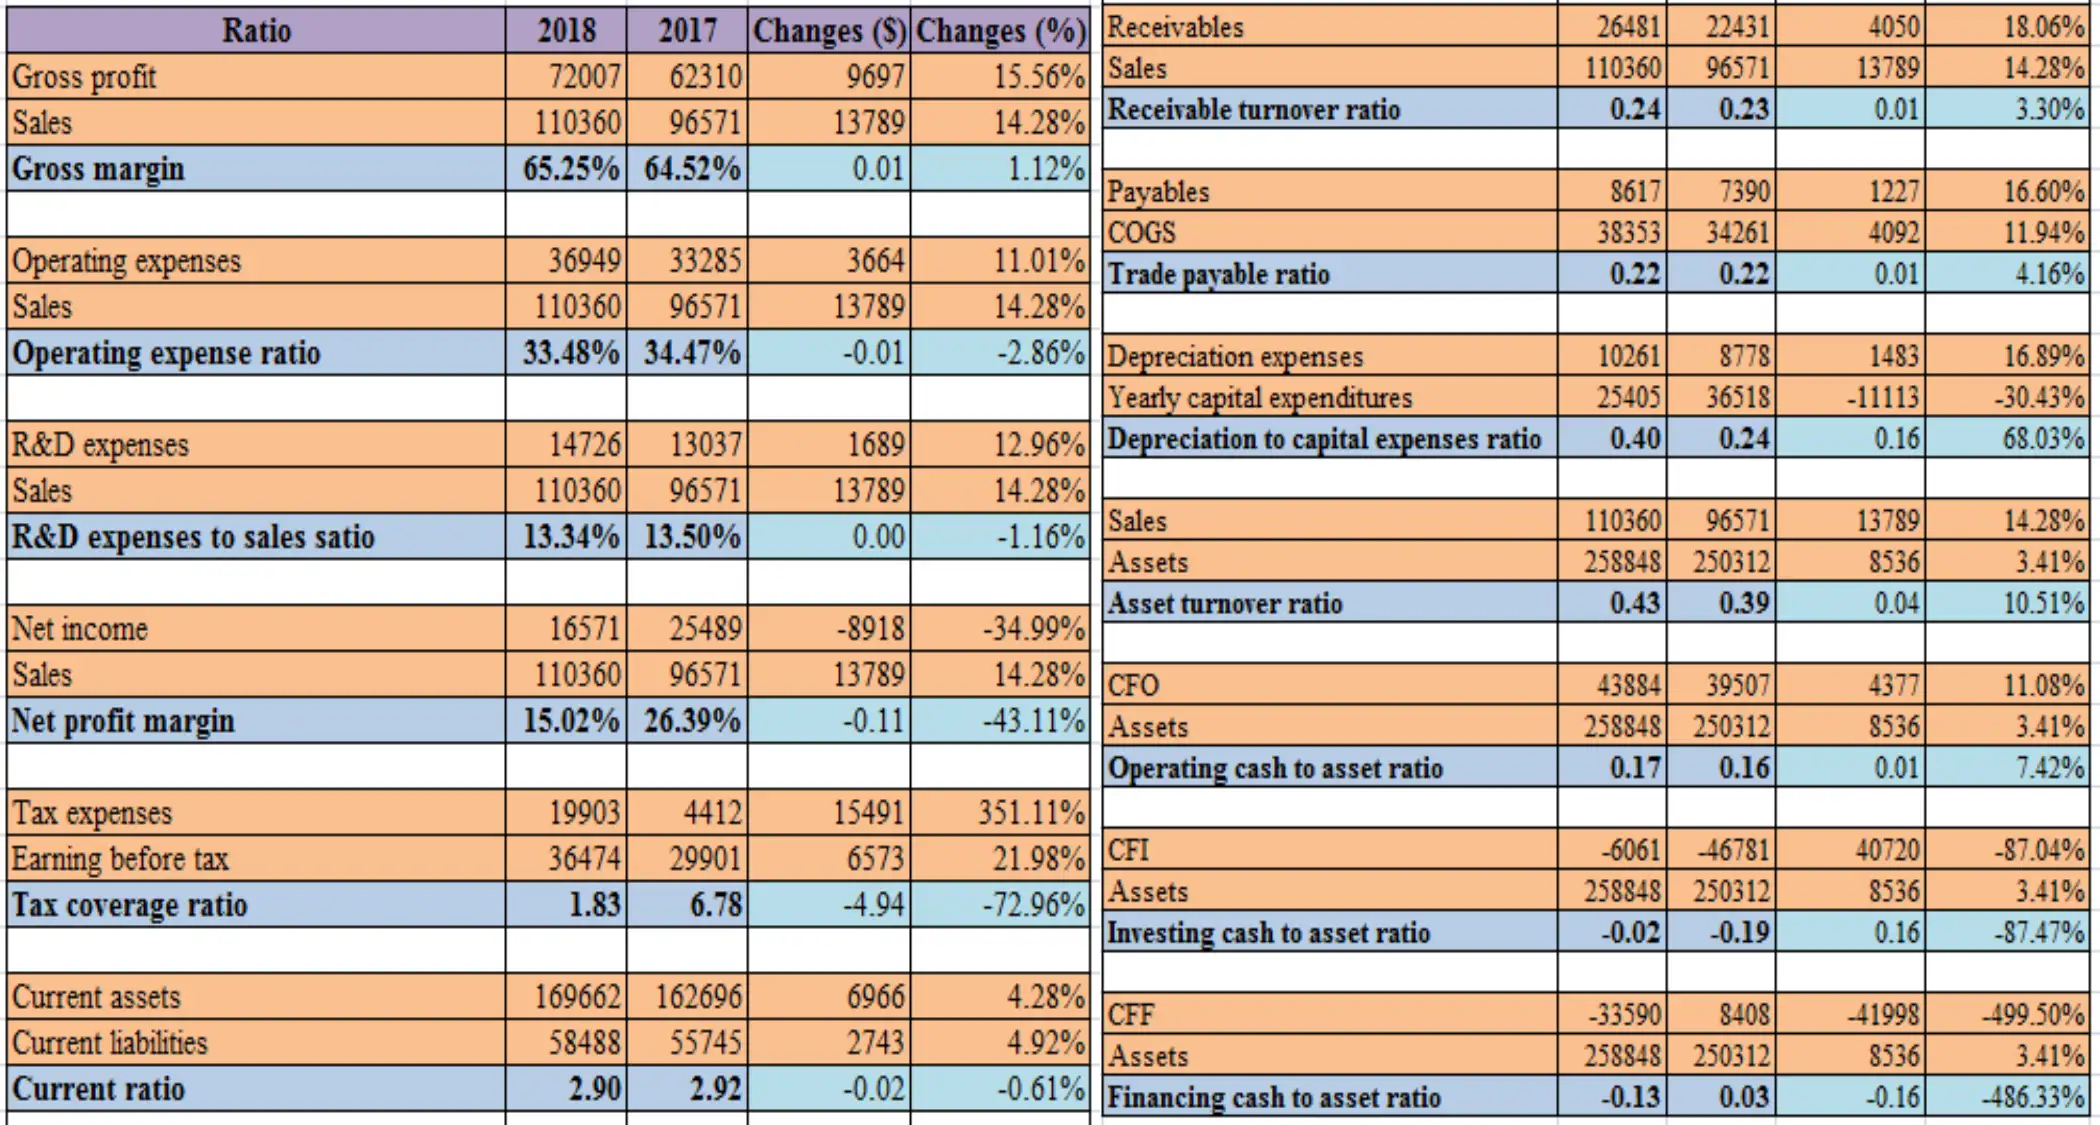
This financial analysis report assesses Microsoft's financial performance by examining various financial ratios and metrics from 2017 to 2018. The analysis covers gross profit margin, operating expense ratio, R&D expenses to sales ratio, net profit margin, tax coverage ratio, and current ratio. It also evaluates receivable turnover, trade payable ratio, depreciation to capital expense ratio, asset turnover ratio, and cash flow related ratios. The report indicates improvements in gross margin and asset turnover, but deterioration in net profit margin and liquidity. The increase in receivable turnover signifies delays in collecting dues from debtors. Overall, the report provides a comprehensive view of Microsoft's financial health and efficiency in utilizing its assets.
Document Page
ACCOUNTING FINANCIAL ANALYSIS REPORT
NAME OF THE STUDENT
NAME OF THE UNIVERSITY
STUDENT ID
tabler-icon-diamond-filled.svg

Paraphrase This Document

Need a fresh take? Get an instant paraphrase of this document with our AI Paraphraser
Document Page
Document Page
Gross profit
Sales
Gross margin
Operating expenses
Sales
Operating expense ratio
R&D expenses
Sales
R&D expenses to sales satio
Net income
Sales
Net profit margin
Tax expenses
Earning before tax
Tax coverage ratio
Current assets
Current liabilities
Current ratio
Receivables
Sales
Receivable turnover ratio
Payables
COGS
Trade payable ratio
Depreciation expenses
Yearly capital expenditures
Depreciation to capital expenses ratio
Sales
Assets
Asset turnover ratio
CFO
Assets
Operating cash to asset ratio
CFI
Assets
Investing cash to asset ratio
CFF
Assets
Financing cash to asset ratio
-50000
0
50000
100000
150000
200000
250000
300000
2018
2017
Changes ($)
Changes (%)
Document Page
Gross margin of the company that represents the earnings available with the
firm after making payment for COGS has been increased by 1.12% from 2017
to 2018. The increase was due to the fact that the revenue percentage
increased more than the increase in the COGS percentage
tabler-icon-diamond-filled.svg

Paraphrase This Document

Need a fresh take? Get an instant paraphrase of this document with our AI Paraphraser
Document Page
Operating expenses ratio of the company that represents the earnings
available with the firm after making payment for operational expenses
has been reduced by 2.86% from 2017 to 2018. The reduction was due
to the fact that the impairment and restructuring expenses came down
to nil. It represents the company has improved in its expenses aspect.
Document Page
R&D expenses to sales ratio of the company has been reduced by
1.16% from 2017 to 2018. The increase was due to the fact that the
revenue percentage increased more than the increase in the R&D
expense percentage
Document Page
Net profit margin of the company that represents the earnings available
with the firm after meeting all the expenses has been reduced by
43.11% from 2017 to 2018. The reduction was due to the fact that the
operational expenses increase percentage was more than the increase
in the sales percentage.
tabler-icon-diamond-filled.svg

Paraphrase This Document

Need a fresh take? Get an instant paraphrase of this document with our AI Paraphraser
Document Page
Tax coverage ratio of the company that represents the earnings available
with the firm for making tax related payment has been reduced from
6.78 times to 1.83 times from 2017 to 2018. The reduction was due to the
fact that the tax percentage increased more than the increase in the net
profit percentage
Document Page
Current ratio that represents the liquidity position of the company is
indicating that the liquidity status of the company has been
deteriorated as the company’s current ratio reduced fro 2.92 to 2.90
over the period from 2017 to 2018.
Document Page
Receivable turnover ratio of the company has been increased from 0.23 to
0.24. Increase in the receivables ratio is indicating that the company is
taking more time in collecting its dues from debtors. Hence, the
receivable position of the entity has been deteriorated over the years.
tabler-icon-diamond-filled.svg

Paraphrase This Document

Need a fresh take? Get an instant paraphrase of this document with our AI Paraphraser
Document Page
Trade payable ratio of the company has been stable at 0.22 over the years
from 2017 to 2018. it is indicating that the time taken by the company for
paying its payables due to the suppliers are maintained at the same rate
and payables are paid in regular interval.
Document Page
Depreciation to capital expense ratio that represents the depreciation
expenses of the entity with regard to its capital expenses has been
increased by 68.03%. The reason behind it is that the depreciation
expenses has been increased, however, yearly capital expenditure
chevron_up_icon
1 out of 17
circle_padding
hide_on_mobile
zoom_out_icon
[object Object]