Cost of Capital Analysis for Midland Energy Resources (FIN 632)
VerifiedAdded on 2021/11/17
|8
|1650
|61
Report
AI Summary
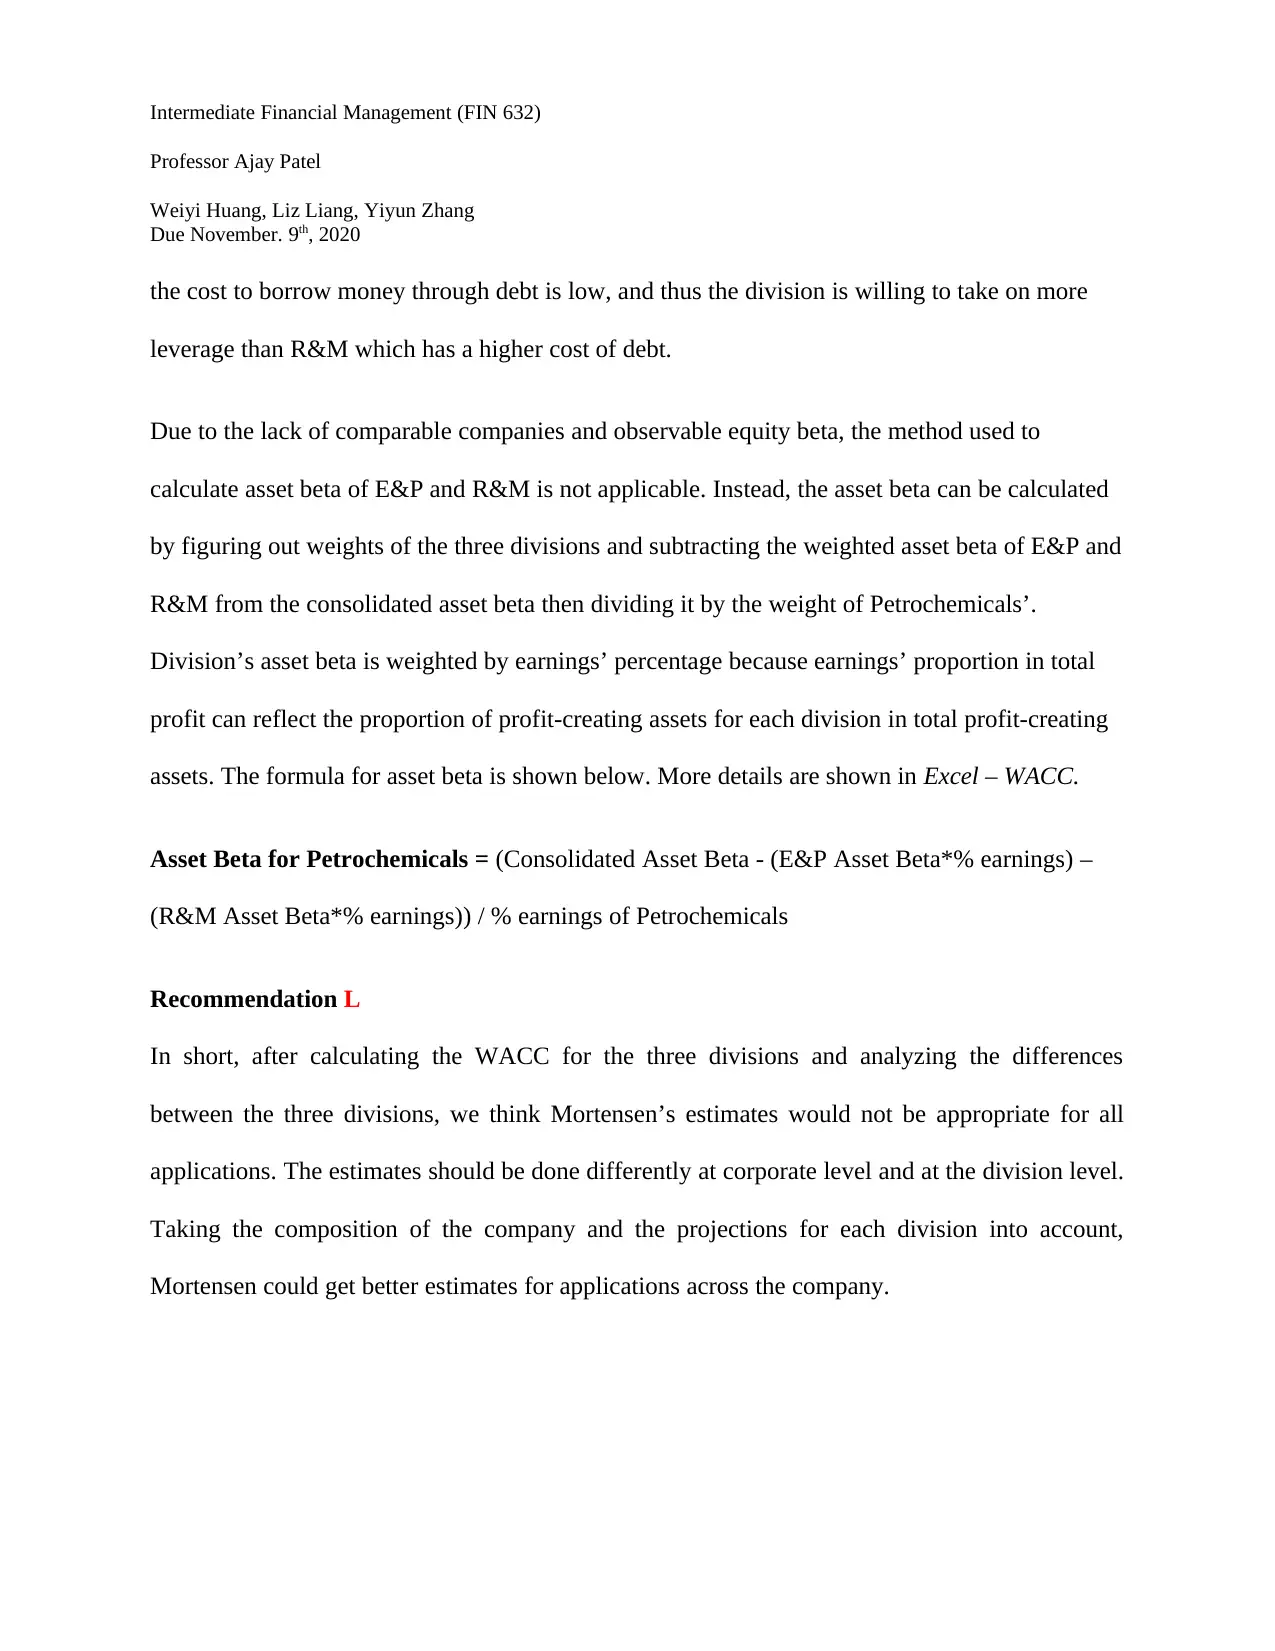
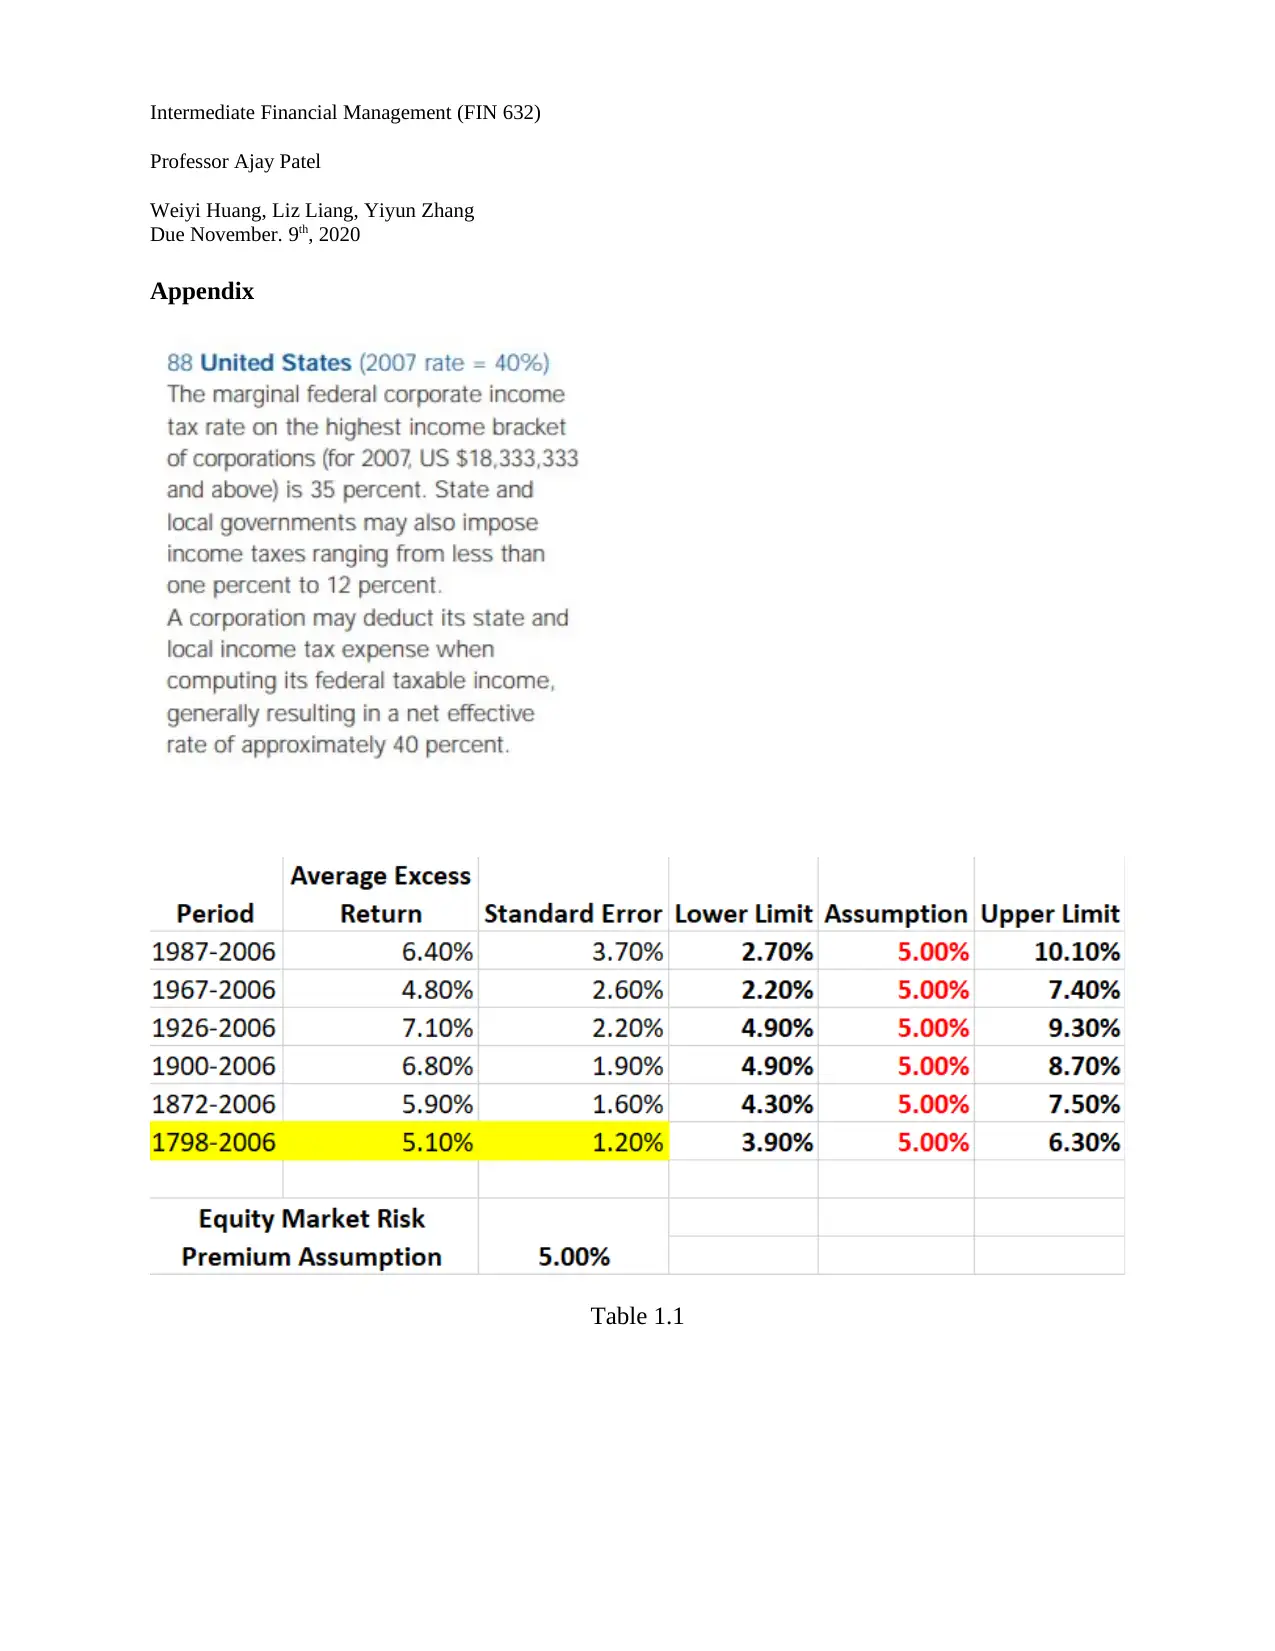
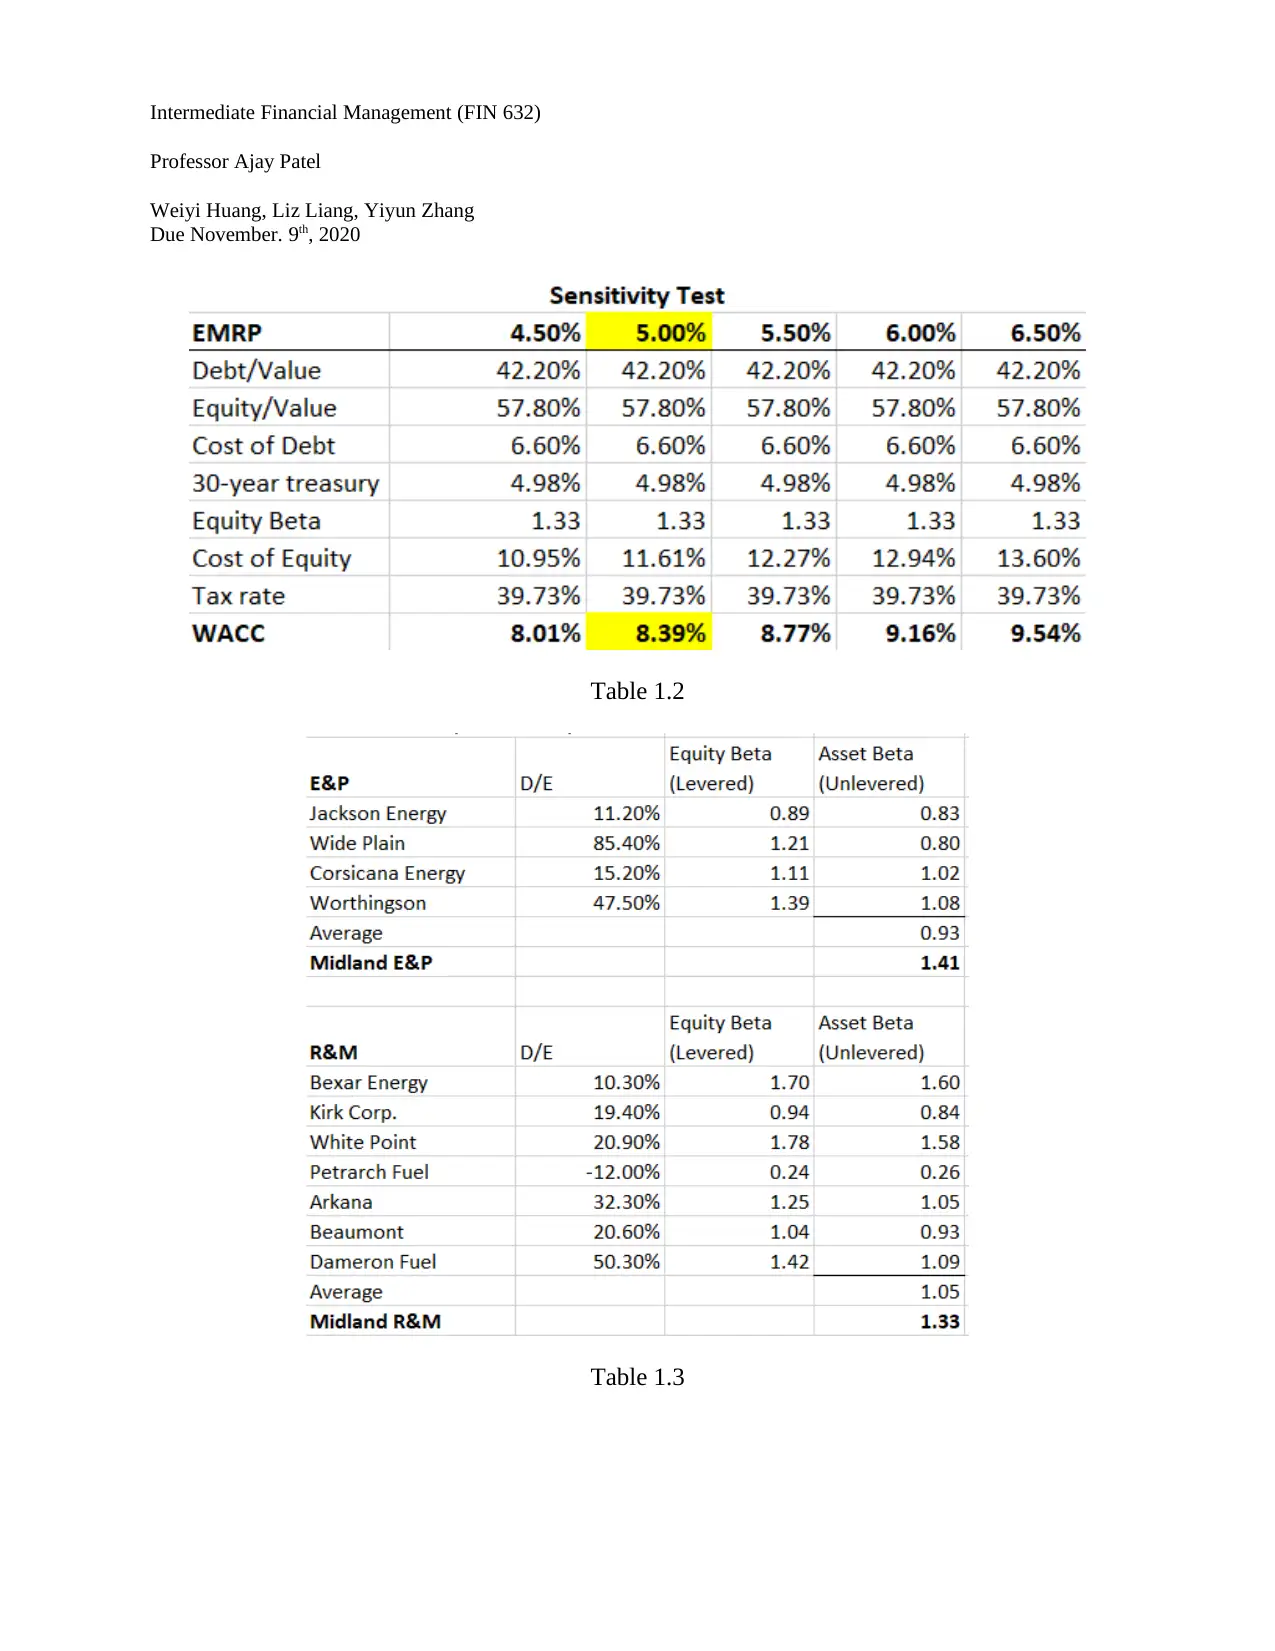
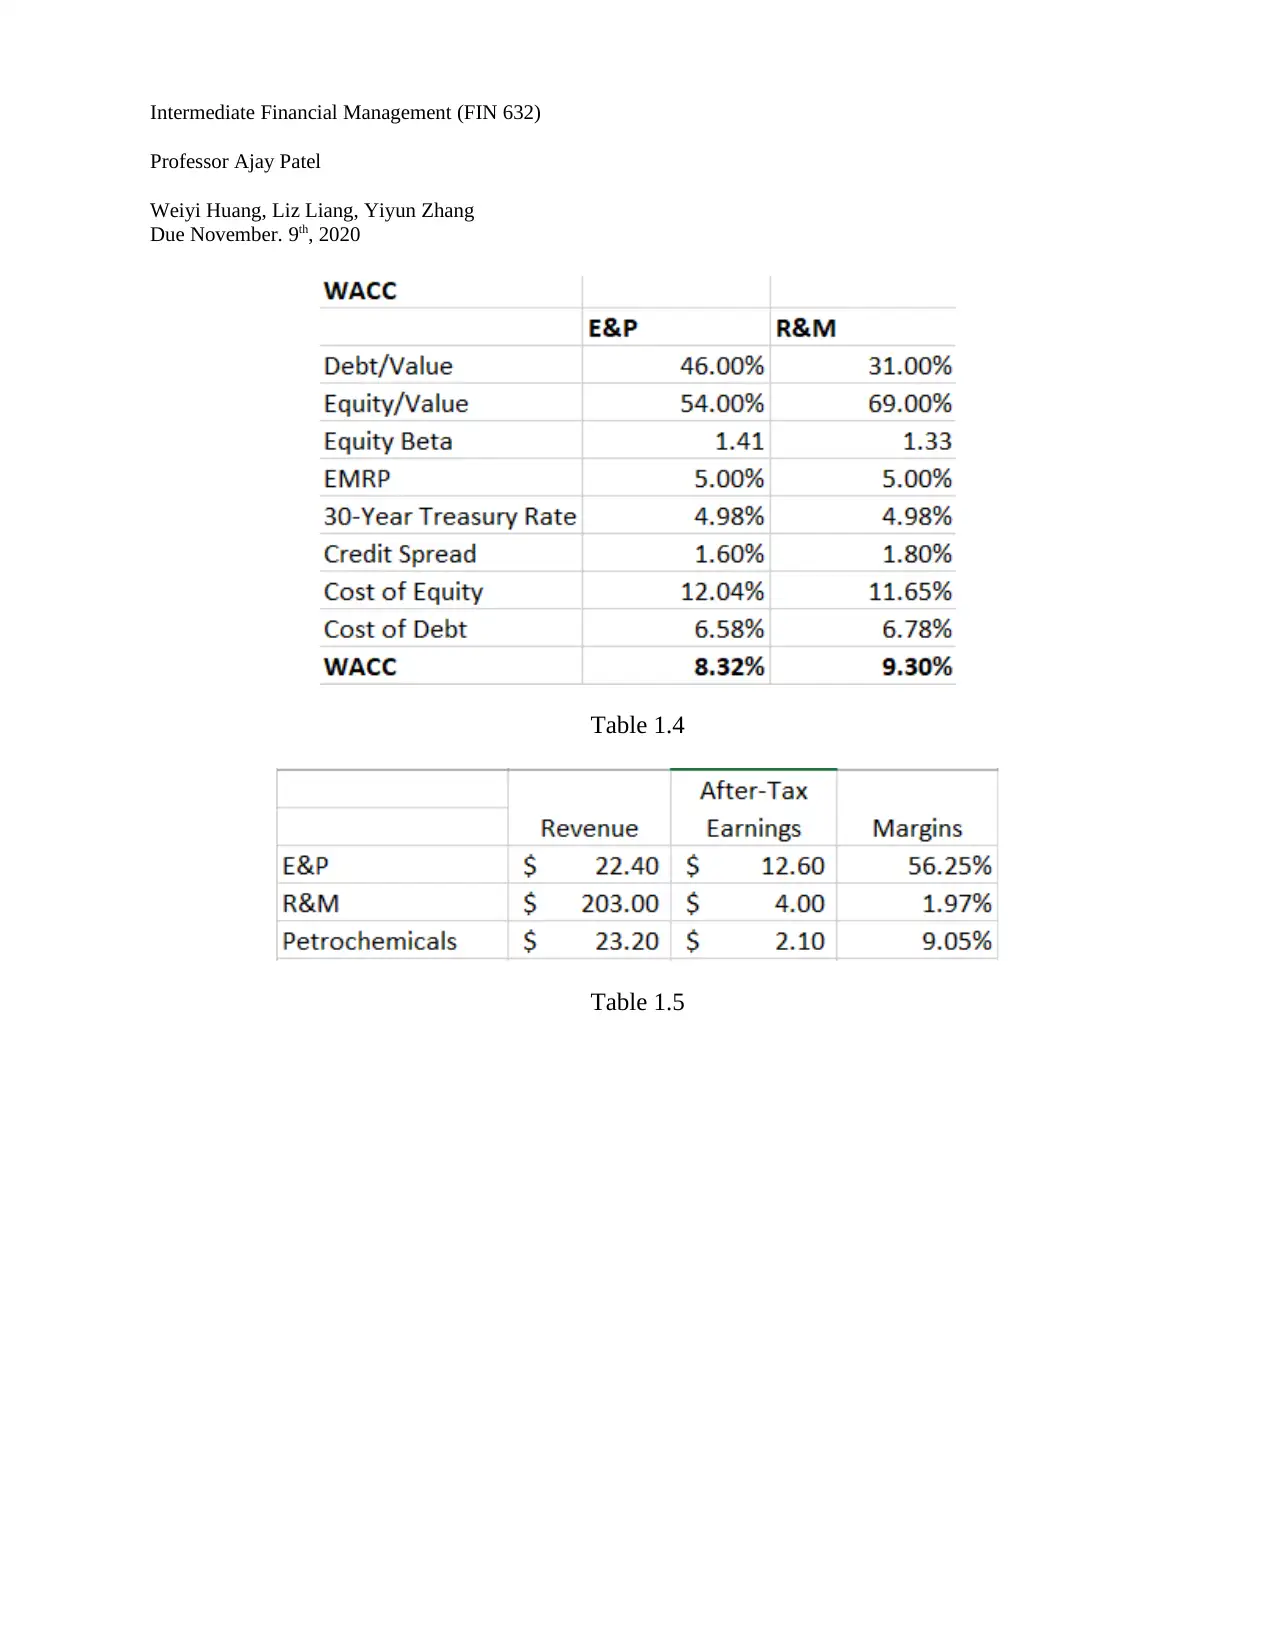
This report provides a comprehensive cost of capital analysis for Midland Energy Resources, Inc. The analysis begins with an executive summary that highlights the goal of minimizing costs and optimizing capital structure. The report then delves into the case problem, which involves assessing the appropriateness of the CFO's cost of capital calculations at both the corporate and divisional levels. The report calculates a consolidated WACC of 8.39% and recommends separate WACC calculations for the company's three divisions: Exploration & Production, Refining and Marketing, and Petrochemicals, with results of 8.32%, 9.30%, and 7.05%, respectively. The analysis includes assumptions regarding tax rates, risk-free rates, and the equity market risk premium. The report also explores the differences in WACC across the divisions, considering factors such as profitability, credit ratings, capital spending, and target capital structures. Sensitivity analysis is performed, and recommendations are made for the application of different hurdle rates based on the company's projections for each division. The report uses data from exhibits and comparable companies to support its findings and provides detailed calculations for the cost of debt and equity. The report concludes that Mortensen’s estimates would not be appropriate for all applications and suggests better estimates for different levels.

Intermediate Financial Management (FIN 632)
Professor Ajay Patel
Weiyi Huang, Liz Liang, Yiyun Zhang
Due November. 9th, 2020
Midland Energy Resources, Inc. :Cost of Capital Analysis
Executive Summary
Aiming to minimize costs, maximize profits, optimize capital structure and make better
investment decisions, we provide Midland Energy with a cost of capital that is able to support
appropriate applications. After careful consideration and evaluation of the company, we
calculated a consolidated WACC equals to 8.39%. Besides, we recommend that the company’s
three divisions: Exploration & Production, Refining and Marketing, and Petrochemicals calculate
their own WACC. The results are 8.32%, 9.30%, and 7.05% respectively.
Case Problem
Janet Mortensen, the CFO of Midland Energy, has been doing the estimations of cost of capital
for Midland Energy since 2002. After years of exercise, her calculations for the estimates had
become standards for most of the analyses within Midland. Therefore, she wants to know
whether her calculations were appropriate for all applications, at the division level and at the
corporate level.
Case Context
Since the three divisions of Midland Energy have huge differences in profit margin, capital
structure and future development, separate cost of capital should be calculated to satisfy different
application needs within each division. Moreover, data selected to support the estimation of
corporate level cost of capital should reflect considerations regarding overall performance of the
industry, financial performance and develop strategy of Midland Energy and elimination of non-
related factors when using data from comparable companies.
Paraphrase This Document
Need a fresh take? Get an instant paraphrase of this document with our AI Paraphraser

Intermediate Financial Management (FIN 632)
Professor Ajay Patel
Weiyi Huang, Liz Liang, Yiyun Zhang
Due November. 9th, 2020
Case Analysis
To calculate Midland’s WACC, several assumptions had to be made. First is the tax rate for the
company. We took three years’ income before tax and taxes paid from Exhibit 1, then used taxes
divided by income before tax to get tax rates each year. We took the average of the three years’
tax rate, 39.73%, and used the average to calculate WACC. To check if a tax rate of 39.73% for
Midland is appropriate, we found historical data on corporate income tax in 2007 from a survey
conducted by KPMG (Figure 1.1). It is stated that for a corporation in the highest income tax
bracket (income of $18,333,333 and above), net effective tax rate is approximately 40 percent.
Thus, using 39.73% as Midland’s tax rate seems reasonable.
Since the calculation of both cost of debt and cost of equity need risk free rate and EMRP,
appropriate selection of data that fit Midland Energy Resources the most is important.
Considering the nature of the oil and gas reserve industry, the average lifespan of oil or gas fields
is around 15 to 30 years and related productions can operate even longer. Life cycle of this
industry is rather long. In addition, Midland Energy Resources is a well-developed corporation
with a long history and fairly large size with over 8,000 employees. Based on all the
considerations above, we chose yield to maturity of 30-year U.S. Treasury bond, 4.98%, rather
than that of 1-year and 10-year.
As for the EMRP, the estimation made by CFO is 5.0%. We consider this assumption
appropriate. First, this estimation was made with thorough considerations regarding recent
research, professional advisors’ suggestions, and industry analysis. Second, according to historic

Intermediate Financial Management (FIN 632)
Professor Ajay Patel
Weiyi Huang, Liz Liang, Yiyun Zhang
Due November. 9th, 2020
data and studies in Exhibit 6, average excess return for the longest period of 1798-2006 is 5.1%,
basically consistent with CFO’s estimation. Standard error for this period is the smallest, so
return for this period has rather small probability of deviation. Also, the assumption of 5.0% falls
in every range (Table1.1). So historic data supports the assumption as well.
For the 2007 corporate WACC, as discussed above, we chose to use 39.73% for the tax rate, 5%
for the EMRP, and 4.98% for the risk-free rate. By adding up the consolidated credit spread of
1.2% and the risk-free rate, we get 6.6% for the cost of debt. Using the asset beta of 1.25
provided, we get 1.33 for the equity beta so the cost of equity should be 11.61%. Since the
company’s target debt/value is 42.2%, plugging all data in the WACC formula, we get the
corporate WACC to be 8.39%. We also conducted a sensitivity analysis for WACC, changing
the market risk premium from 4.5% to 6.5% to cover all historical risk premiums. The resulting
WACC ranges from 8.01% to 9.54%, and the average sits at 8.77%. (Table 1.2)
Midland should not use a single hurdle rate for all of its divisions because the three divisions are
different in many aspects so the required rate of return should also be different. Some of the
differences between the three divisions are their profitability, credit ratings, and their projected
capital spending. The profit margin for E&P is 56%, while for R&M and Petrochemicals, it is
only 2% and 9% respectively. The credit rating is A+ for E&P, BBB for R&M, and AA- for
Petrochemical. Moreover, the projected capital spending for the three divisions are different.
Capital spending in E&P and Petrochemicals are expected to grow while capital spending in
R&M is expected to be stable. Therefore, considering all the differences among the three
⊘ This is a preview!⊘
Do you want full access?
Subscribe today to unlock all pages.

Trusted by 1+ million students worldwide

Intermediate Financial Management (FIN 632)
Professor Ajay Patel
Weiyi Huang, Liz Liang, Yiyun Zhang
Due November. 9th, 2020
divisions, different hurdle rates should be applied based on the company’s projections for each of
the divisions.
To calculate WACC for Exploration & Production and Refining and Marketing divisions, we
used target capital structure given in Table 1 to get the weight of debt and equity. Equity beta is
calculated using comparable companies’ data. We took the average of the unlevered asset betas
of each division’s comparable companies, and used the average as the equity beta in calculating
division WACC. (Table 1.3 Cost of debt is calculated using credit spread plus risk free rate,
where credit spread corresponded to the division’s credit rating. The lower the rating, the higher
the credit spread and thus the cost of debt, and vice versa. (Table 1.4)
There are several factors contributing to the difference in WACC between R&M and E&P. The
first is that target capital structure differs, causing the weight of debt and equity in each division
to differ. Another key factor is the difference in credit ratings. While E&P holds A+ rating,
R&M only has BBB rating. As mentioned above, the lower the credit rating, the higher the
potential risk and thus cost of capital would be greater. The difference in ratings comes from the
nature and characteristics of each division. E&P has steady production, high margins(56.25%)
among the industry and among the divisions in Midland company, and potential future growth in
demand. In comparison, although R&M’s revenue was the largest among all divisions, the
margin is significantly lower than E&P’s margin.(Table 1.5) With a steadily declining margin of
1.97%, together with difficulty in expansion, the rate of R&M’s rating is lower. Rating could
also explain the reason behind different target capital structures. For E&P which holds A+ rating,
Paraphrase This Document
Need a fresh take? Get an instant paraphrase of this document with our AI Paraphraser

Intermediate Financial Management (FIN 632)
Professor Ajay Patel
Weiyi Huang, Liz Liang, Yiyun Zhang
Due November. 9th, 2020
the cost to borrow money through debt is low, and thus the division is willing to take on more
leverage than R&M which has a higher cost of debt.
Due to the lack of comparable companies and observable equity beta, the method used to
calculate asset beta of E&P and R&M is not applicable. Instead, the asset beta can be calculated
by figuring out weights of the three divisions and subtracting the weighted asset beta of E&P and
R&M from the consolidated asset beta then dividing it by the weight of Petrochemicals’.
Division’s asset beta is weighted by earnings’ percentage because earnings’ proportion in total
profit can reflect the proportion of profit-creating assets for each division in total profit-creating
assets. The formula for asset beta is shown below. More details are shown in Excel – WACC.
Asset Beta for Petrochemicals = (Consolidated Asset Beta - (E&P Asset Beta*% earnings) –
(R&M Asset Beta*% earnings)) / % earnings of Petrochemicals
Recommendation L
In short, after calculating the WACC for the three divisions and analyzing the differences
between the three divisions, we think Mortensen’s estimates would not be appropriate for all
applications. The estimates should be done differently at corporate level and at the division level.
Taking the composition of the company and the projections for each division into account,
Mortensen could get better estimates for applications across the company.

Intermediate Financial Management (FIN 632)
Professor Ajay Patel
Weiyi Huang, Liz Liang, Yiyun Zhang
Due November. 9th, 2020
Appendix
Table 1.1
Professor Ajay Patel
Weiyi Huang, Liz Liang, Yiyun Zhang
Due November. 9th, 2020
Appendix
Table 1.1
⊘ This is a preview!⊘
Do you want full access?
Subscribe today to unlock all pages.

Trusted by 1+ million students worldwide

Intermediate Financial Management (FIN 632)
Professor Ajay Patel
Weiyi Huang, Liz Liang, Yiyun Zhang
Due November. 9th, 2020
Table 1.2
Table 1.3
Professor Ajay Patel
Weiyi Huang, Liz Liang, Yiyun Zhang
Due November. 9th, 2020
Table 1.2
Table 1.3
Paraphrase This Document
Need a fresh take? Get an instant paraphrase of this document with our AI Paraphraser

Intermediate Financial Management (FIN 632)
Professor Ajay Patel
Weiyi Huang, Liz Liang, Yiyun Zhang
Due November. 9th, 2020
Table 1.4
Table 1.5
Professor Ajay Patel
Weiyi Huang, Liz Liang, Yiyun Zhang
Due November. 9th, 2020
Table 1.4
Table 1.5
1 out of 8
Related Documents

Your All-in-One AI-Powered Toolkit for Academic Success.
+13062052269
info@desklib.com
Available 24*7 on WhatsApp / Email
Unlock your academic potential
Copyright © 2020–2025 A2Z Services. All Rights Reserved. Developed and managed by ZUCOL.