Comprehensive Analysis of Migrant Labour Data and Statistics
VerifiedAdded on 2020/04/21
|10
|1483
|146
Report
AI Summary
This report presents a statistical analysis of migrant labour data, focusing on gender, wages, and employment characteristics. The study utilizes descriptive statistics to summarize the data, revealing key insights such as the distribution of male and female workers, wage disparities, and the types of businesses employing migrant labourers. Inferential statistics, including t-tests and chi-square tests, are employed to examine relationships between variables, such as the impact of gender on wages and the association between gender and migrant status. The analysis reveals statistically significant differences in wages between male and female migrant workers and highlights an association between gender and migrant worker status. The report concludes by summarizing the key findings and their implications for understanding migrant labour dynamics.
Running head: COMMUNICATION AND INFORMATION TECHNOLOGY
Communication and information technology
Name of the student
Name of the university
Author’s note
Communication and information technology
Name of the student
Name of the university
Author’s note
Paraphrase This Document
Need a fresh take? Get an instant paraphrase of this document with our AI Paraphraser
1COMMUNICATION AND INFORMATION TECHNOLOGY
Table of Contents
Introduction......................................................................................................................................2
Descriptive Statistics.......................................................................................................................2
Inferential Statistics.........................................................................................................................5
Conclusion.......................................................................................................................................7
References........................................................................................................................................8
2COMMUNICATION AND INFORMATION TECHNOLOGY
Introduction
In this assignment we have analysed the data on migrant labourers. Migrant labourers
form a large part of the labour force. The labour force has different levels of education. They
work in different businesses. There is also a difference in businesses organization. According to
research done by Näre (2015) there is a significant relationship between gender and migrant
workers. Similarly, according to research done by Farris (2015) it is seen that female migrant
labourers are mostly employed in the reproduction sector. We in the present assignment study
the relation between migrant labourers and gender.
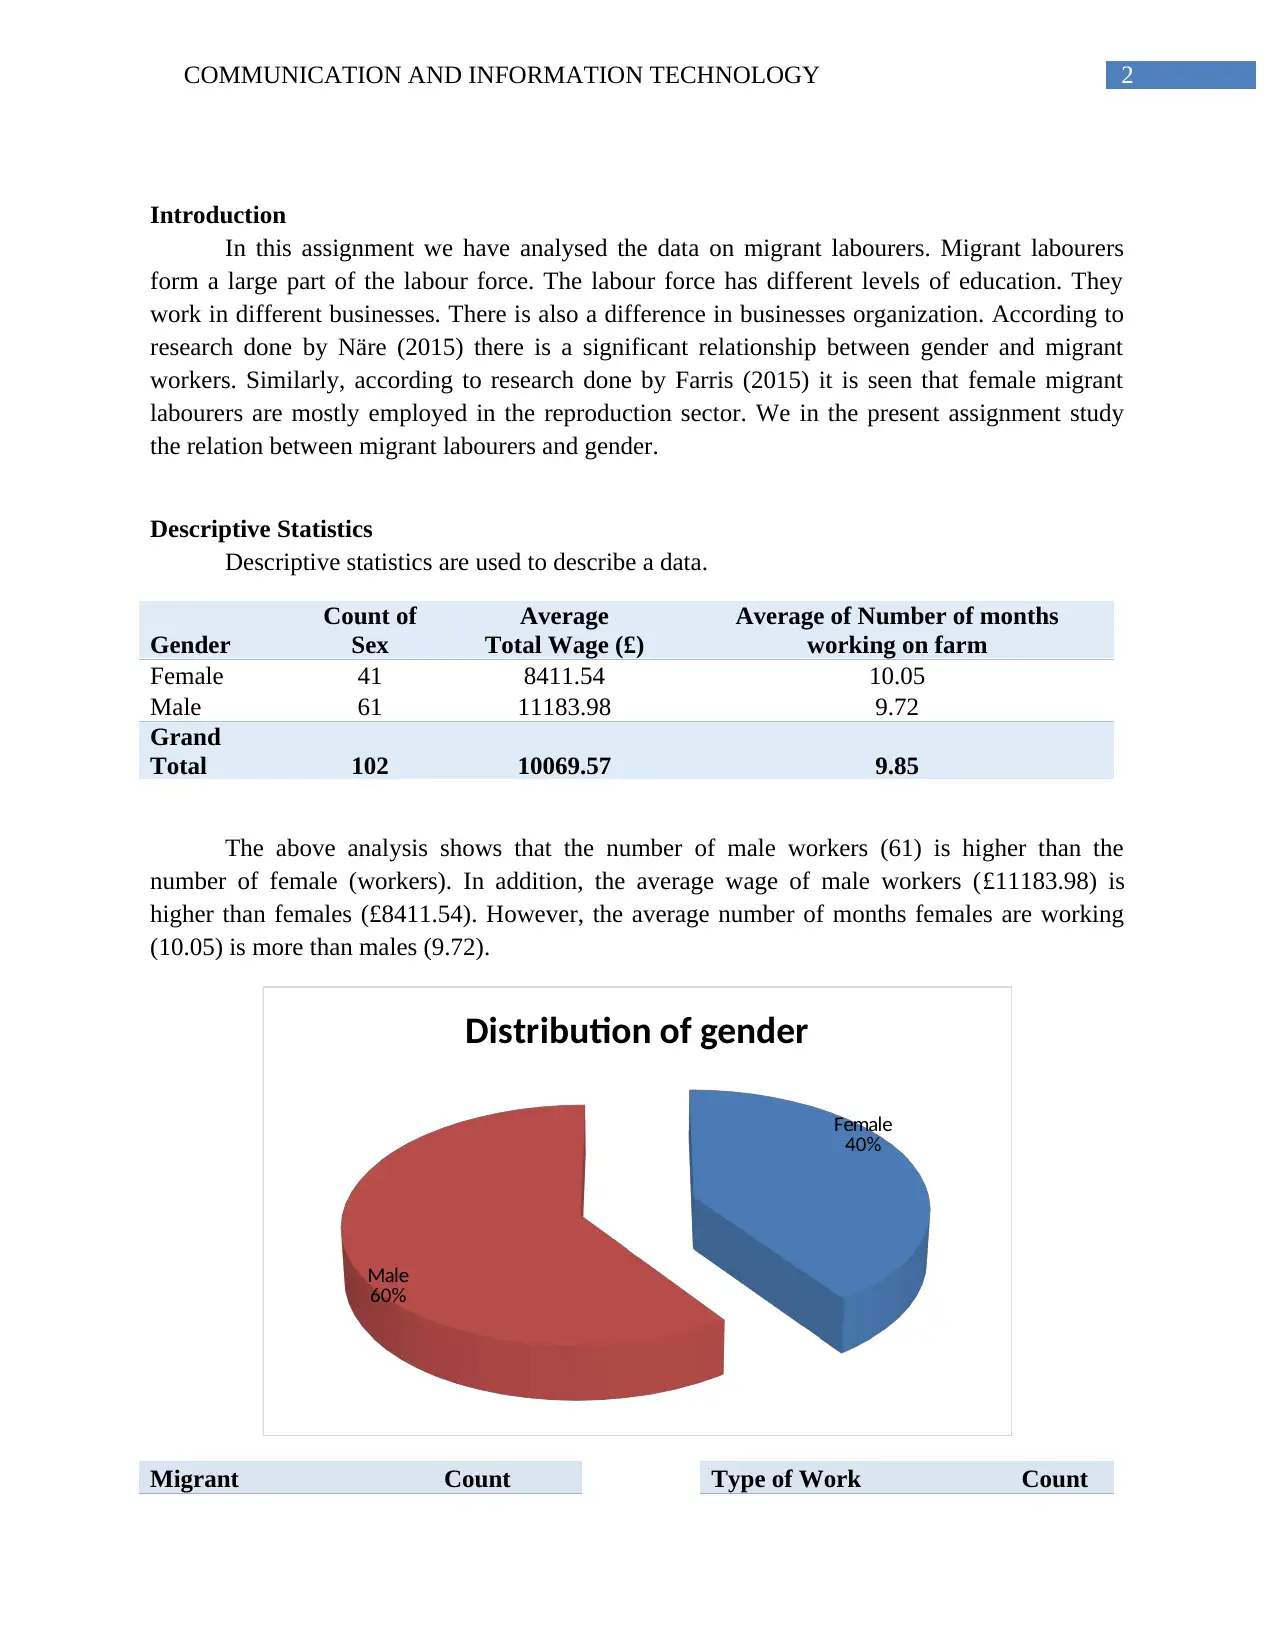
Descriptive Statistics
Descriptive statistics are used to describe a data.
Gender
Count of
Sex
Average
Total Wage (£)
Average of Number of months
working on farm
Female 41 8411.54 10.05
Male 61 11183.98 9.72
Grand
Total 102 10069.57 9.85
The above analysis shows that the number of male workers (61) is higher than the
number of female (workers). In addition, the average wage of male workers (£11183.98) is
higher than females (£8411.54). However, the average number of months females are working
(10.05) is more than males (9.72).
Female
40%
Male
60%
Distribution of gender
Migrant Count Type of Work Count
Introduction
In this assignment we have analysed the data on migrant labourers. Migrant labourers
form a large part of the labour force. The labour force has different levels of education. They
work in different businesses. There is also a difference in businesses organization. According to
research done by Näre (2015) there is a significant relationship between gender and migrant
workers. Similarly, according to research done by Farris (2015) it is seen that female migrant
labourers are mostly employed in the reproduction sector. We in the present assignment study
the relation between migrant labourers and gender.
Descriptive Statistics
Descriptive statistics are used to describe a data.
Gender
Count of
Sex
Average
Total Wage (£)
Average of Number of months
working on farm
Female 41 8411.54 10.05
Male 61 11183.98 9.72
Grand
Total 102 10069.57 9.85
The above analysis shows that the number of male workers (61) is higher than the
number of female (workers). In addition, the average wage of male workers (£11183.98) is
higher than females (£8411.54). However, the average number of months females are working
(10.05) is more than males (9.72).
Female
40%
Male
60%
Distribution of gender
Migrant Count Type of Work Count
⊘ This is a preview!⊘
Do you want full access?
Subscribe today to unlock all pages.
Trusted by 1+ million students worldwide
3COMMUNICATION AND INFORMATION TECHNOLOGY
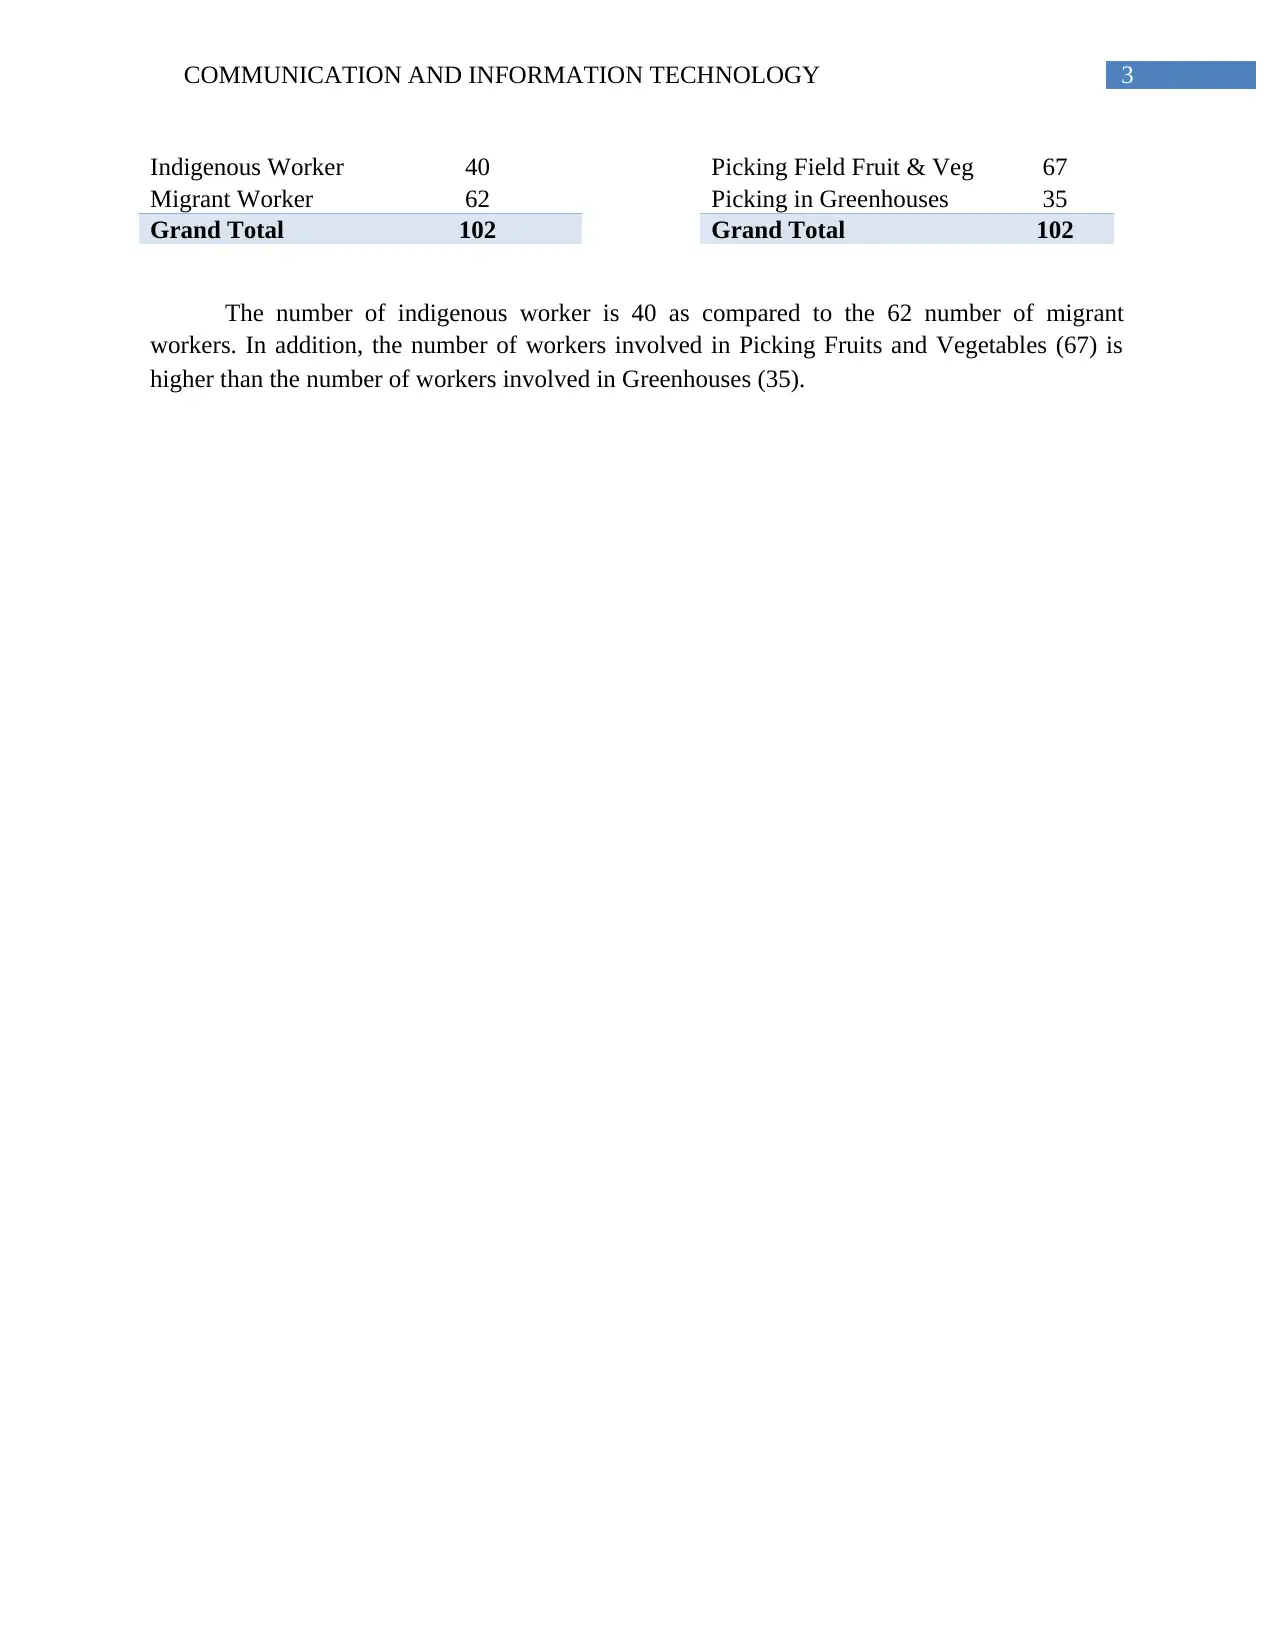
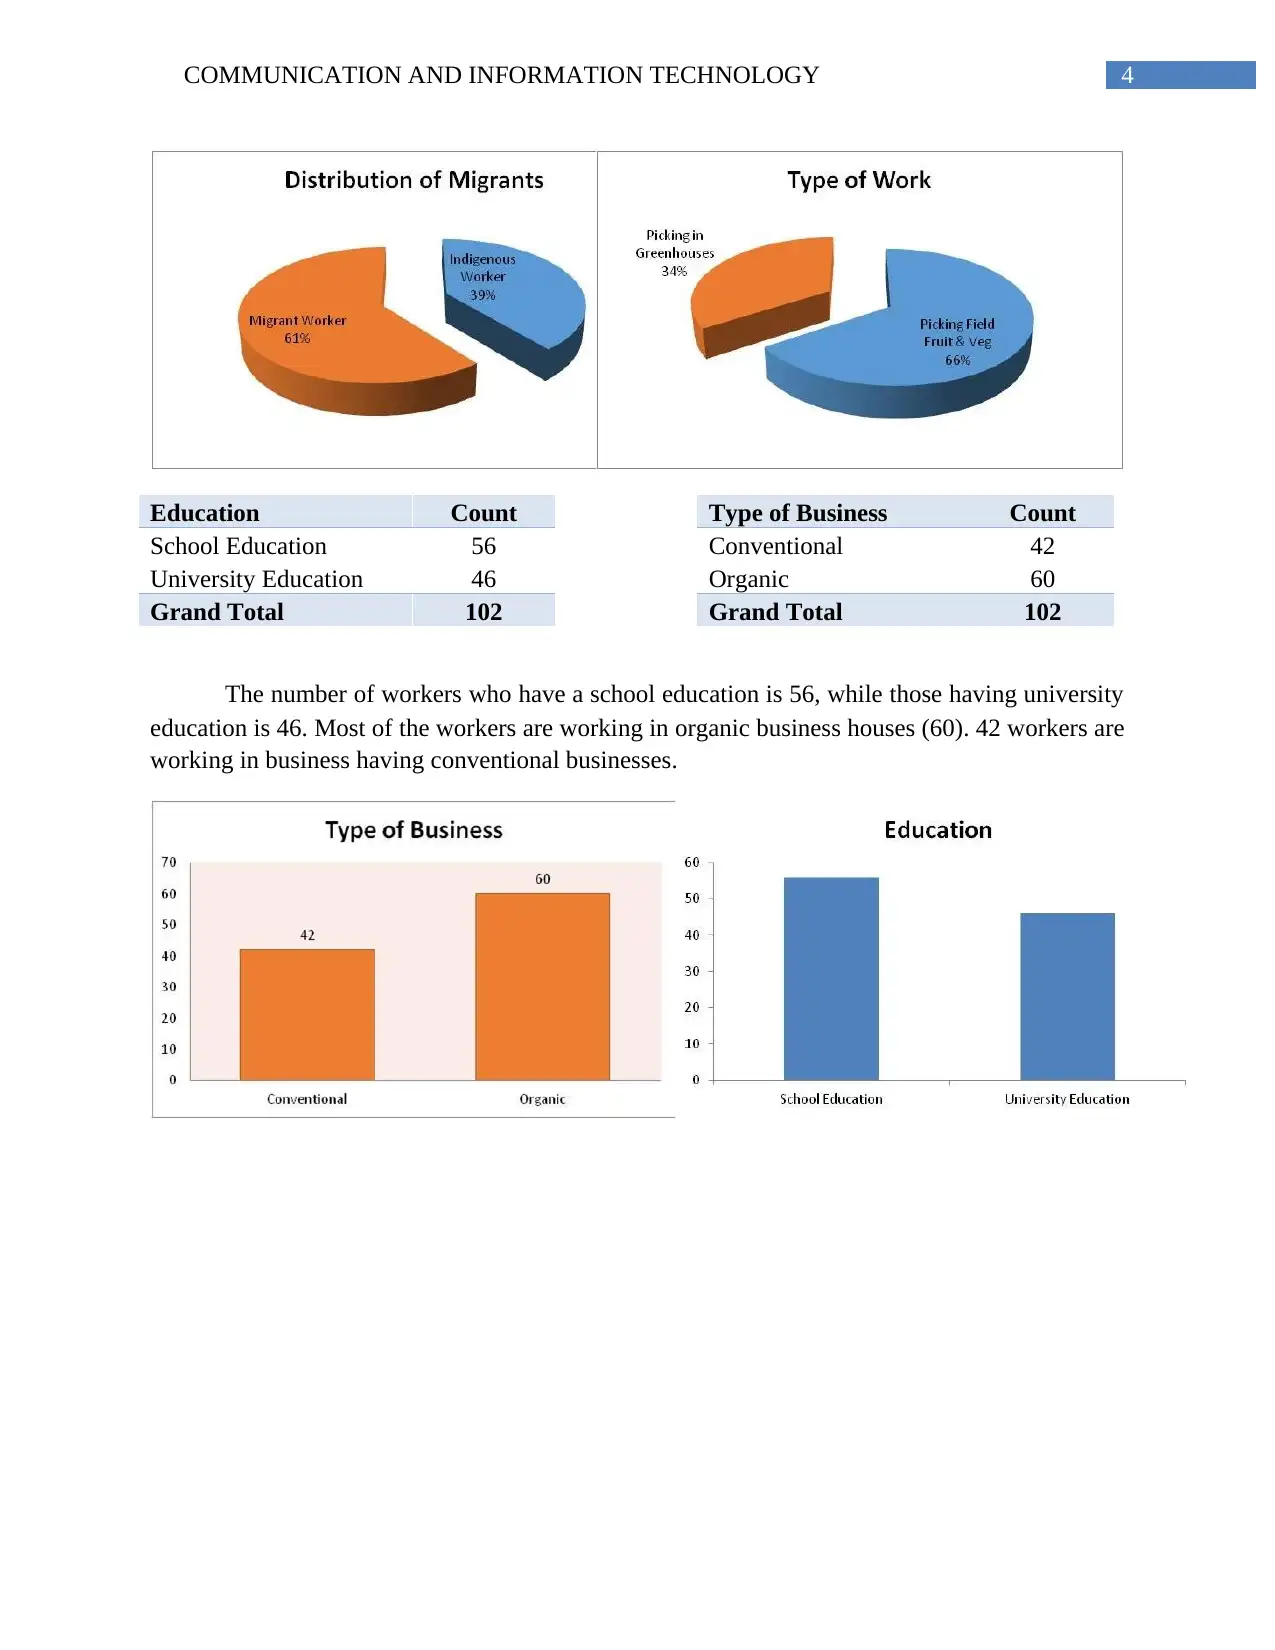
Indigenous Worker 40 Picking Field Fruit & Veg 67
Migrant Worker 62 Picking in Greenhouses 35
Grand Total 102 Grand Total 102
The number of indigenous worker is 40 as compared to the 62 number of migrant
workers. In addition, the number of workers involved in Picking Fruits and Vegetables (67) is
higher than the number of workers involved in Greenhouses (35).
Paraphrase This Document
Need a fresh take? Get an instant paraphrase of this document with our AI Paraphraser
4COMMUNICATION AND INFORMATION TECHNOLOGY
Education Count Type of Business Count
School Education 56 Conventional 42
University Education 46 Organic 60
Grand Total 102 Grand Total 102
The number of workers who have a school education is 56, while those having university
education is 46. Most of the workers are working in organic business houses (60). 42 workers are
working in business having conventional businesses.
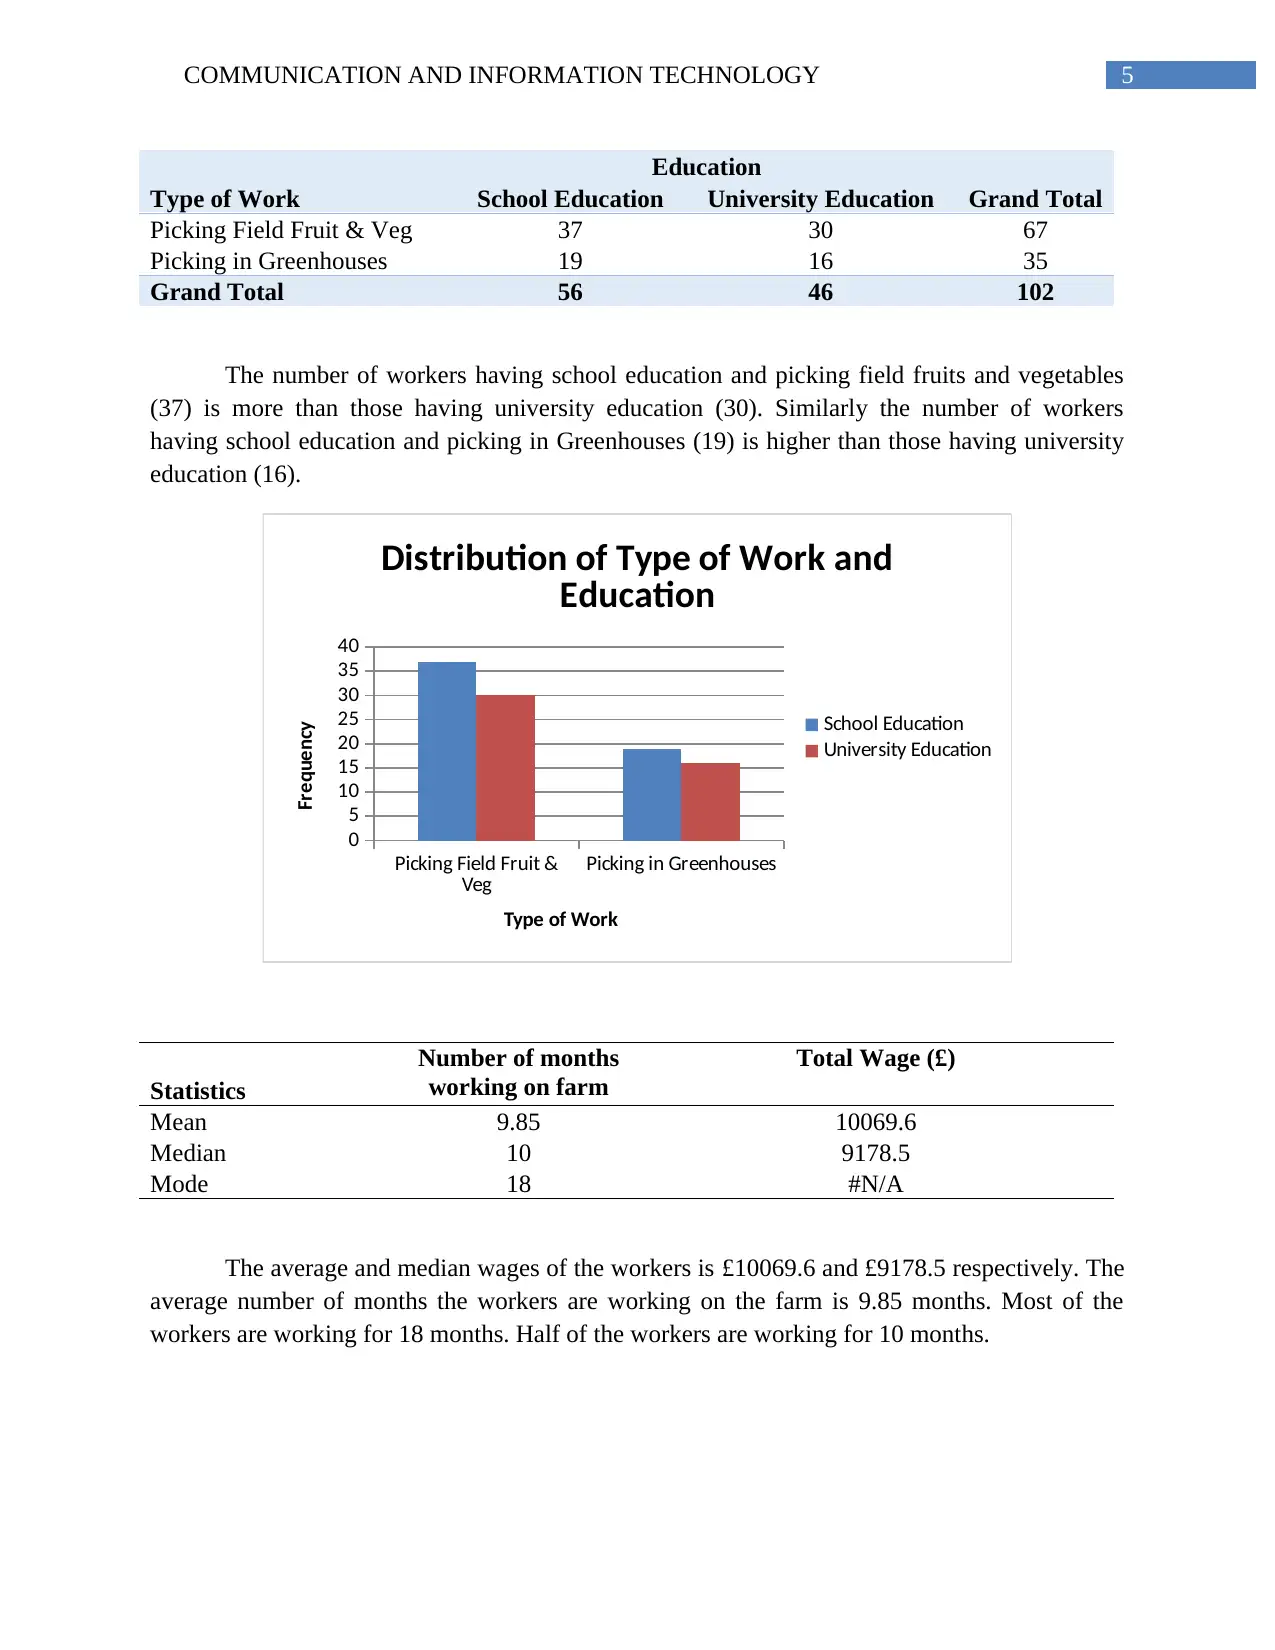
5COMMUNICATION AND INFORMATION TECHNOLOGY
Type of Work
Education
School Education University Education Grand Total
Picking Field Fruit & Veg 37 30 67
Picking in Greenhouses 19 16 35
Grand Total 56 46 102
The number of workers having school education and picking field fruits and vegetables
(37) is more than those having university education (30). Similarly the number of workers
having school education and picking in Greenhouses (19) is higher than those having university
education (16).
Picking Field Fruit &
Veg Picking in Greenhouses
0
5
10
15
20
25
30
35
40
Distribution of Type of Work and
Education
School Education
University Education
Type of Work
Frequency
Statistics
Number of months
working on farm
Total Wage (£)
Mean 9.85 10069.6
Median 10 9178.5
Mode 18 #N/A
The average and median wages of the workers is £10069.6 and £9178.5 respectively. The
average number of months the workers are working on the farm is 9.85 months. Most of the
workers are working for 18 months. Half of the workers are working for 10 months.
Type of Work
Education
School Education University Education Grand Total
Picking Field Fruit & Veg 37 30 67
Picking in Greenhouses 19 16 35
Grand Total 56 46 102
The number of workers having school education and picking field fruits and vegetables
(37) is more than those having university education (30). Similarly the number of workers
having school education and picking in Greenhouses (19) is higher than those having university
education (16).
Picking Field Fruit &
Veg Picking in Greenhouses
0
5
10
15
20
25
30
35
40
Distribution of Type of Work and
Education
School Education
University Education
Type of Work
Frequency
Statistics
Number of months
working on farm
Total Wage (£)
Mean 9.85 10069.6
Median 10 9178.5
Mode 18 #N/A
The average and median wages of the workers is £10069.6 and £9178.5 respectively. The
average number of months the workers are working on the farm is 9.85 months. Most of the
workers are working for 18 months. Half of the workers are working for 10 months.
⊘ This is a preview!⊘
Do you want full access?
Subscribe today to unlock all pages.
Trusted by 1+ million students worldwide
6COMMUNICATION AND INFORMATION TECHNOLOGY
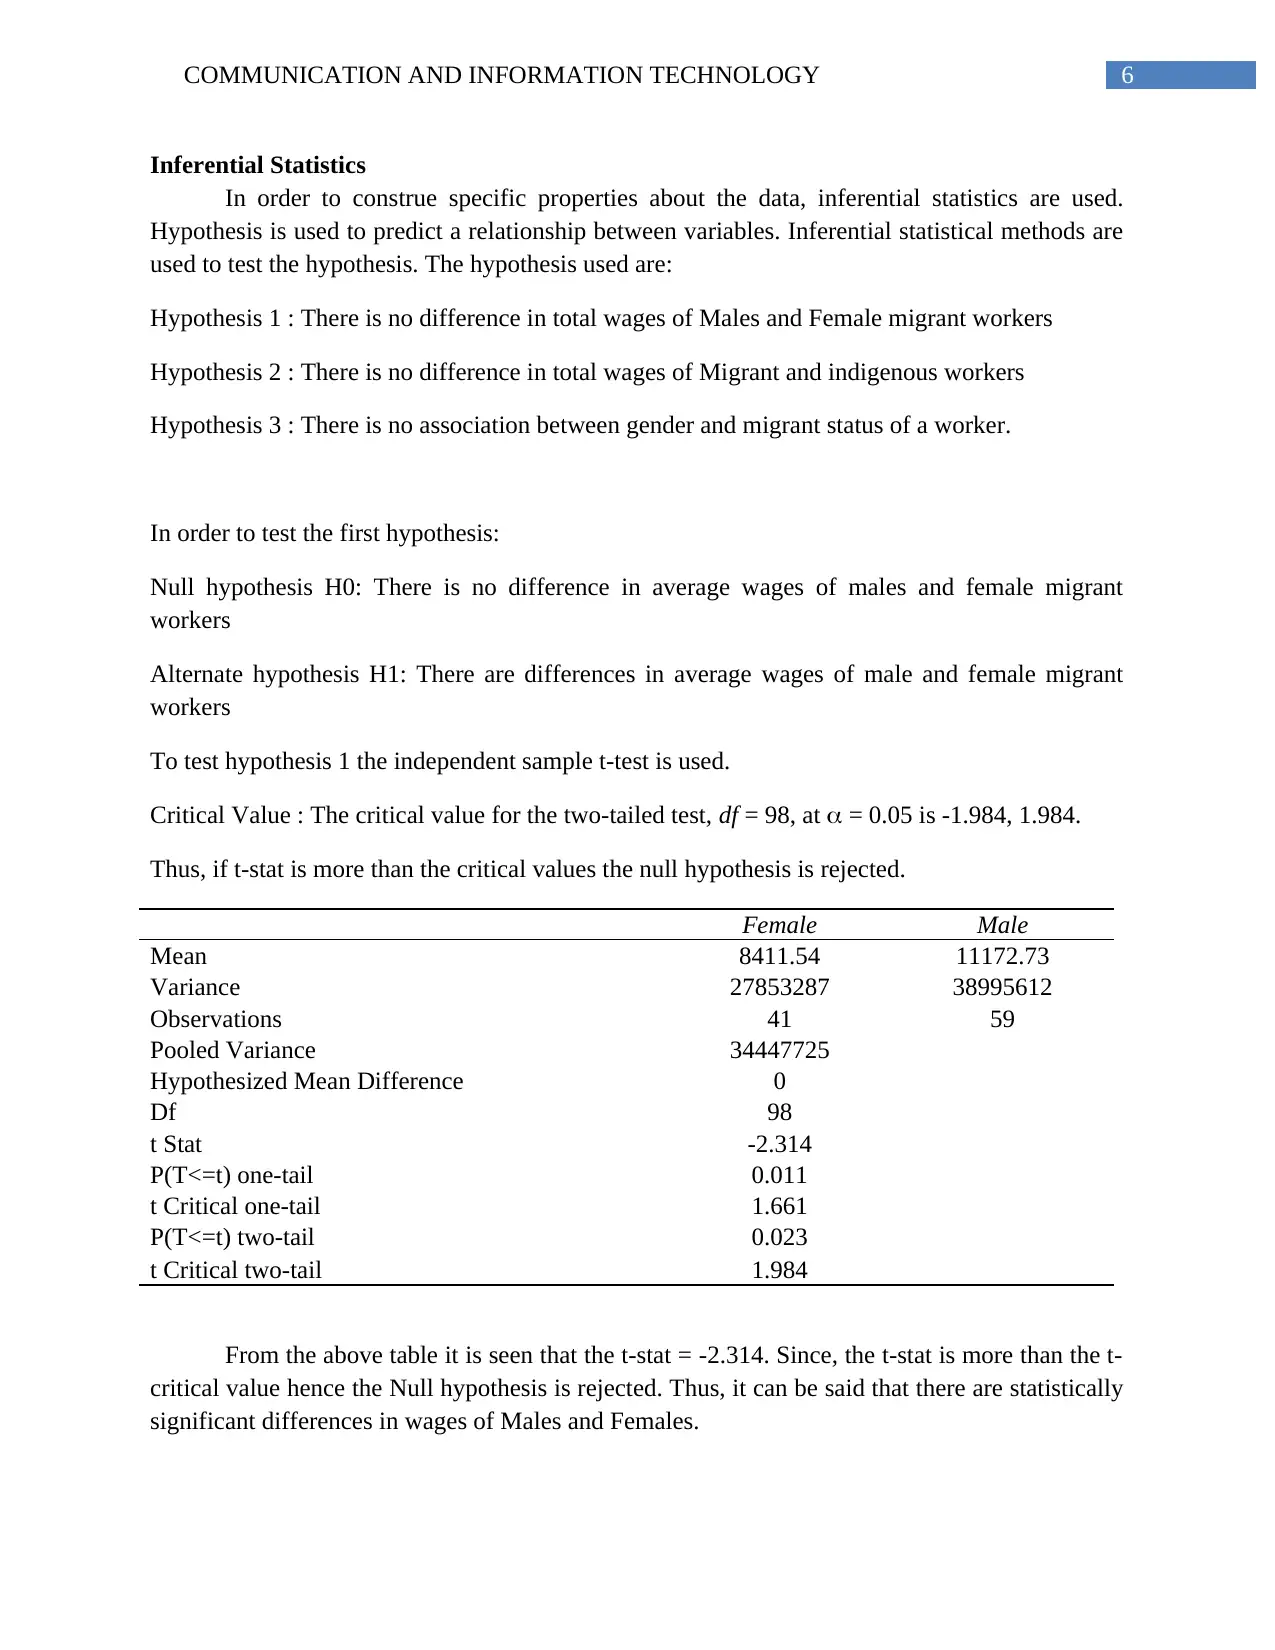
Inferential Statistics
In order to construe specific properties about the data, inferential statistics are used.
Hypothesis is used to predict a relationship between variables. Inferential statistical methods are
used to test the hypothesis. The hypothesis used are:
Hypothesis 1 : There is no difference in total wages of Males and Female migrant workers
Hypothesis 2 : There is no difference in total wages of Migrant and indigenous workers
Hypothesis 3 : There is no association between gender and migrant status of a worker.
In order to test the first hypothesis:
Null hypothesis H0: There is no difference in average wages of males and female migrant
workers
Alternate hypothesis H1: There are differences in average wages of male and female migrant
workers
To test hypothesis 1 the independent sample t-test is used.
Critical Value : The critical value for the two-tailed test, df = 98, at = 0.05 is -1.984, 1.984.
Thus, if t-stat is more than the critical values the null hypothesis is rejected.
Female Male
Mean 8411.54 11172.73
Variance 27853287 38995612
Observations 41 59
Pooled Variance 34447725
Hypothesized Mean Difference 0
Df 98
t Stat -2.314
P(T<=t) one-tail 0.011
t Critical one-tail 1.661
P(T<=t) two-tail 0.023
t Critical two-tail 1.984
From the above table it is seen that the t-stat = -2.314. Since, the t-stat is more than the t-
critical value hence the Null hypothesis is rejected. Thus, it can be said that there are statistically
significant differences in wages of Males and Females.
Paraphrase This Document
Need a fresh take? Get an instant paraphrase of this document with our AI Paraphraser
7COMMUNICATION AND INFORMATION TECHNOLOGY
Hence, from the data it is seen that the average wage of Males (£11172.73) is
significantly higher than of females (£8411.54).
In order to test hypothesis 2 the independent sample t-test is used.
Critical Value : The critical value for the two-tailed test, df = 67, at = 0.05 is -1.996, 1.996.
Thus, if t-stat is more than the critical values the null hypothesis is rejected.
Indigenous Worker Migrant worker
Mean 10339.3 10678.45
Variance 39082393 44673898
Observations 40 29
Pooled Variance 41419141
Hypothesized Mean Difference 0
df 67
t Stat -0.216
P(T<=t) one-tail 0.415
t Critical one-tail 1.668
P(T<=t) two-tail 0.830
t Critical two-tail 1.996
From the above table it is seen that the t-stat = -0.216. Since, the t-stat is less than the t-
critical value hence the Null hypothesis is not rejected. Hence, the average wage of Indigenous
worker (£10339.3) is equivalent to the average wage of migrant worker (£10678.45).
To test hypothesis 3 Chi-square test for association is used.
Null hypothesis H0: There is no association between Gender and Migrant workers in numbers
Alternate hypothesis H1: There is an association between Gender and Migrant workers in
numbers
Migrant
Migrant
Sex
Indigenous
Worker
Migrant
Worker
Grand
Total Sex
Indigenous
Worker
Migrant
Worker
Grand
Total
Female 21 20 41 Female 16.08 24.92 41
Male 19 42 61 Male 23.92 37.08 61
Grand
Total 40 62 102
Grand
Total 40 62 102
8COMMUNICATION AND INFORMATION TECHNOLOGY
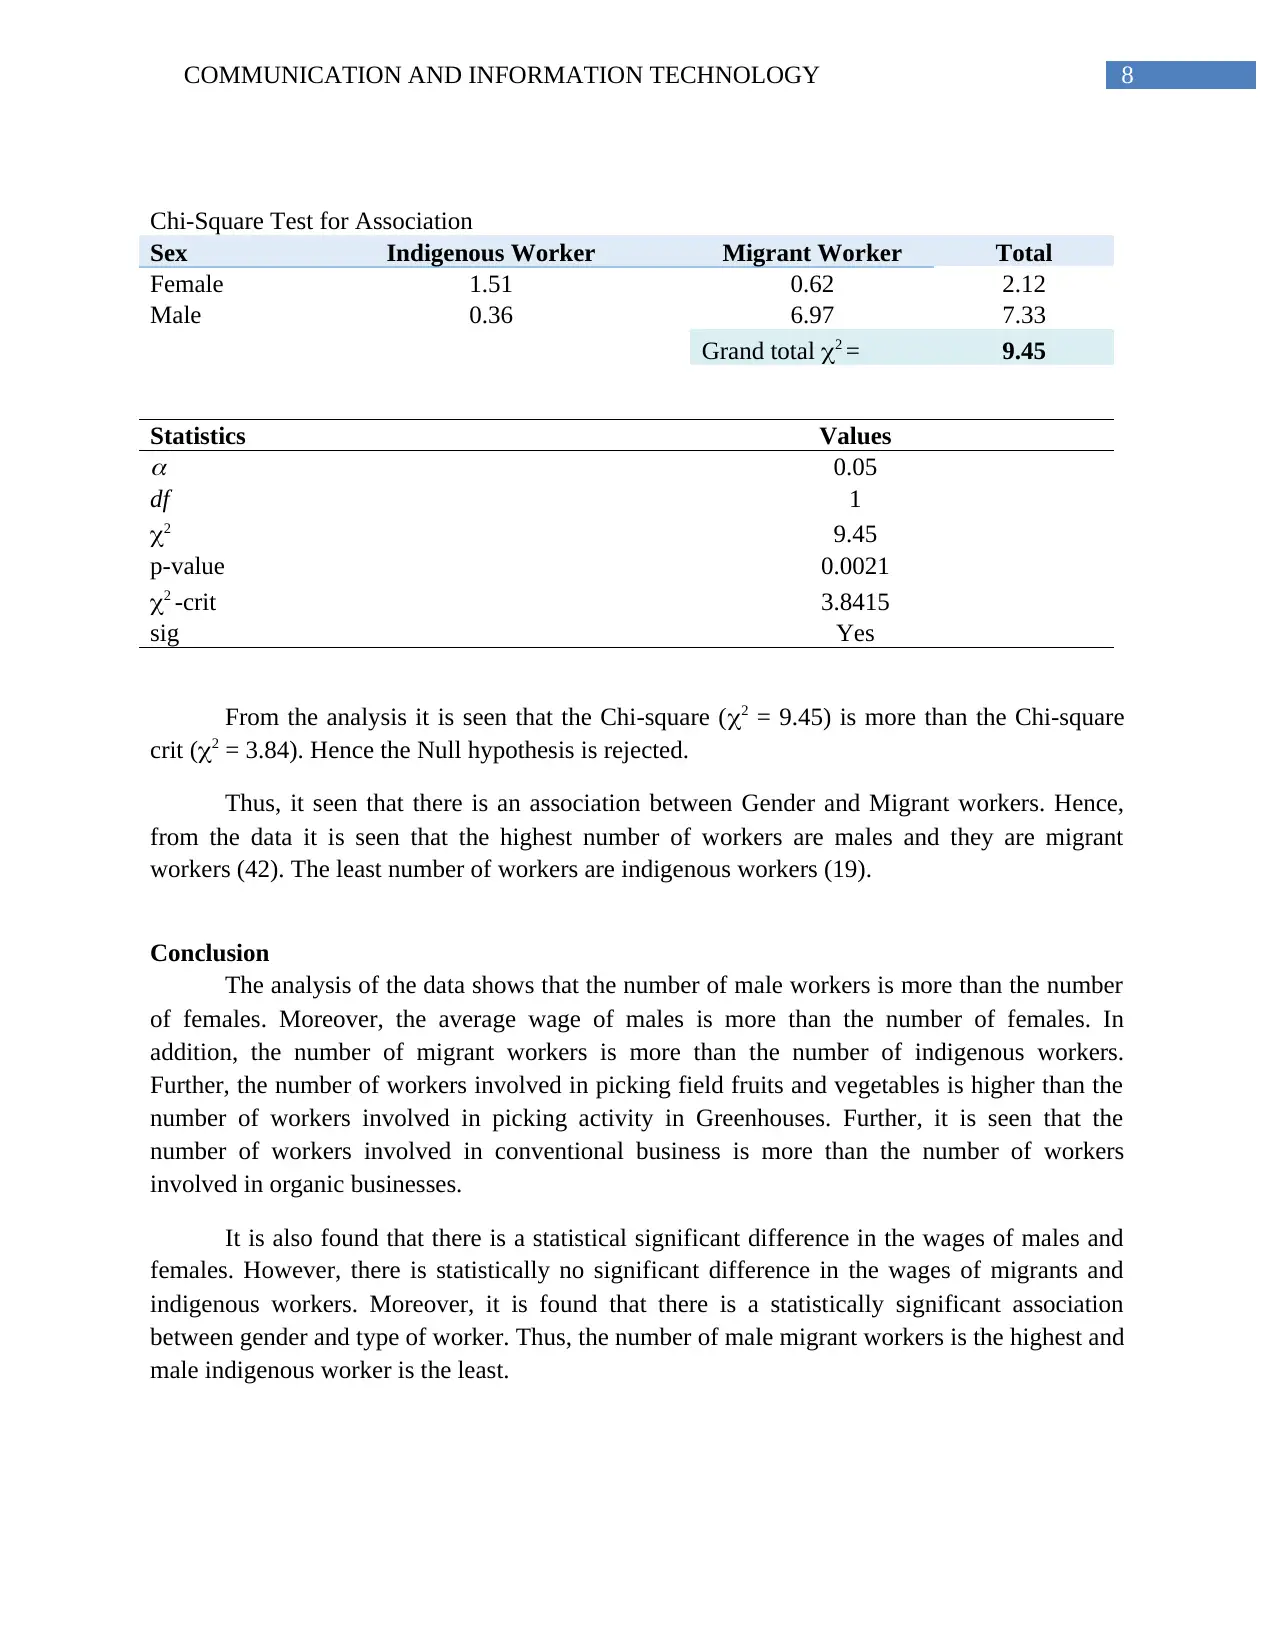
Chi-Square Test for Association
Sex Indigenous Worker Migrant Worker Total
Female 1.51 0.62 2.12
Male 0.36 6.97 7.33
Grand total 2 = 9.45
Statistics Values 0.05
df 1
2 9.45
p-value 0.0021
2 -crit 3.8415
sig Yes
From the analysis it is seen that the Chi-square (2 = 9.45) is more than the Chi-square
crit (2 = 3.84). Hence the Null hypothesis is rejected.
Thus, it seen that there is an association between Gender and Migrant workers. Hence,
from the data it is seen that the highest number of workers are males and they are migrant
workers (42). The least number of workers are indigenous workers (19).
Conclusion
The analysis of the data shows that the number of male workers is more than the number
of females. Moreover, the average wage of males is more than the number of females. In
addition, the number of migrant workers is more than the number of indigenous workers.
Further, the number of workers involved in picking field fruits and vegetables is higher than the
number of workers involved in picking activity in Greenhouses. Further, it is seen that the
number of workers involved in conventional business is more than the number of workers
involved in organic businesses.
It is also found that there is a statistical significant difference in the wages of males and
females. However, there is statistically no significant difference in the wages of migrants and
indigenous workers. Moreover, it is found that there is a statistically significant association
between gender and type of worker. Thus, the number of male migrant workers is the highest and
male indigenous worker is the least.
⊘ This is a preview!⊘
Do you want full access?
Subscribe today to unlock all pages.
Trusted by 1+ million students worldwide
9COMMUNICATION AND INFORMATION TECHNOLOGY
References
Farris, S.R., 2015. Migrants' regular army of labour: gender dimensions of the impact of the
global economic crisis on migrant labor in Western Europe. The Sociological Review, 63(1),
pp.121-143.
Näre, L., 2013. Migrancy, gender and social class in domestic labour and social care in Italy: An
intersectional analysis of demand. Journal of Ethnic and Migration Studies, 39(4), pp.601-623.
1 out of 10
Your All-in-One AI-Powered Toolkit for Academic Success.
+13062052269
info@desklib.com
Available 24*7 on WhatsApp / Email
![[object Object]](/_next/static/media/star-bottom.7253800d.svg)
Unlock your academic potential
Copyright © 2020–2026 A2Z Services. All Rights Reserved. Developed and managed by ZUCOL.