Managerial Accounting Assignment: Milano Co Break-Even Point Analysis
VerifiedAdded on  2022/08/18
|9
|1312
|23
Homework Assignment
AI Summary
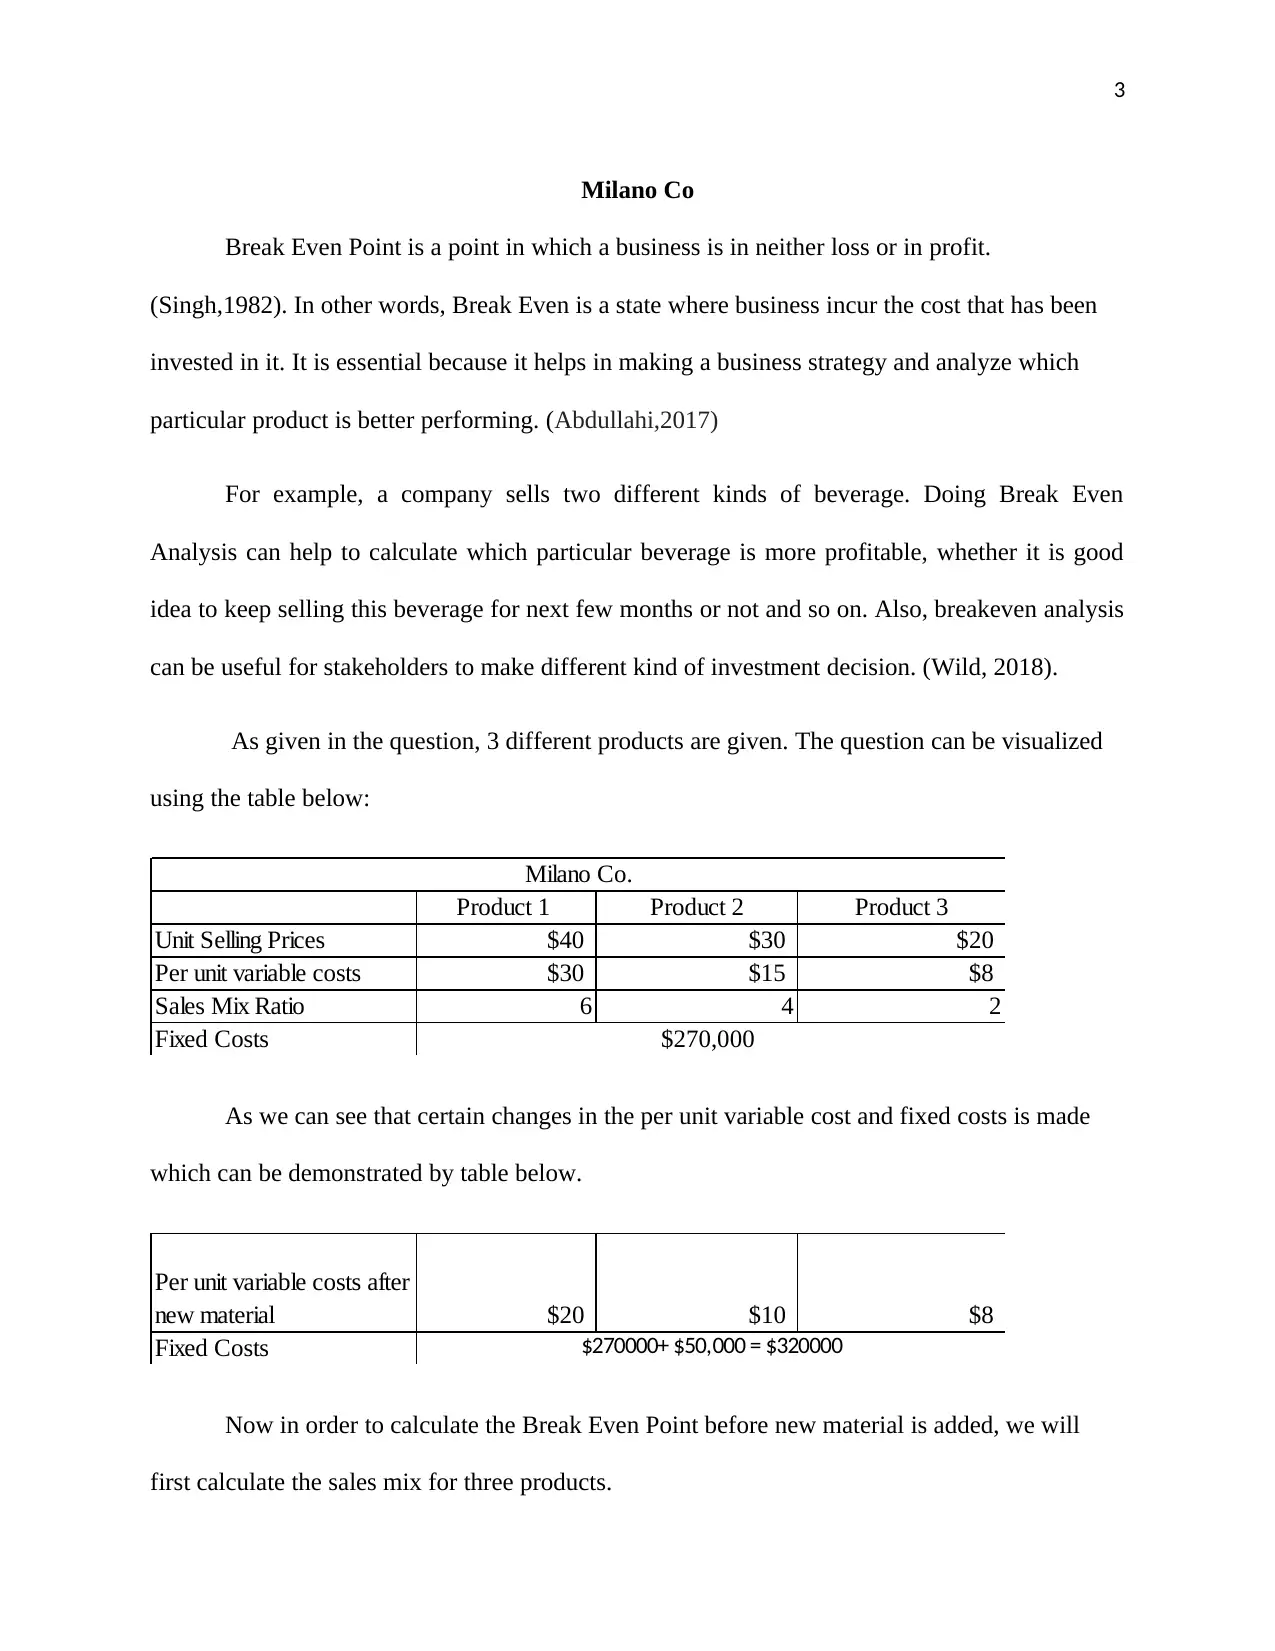
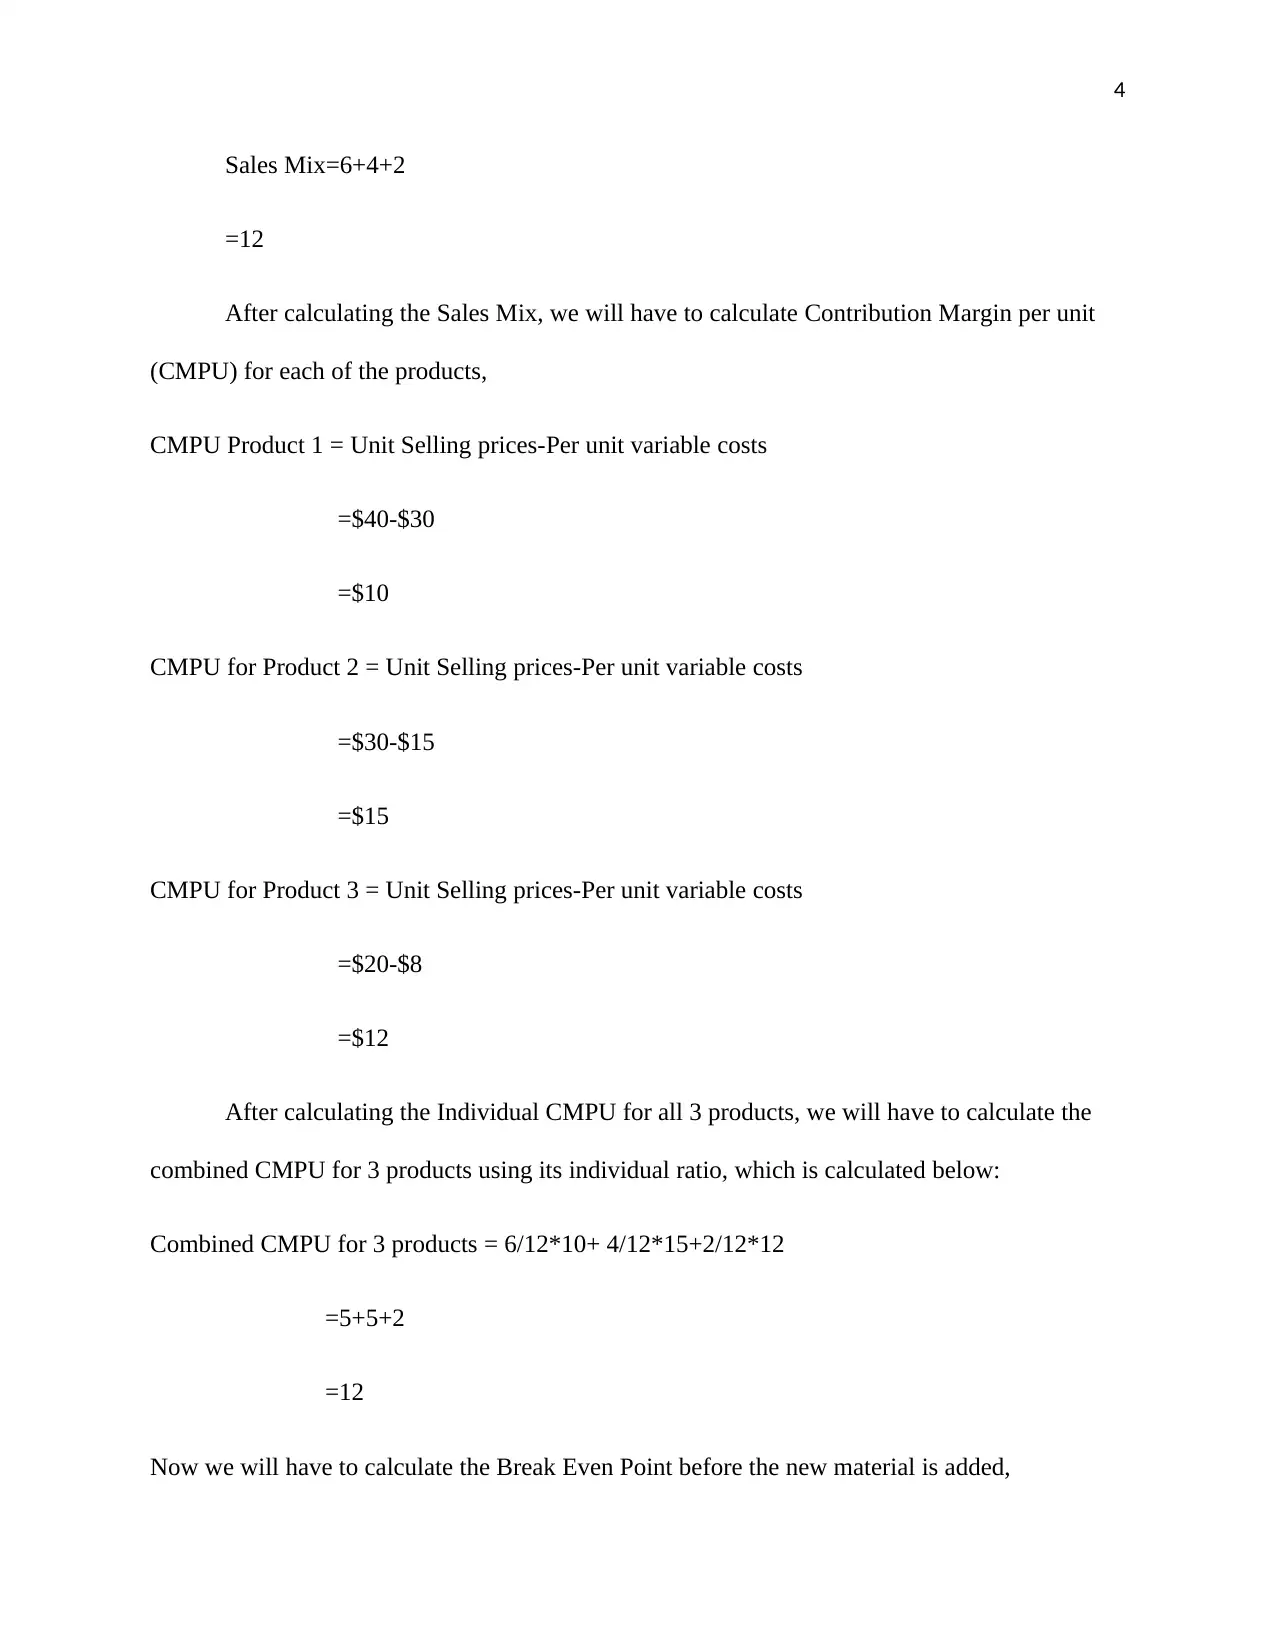
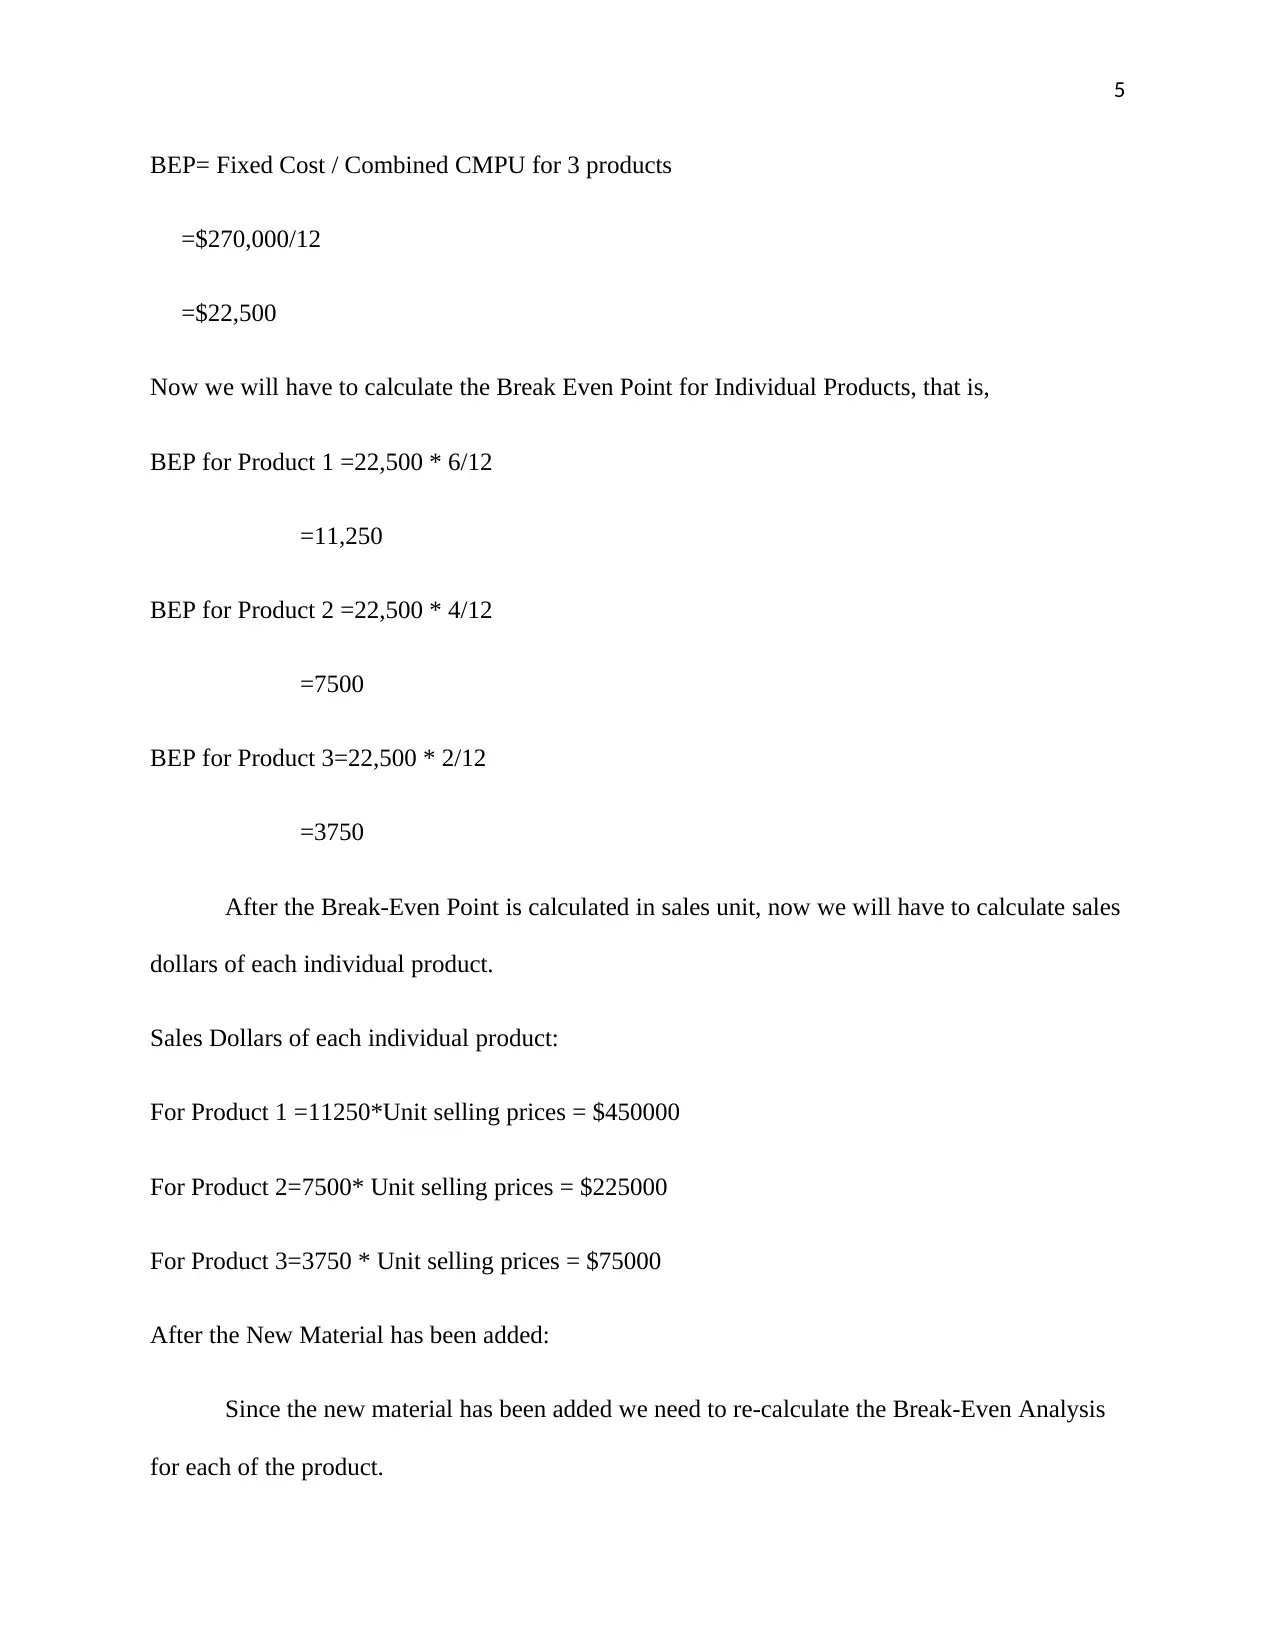
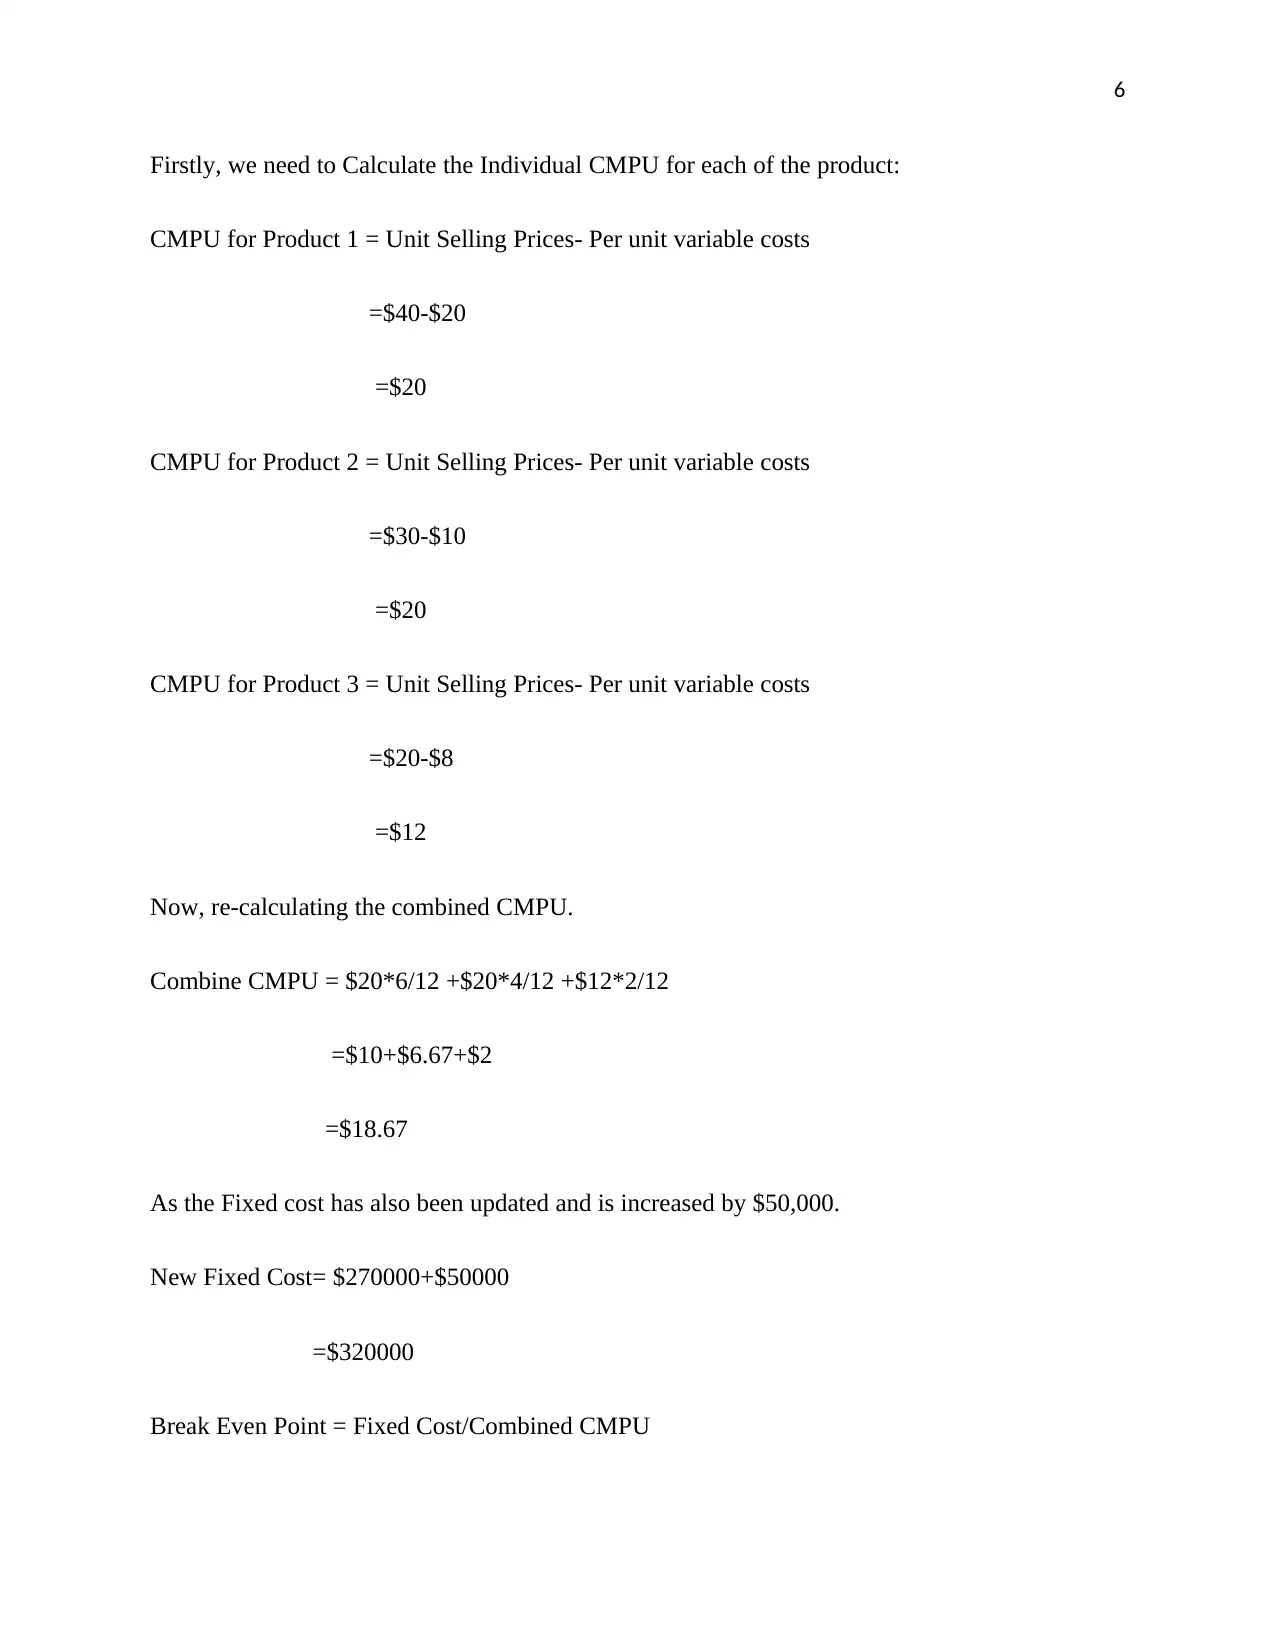
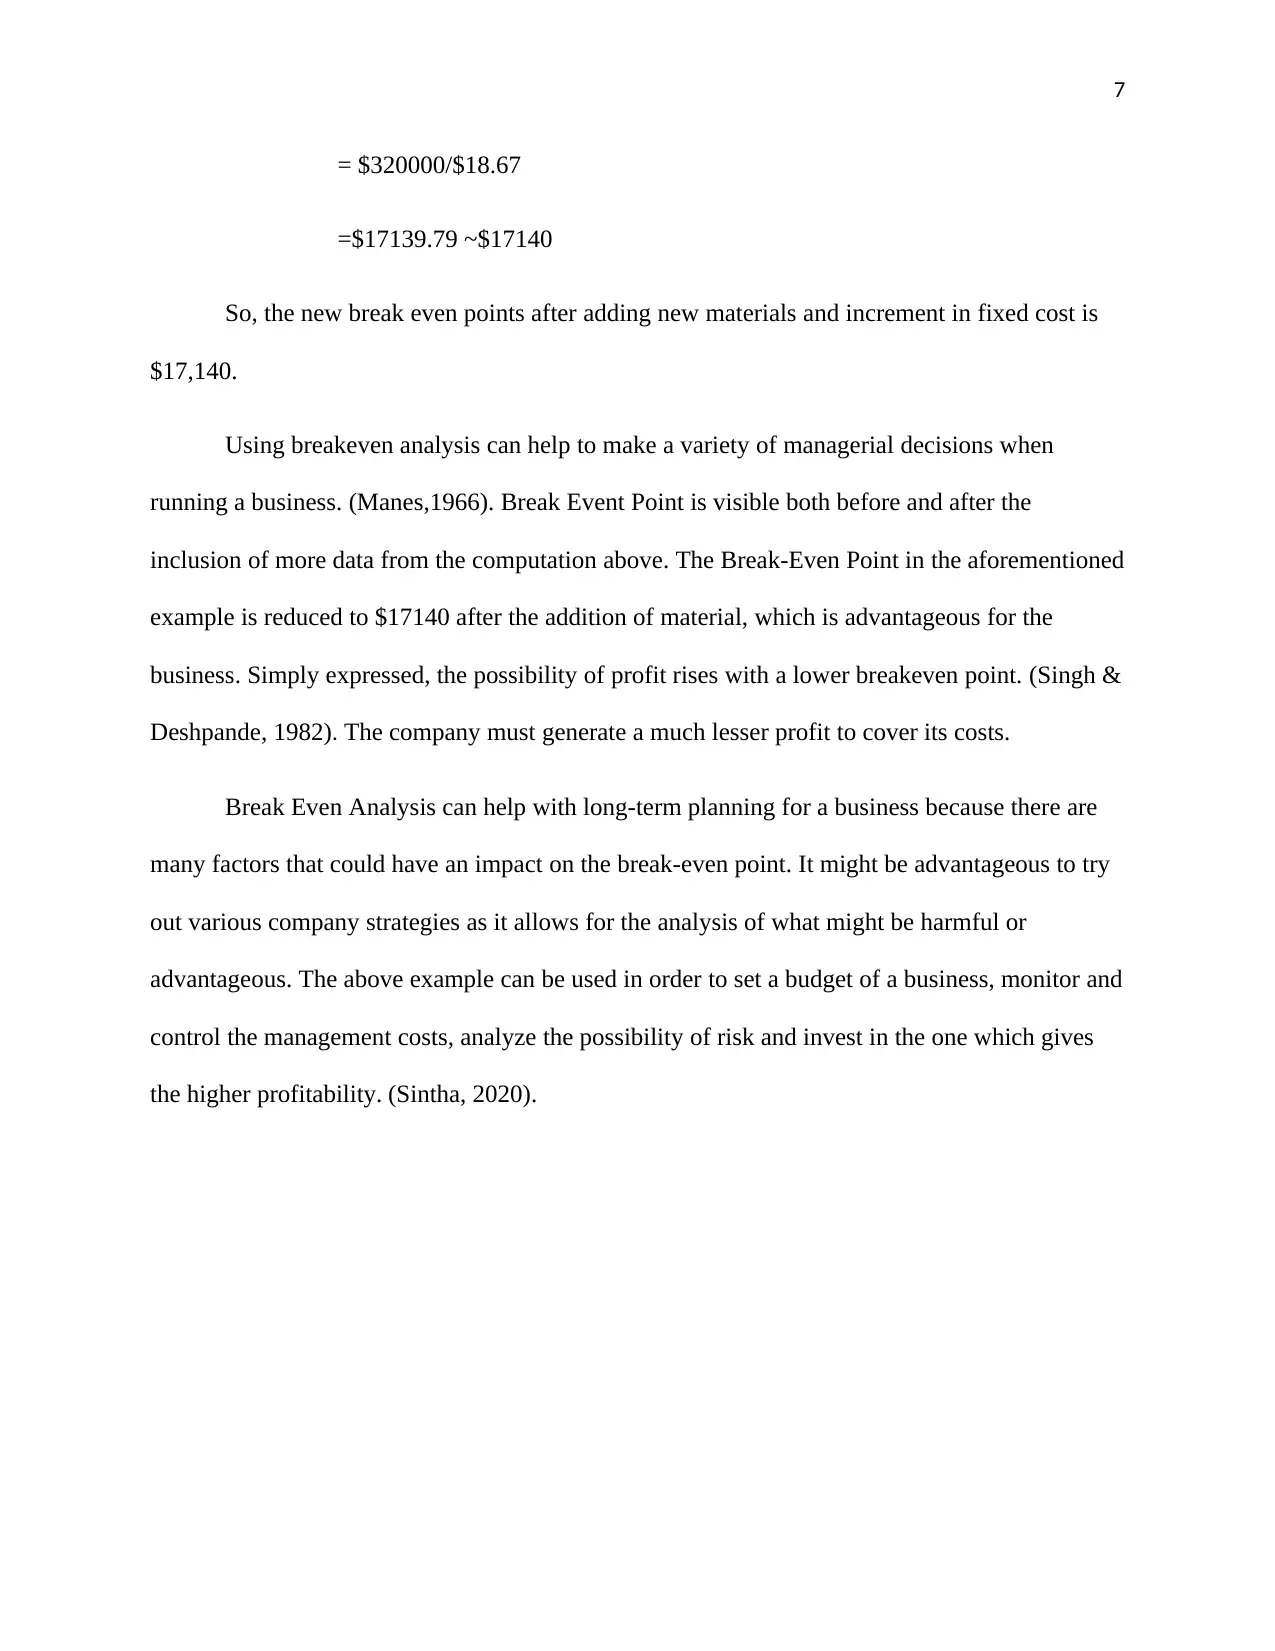
This assignment analyzes the break-even point for Milano Co, a case study in managerial accounting. The paper calculates the break-even point before and after incorporating changes in material and fixed costs. It begins by defining break-even analysis and its importance for business strategy and investment decisions. The analysis involves calculating the sales mix, contribution margin per unit (CMPU), and the combined CMPU for three products. The break-even point is then determined in both sales units and sales dollars for each product. The assignment then re-calculates the break-even point after the addition of new materials and an increase in fixed costs. The results demonstrate how changes in costs affect profitability and the break-even point, emphasizing the value of break-even analysis for managerial decision-making, including budgeting, cost control, risk analysis, and investment strategies. The conclusion highlights the use of break-even analysis to assess product performance and guide strategic adjustments for improved profitability.

1
Milano Co
Yangisha K.C
Westcliff University
BUS 535: Managerial Accounting
Professor. Ajay Shah
July 24,2022
Milano Co
Yangisha K.C
Westcliff University
BUS 535: Managerial Accounting
Professor. Ajay Shah
July 24,2022
Paraphrase This Document
Need a fresh take? Get an instant paraphrase of this document with our AI Paraphraser

2
Abstract
This paper addresses break-even analysis, its significance, and the advantages it may
provide a business. In order to address it, the Break Even Point for Milano Co, the firm
mentioned in the question, is calculated. In the second step, several adjustments are made to the
materials and fixed costs that provide a useful perspective. After the calculation, different
conclusion is drawn, which can be quite insightful for Business Risk Analysis and Decision
Making.
Keywords: Break Even Analysis, Contribution Margin, Unit Selling Price, Sales Mix Ratio.

3
Milano Co
Break Even Point is a point in which a business is in neither loss or in profit.
(Singh,1982). In other words, Break Even is a state where business incur the cost that has been
invested in it. It is essential because it helps in making a business strategy and analyze which
particular product is better performing. (Abdullahi,2017)
For example, a company sells two different kinds of beverage. Doing Break Even
Analysis can help to calculate which particular beverage is more profitable, whether it is good
idea to keep selling this beverage for next few months or not and so on. Also, breakeven analysis
can be useful for stakeholders to make different kind of investment decision. (Wild, 2018).
As given in the question, 3 different products are given. The question can be visualized
using the table below:
Product 1 Product 2 Product 3
Unit Selling Prices $40 $30 $20
Per unit variable costs $30 $15 $8
Sales Mix Ratio 6 4 2
Fixed Costs $270,000
Milano Co.
As we can see that certain changes in the per unit variable cost and fixed costs is made
which can be demonstrated by table below.
Per unit variable costs after
new material $20 $10 $8
Fixed Costs $270000+ $50,000 = $320000
Now in order to calculate the Break Even Point before new material is added, we will
first calculate the sales mix for three products.
⊘ This is a preview!⊘
Do you want full access?
Subscribe today to unlock all pages.

Trusted by 1+ million students worldwide

4
Sales Mix=6+4+2
=12
After calculating the Sales Mix, we will have to calculate Contribution Margin per unit
(CMPU) for each of the products,
CMPU Product 1 = Unit Selling prices-Per unit variable costs
=$40-$30
=$10
CMPU for Product 2 = Unit Selling prices-Per unit variable costs
=$30-$15
=$15
CMPU for Product 3 = Unit Selling prices-Per unit variable costs
=$20-$8
=$12
After calculating the Individual CMPU for all 3 products, we will have to calculate the
combined CMPU for 3 products using its individual ratio, which is calculated below:
Combined CMPU for 3 products = 6/12*10+ 4/12*15+2/12*12
=5+5+2
=12
Now we will have to calculate the Break Even Point before the new material is added,
Paraphrase This Document
Need a fresh take? Get an instant paraphrase of this document with our AI Paraphraser

5
BEP= Fixed Cost / Combined CMPU for 3 products
=$270,000/12
=$22,500
Now we will have to calculate the Break Even Point for Individual Products, that is,
BEP for Product 1 =22,500 * 6/12
=11,250
BEP for Product 2 =22,500 * 4/12
=7500
BEP for Product 3=22,500 * 2/12
=3750
After the Break-Even Point is calculated in sales unit, now we will have to calculate sales
dollars of each individual product.
Sales Dollars of each individual product:
For Product 1 =11250*Unit selling prices = $450000
For Product 2=7500* Unit selling prices = $225000
For Product 3=3750 * Unit selling prices = $75000
After the New Material has been added:
Since the new material has been added we need to re-calculate the Break-Even Analysis
for each of the product.

6
Firstly, we need to Calculate the Individual CMPU for each of the product:
CMPU for Product 1 = Unit Selling Prices- Per unit variable costs
=$40-$20
=$20
CMPU for Product 2 = Unit Selling Prices- Per unit variable costs
=$30-$10
=$20
CMPU for Product 3 = Unit Selling Prices- Per unit variable costs
=$20-$8
=$12
Now, re-calculating the combined CMPU.
Combine CMPU = $20*6/12 +$20*4/12 +$12*2/12
=$10+$6.67+$2
=$18.67
As the Fixed cost has also been updated and is increased by $50,000.
New Fixed Cost= $270000+$50000
=$320000
Break Even Point = Fixed Cost/Combined CMPU
⊘ This is a preview!⊘
Do you want full access?
Subscribe today to unlock all pages.

Trusted by 1+ million students worldwide

7
= $320000/$18.67
=$17139.79 ~$17140
So, the new break even points after adding new materials and increment in fixed cost is
$17,140.
Using breakeven analysis can help to make a variety of managerial decisions when
running a business. (Manes,1966). Break Event Point is visible both before and after the
inclusion of more data from the computation above. The Break-Even Point in the aforementioned
example is reduced to $17140 after the addition of material, which is advantageous for the
business. Simply expressed, the possibility of profit rises with a lower breakeven point. (Singh &
Deshpande, 1982). The company must generate a much lesser profit to cover its costs.
Break Even Analysis can help with long-term planning for a business because there are
many factors that could have an impact on the break-even point. It might be advantageous to try
out various company strategies as it allows for the analysis of what might be harmful or
advantageous. The above example can be used in order to set a budget of a business, monitor and
control the management costs, analyze the possibility of risk and invest in the one which gives
the higher profitability. (Sintha, 2020).
Paraphrase This Document
Need a fresh take? Get an instant paraphrase of this document with our AI Paraphraser

8
Conclusion
In conclusion Break Even Analysis can help a business to analyze which particular
product is performing well or is profitable in general, how many units needs to be sold in order
to incur all the cost that has been invested in a business.
After analyzing the above example of Milani Co, we can see that certain changes can
direct a business profitability. In the above example, adding new materials helped lowering the
Break Even Point but this might not be the case always, however a business should always be
willing to analyze different aspects to increase its profitability.

9
References
Abdullahi, S. R., Bello, S., Mukhtar, I. S., & Musa, M. H. (2017). Cost-volume-profit analysis as
a management tool for decision making in small business enterprise within Bayero
university, Kano. Iosr Journal of Business and Management (Iosr-Jbm), 19(2), 40-45.
Correa, H. (1984). Break-even analysis for multiple product firms. Socio-Economic Planning
Sciences, 18(3), 211-217. https://doi.org/10.1016/0038-0121(84)90021-1
Manes, R. (1966, Spring). A New Dimension to Breakeven Analysis. Journal of Accounting
Research, 4(1), 87-100. https://doi.org/10.2307/2490143
Singh, S. P., & Deshpande, J. V. (1982). Break-even point. Economic and Political weekly,
M123-M128.
Sintha, L. (2020). Importance of break-even analysis for the micro, small and medium
enterprises. International Journal of Research-GRANTHAALAYAH, 8(6).
Wild, J. J., Shaw, K. W., & Chiappetta, B. (2018). Financial and managerial accounting:
information for decisions (Vol. 7th Edition). New York: McGraw-Hill Education.
⊘ This is a preview!⊘
Do you want full access?
Subscribe today to unlock all pages.

Trusted by 1+ million students worldwide
1 out of 9
Related Documents
Your All-in-One AI-Powered Toolkit for Academic Success.
 +13062052269
info@desklib.com
Available 24*7 on WhatsApp / Email
Unlock your academic potential
Copyright © 2020–2025 A2Z Services. All Rights Reserved. Developed and managed by ZUCOL.


