Supply and Demand Analysis of Milano Marble Countertops Report
VerifiedAdded on 2022/11/18
|9
|1003
|441
Report
AI Summary
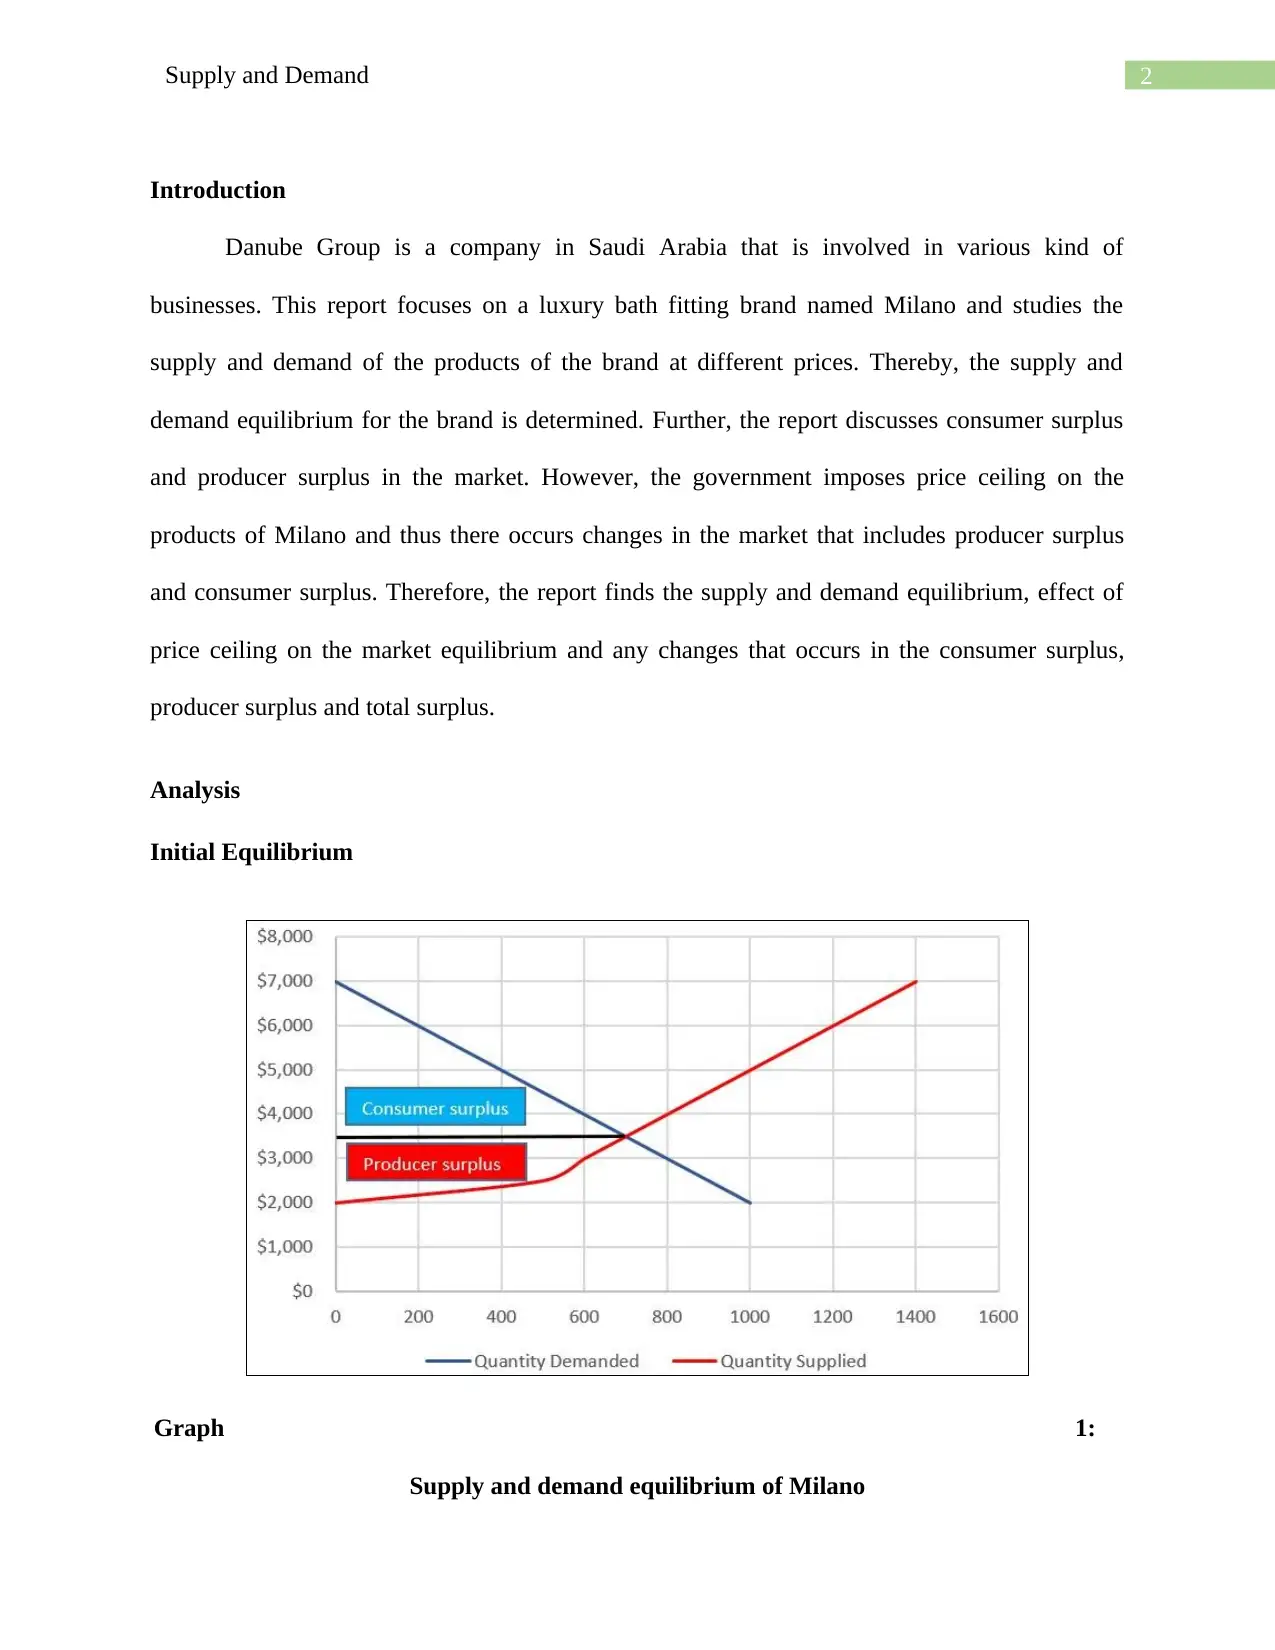
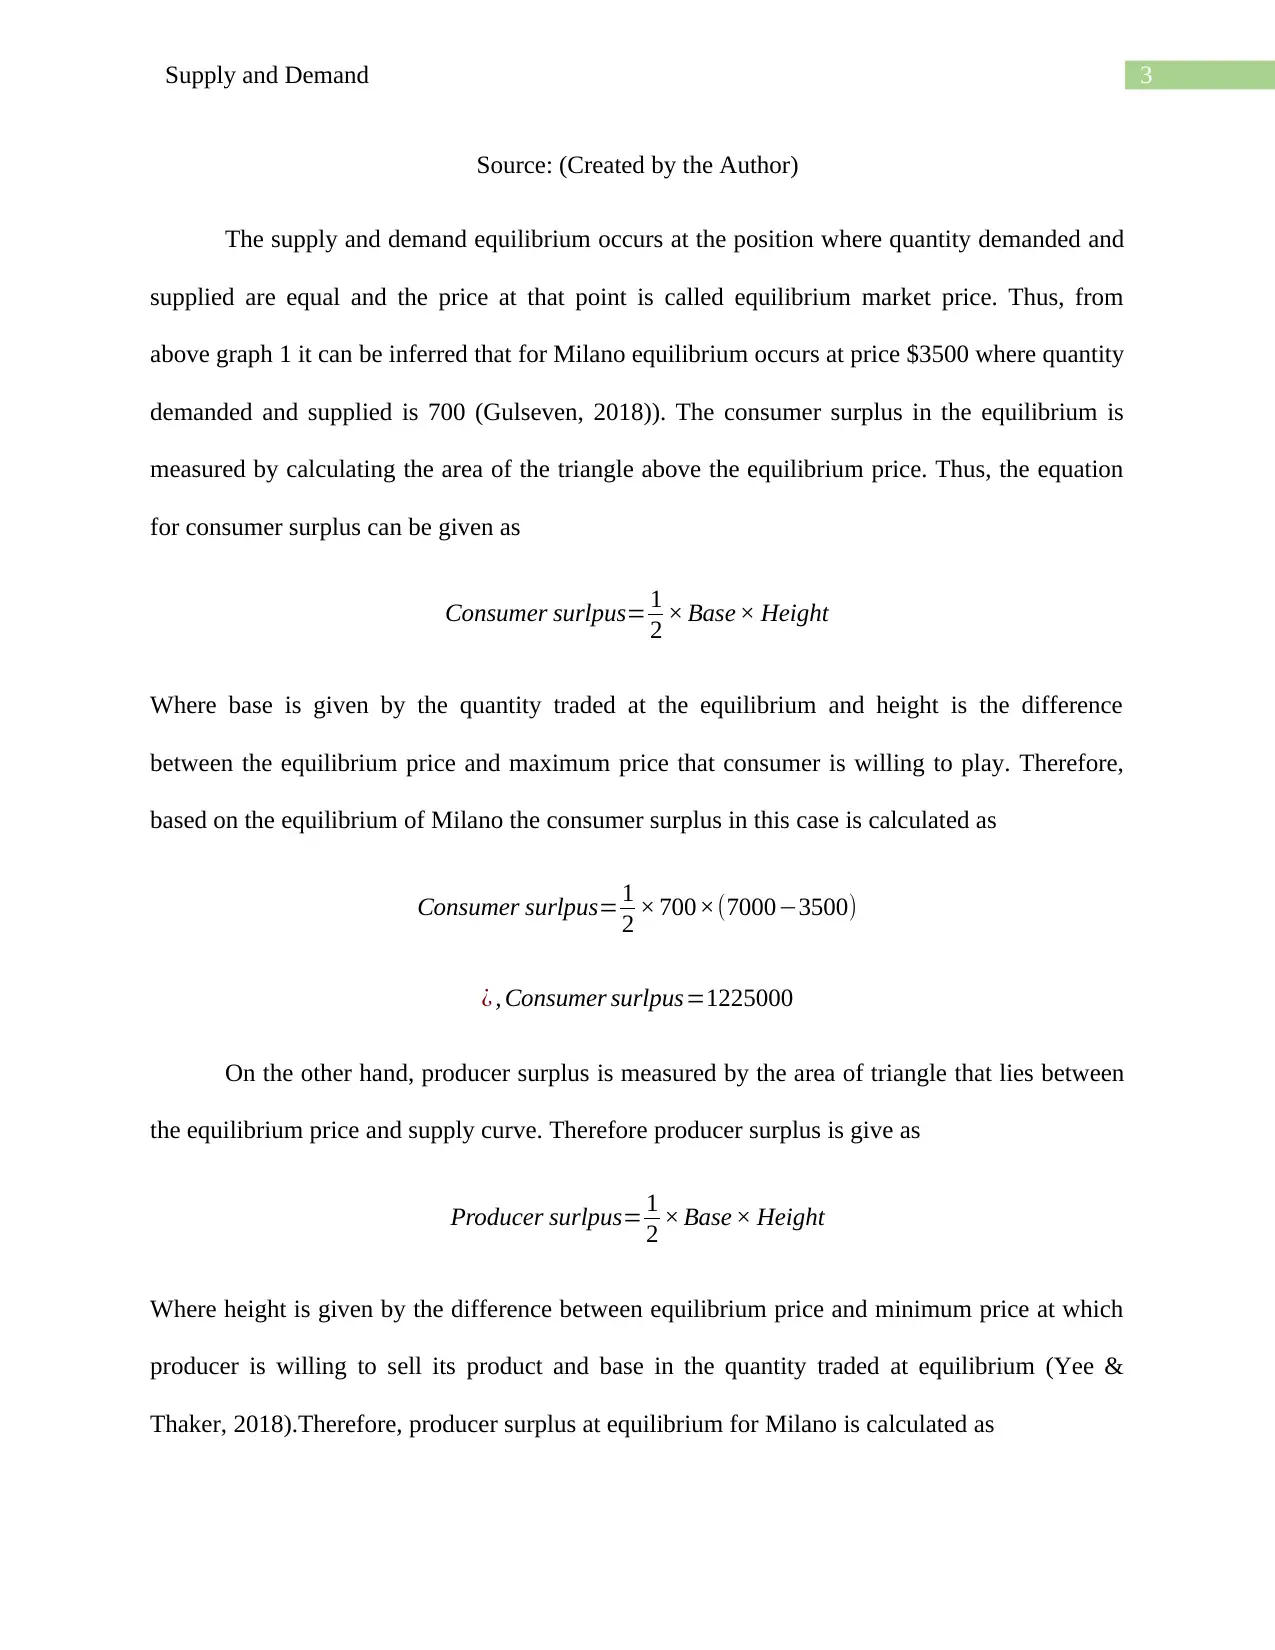
This report examines the supply and demand dynamics of Milano branded marble countertops, a product of the Danube Group. It begins by determining the equilibrium price where quantity demanded and supplied are equal, then calculates consumer and producer surplus at this equilibrium. The analysis further explores the impact of a government-imposed price ceiling on the product, specifically at $3000, which is below the initial equilibrium price. This leads to a market shortage, altering consumer and producer surpluses, and ultimately resulting in a deadweight loss that reduces total surplus. The report concludes that a price ceiling policy is not a feasible approach to enhance overall economic welfare, as it adversely affects market efficiency by decreasing the total surplus.

Running head: Supply and Demand
Supply and Demand
Name of the Student
Name of the University
Student ID
Supply and Demand
Name of the Student
Name of the University
Student ID
Paraphrase This Document
Need a fresh take? Get an instant paraphrase of this document with our AI Paraphraser

1Supply and Demand
Table of Contents
Introduction......................................................................................................................................2
Analysis...........................................................................................................................................2
Initial Equilibrium.......................................................................................................................2
Imposition of Price Ceiling..........................................................................................................4
Discussion........................................................................................................................................6
References........................................................................................................................................8

2Supply and Demand
Introduction
Danube Group is a company in Saudi Arabia that is involved in various kind of
businesses. This report focuses on a luxury bath fitting brand named Milano and studies the
supply and demand of the products of the brand at different prices. Thereby, the supply and
demand equilibrium for the brand is determined. Further, the report discusses consumer surplus
and producer surplus in the market. However, the government imposes price ceiling on the
products of Milano and thus there occurs changes in the market that includes producer surplus
and consumer surplus. Therefore, the report finds the supply and demand equilibrium, effect of
price ceiling on the market equilibrium and any changes that occurs in the consumer surplus,
producer surplus and total surplus.
Analysis
Initial Equilibrium
Graph 1:
Supply and demand equilibrium of Milano
⊘ This is a preview!⊘
Do you want full access?
Subscribe today to unlock all pages.

Trusted by 1+ million students worldwide

3Supply and Demand
Source: (Created by the Author)
The supply and demand equilibrium occurs at the position where quantity demanded and
supplied are equal and the price at that point is called equilibrium market price. Thus, from
above graph 1 it can be inferred that for Milano equilibrium occurs at price $3500 where quantity
demanded and supplied is 700 (Gulseven, 2018)). The consumer surplus in the equilibrium is
measured by calculating the area of the triangle above the equilibrium price. Thus, the equation
for consumer surplus can be given as
Consumer surlpus= 1
2 × Base × Height
Where base is given by the quantity traded at the equilibrium and height is the difference
between the equilibrium price and maximum price that consumer is willing to play. Therefore,
based on the equilibrium of Milano the consumer surplus in this case is calculated as
Consumer surlpus= 1
2 × 700×(7000−3500)
¿ , Consumer surlpus=1225000
On the other hand, producer surplus is measured by the area of triangle that lies between
the equilibrium price and supply curve. Therefore producer surplus is give as
Producer surlpus= 1
2 × Base × Height
Where height is given by the difference between equilibrium price and minimum price at which
producer is willing to sell its product and base in the quantity traded at equilibrium (Yee &
Thaker, 2018).Therefore, producer surplus at equilibrium for Milano is calculated as
Paraphrase This Document
Need a fresh take? Get an instant paraphrase of this document with our AI Paraphraser

4Supply and Demand
Producer surlpus= 1
2 ×700 ×(3500−2000)
¿ , Producer surlpus=525000
Further, the total surplus of market is given by the addition of producer surplus, consumer
surplus and loss in surplus. Therefore, the amount of total surplus occurred in the market of
Milano is given by summation of total consumer surplus and producer surplus since there is no
loss in welfare at this equilibrium. Thus, total surplus in this case is
Total surplus=Consumer surplus+ Prodcuer surplus
¿ , Total surplus=1225000+525000
¿ , Total surplus=1750000
Imposition of Price Ceiling
The government imposes price ceiling on marble counter top the product of Milano. Due
to imposition of price ceiling the maximum price that Milano could charge for its product is
$3000, which is $500 lower than the initial equilibrium price (Chernoff, 2015). Owing to fall in
price the demand for the product increased to 800 and supply reduced to 600. Therefore, there
occurred shortage in the market and the amount of shortage is 200. After imposition of price
ceiling the producer, surplus, consumer surplus and total surplus values get altered due to
generation of deadweight loss. In the given graph 2 the loss in producer surplus is given by blue
rectangle and half of deadweight loss (Maurice & Thomas, 2015). The consumer surplus in this
case however increased and is denoted by blue and orange colored rectangle and yellow triangle.
The deadweight loss is shown as green triangle in the graph.

5Supply and Demand
Deadweight loss= 1
2 ×(700−600)×(4000−3000)
¿ , Deadweight loss=50000
Loss∈ producer surplus=Area of bluerectangle+( 1
2 × Deadweight loss)
¿ , Loss∈ producer surplus={600 × ( 3500−3000 ) }+( 1
2 × 50000)
¿ , Loss∈ producer surplus=325000
Graph 2: Effect of price ceiling
Source: (Created by the Author)
Therefore,
Prodcuer surplus after price ceiling=525000−325000
⊘ This is a preview!⊘
Do you want full access?
Subscribe today to unlock all pages.

Trusted by 1+ million students worldwide

6Supply and Demand
¿ , Producer surplus after price ceiling=200000
Similarly, area of orange triangle is 300000 since it is equal to blue triangle.
Therefore,
Consumer surplus after price ceiling=Yellow triangle +Blue rectangle+Orange rectangle
¿ , Consumer surplus after price ceiling=¿
¿ , Consumer surplus after price ceiling=1500000
Therefore,
Total surplus after price ceiling=1500000+200000
¿ , Total surplus after price ceiling=1700000
Thus, there is loss in total surplus after price ceiling is (1750000-1700000) or 50000.
Thus, it can be inferred that imposition of price ceiling on the product of Milano has affected
adversely market of the product.
Discussion
In the analysis made above regarding the supply and demand of brand Milano of the
Danube Group it is found that the equilibrium in the market initially occurred at price $3500
where the quantity demanded and supplied is given by 700. The consumer surplus and producer
surplus has been calculated and it is found that there is no loss in surplus. However, after the
imposition of price ceiling by the government it is observed that there occurred shortage in the
Paraphrase This Document
Need a fresh take? Get an instant paraphrase of this document with our AI Paraphraser

7Supply and Demand
market. Apart from that the producer surplus reduced, consumer surplus increased and the total
surplus declined due to generation of deadweight loss. Thus, it is can be conclude that price
ceiling is not a feasible policy to increase welfare of the economy.
market. Apart from that the producer surplus reduced, consumer surplus increased and the total
surplus declined due to generation of deadweight loss. Thus, it is can be conclude that price
ceiling is not a feasible policy to increase welfare of the economy.

8Supply and Demand
References
Chernoff, A. W. (2015). Between a cap and a higher price: Modelling the price of dairy quotas
under price ceiling legislation. Canadian Journal of Economics/Revue canadienne
d'économique, 48(4), 1403-1429.
Gulseven, O. (2018). Estimating factors for the demand of organic milk in Turkey. British Food
Journal, 120(9), 2005-2016.
Maurice, S. C., & Thomas, C. (2015). Managerial Economics. McGraw-Hill Higher Education.
Yee, E. C. P., & Thaker, H. M. T. (2018). Determinants of Share Price Fluctuation: Evidence
from the Manufacturing Industry in Malaysia. Skyline Business Journal, 14(1), 58-71.
⊘ This is a preview!⊘
Do you want full access?
Subscribe today to unlock all pages.

Trusted by 1+ million students worldwide
1 out of 9
Related Documents

Your All-in-One AI-Powered Toolkit for Academic Success.
+13062052269
info@desklib.com
Available 24*7 on WhatsApp / Email
Unlock your academic potential
Copyright © 2020–2025 A2Z Services. All Rights Reserved. Developed and managed by ZUCOL.