Financial Reporting for Business: Performance and Pension Analysis
VerifiedAdded on 2023/01/09
|19
|3681
|62
Report
AI Summary
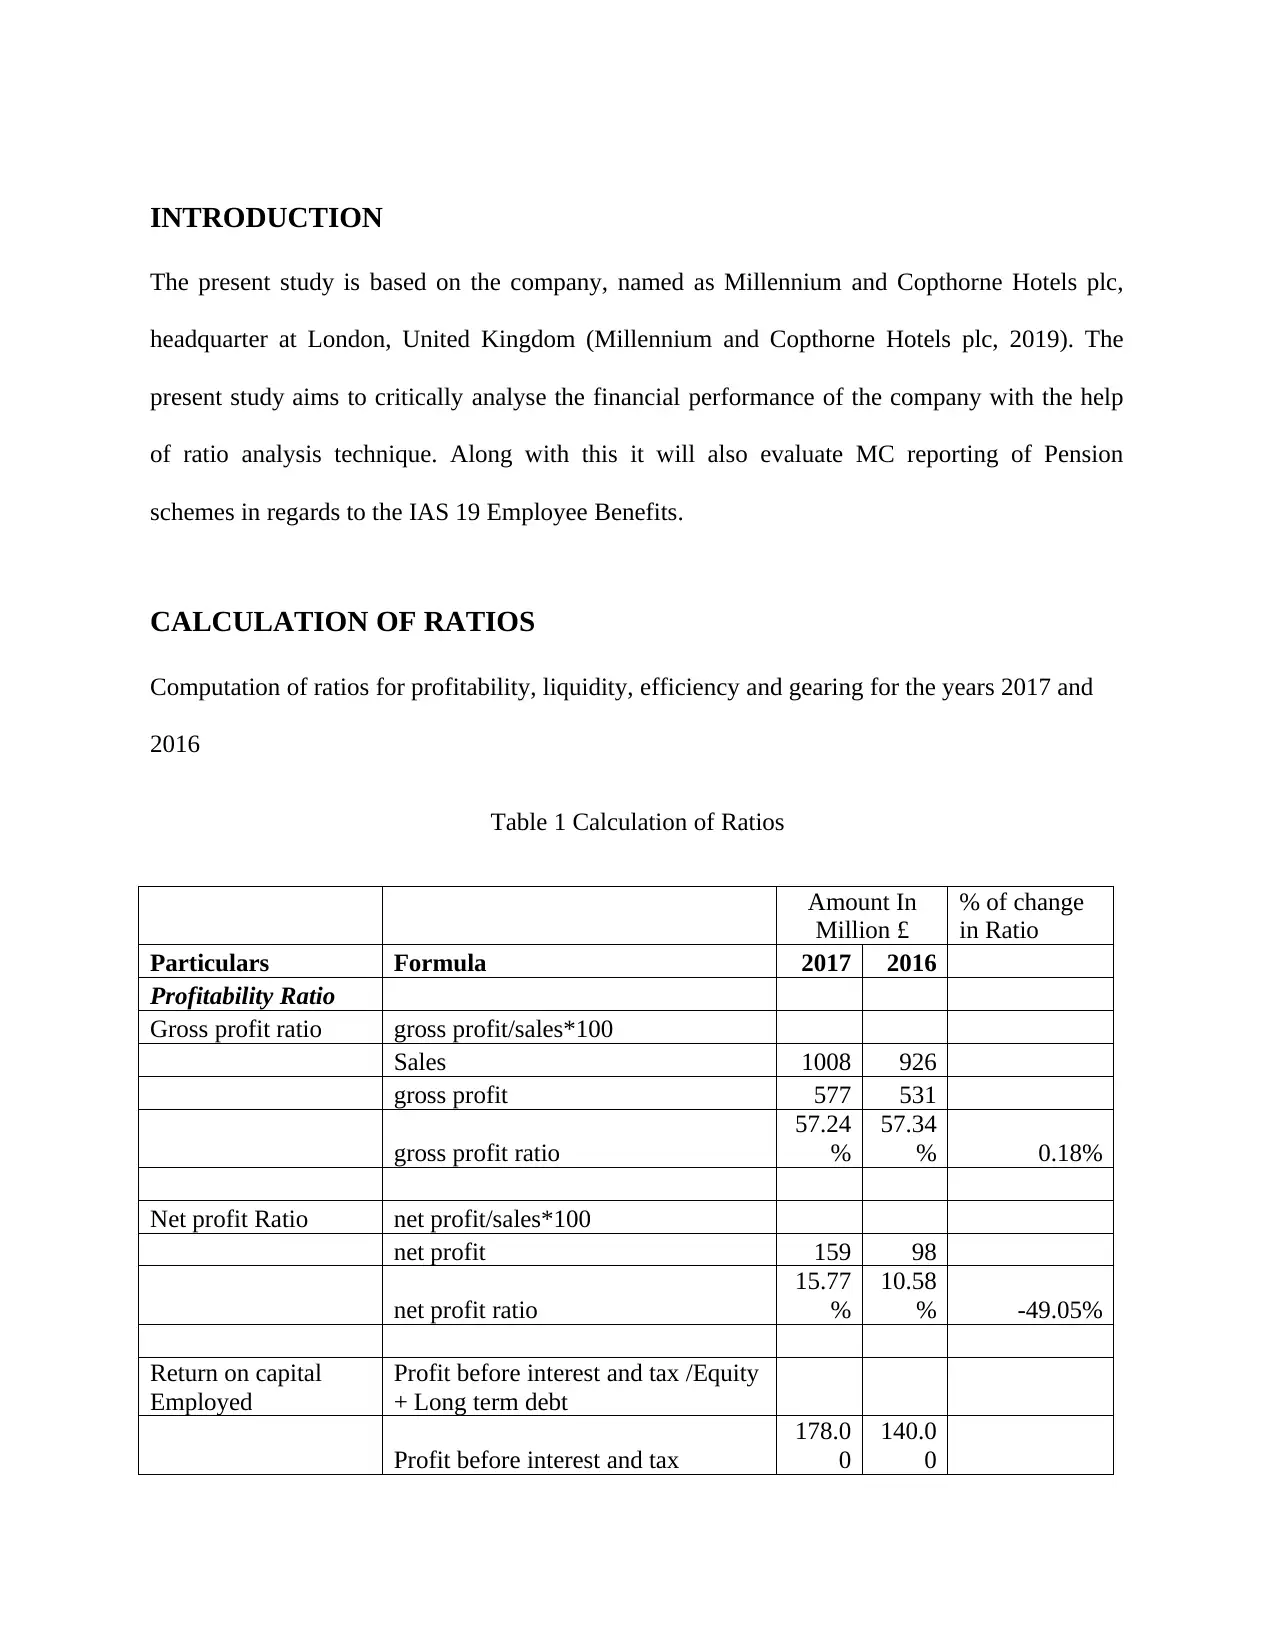
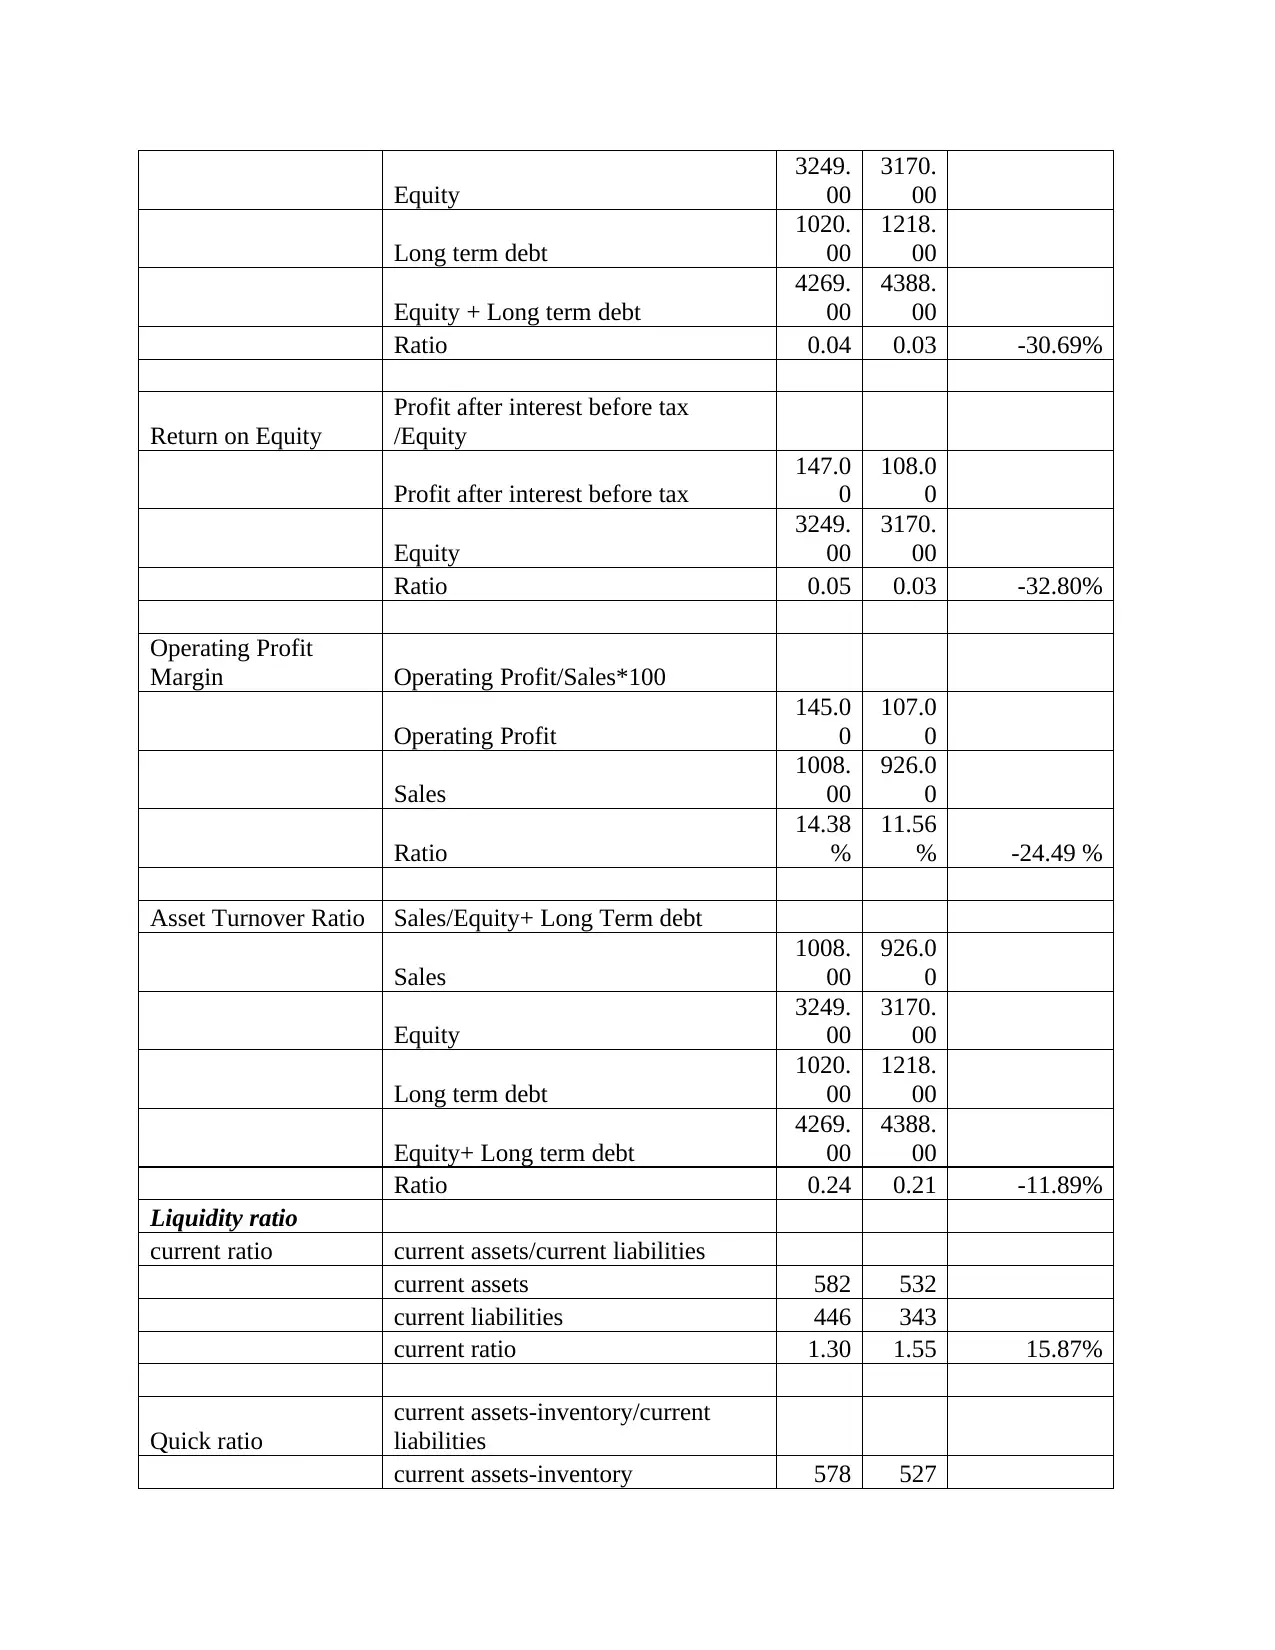
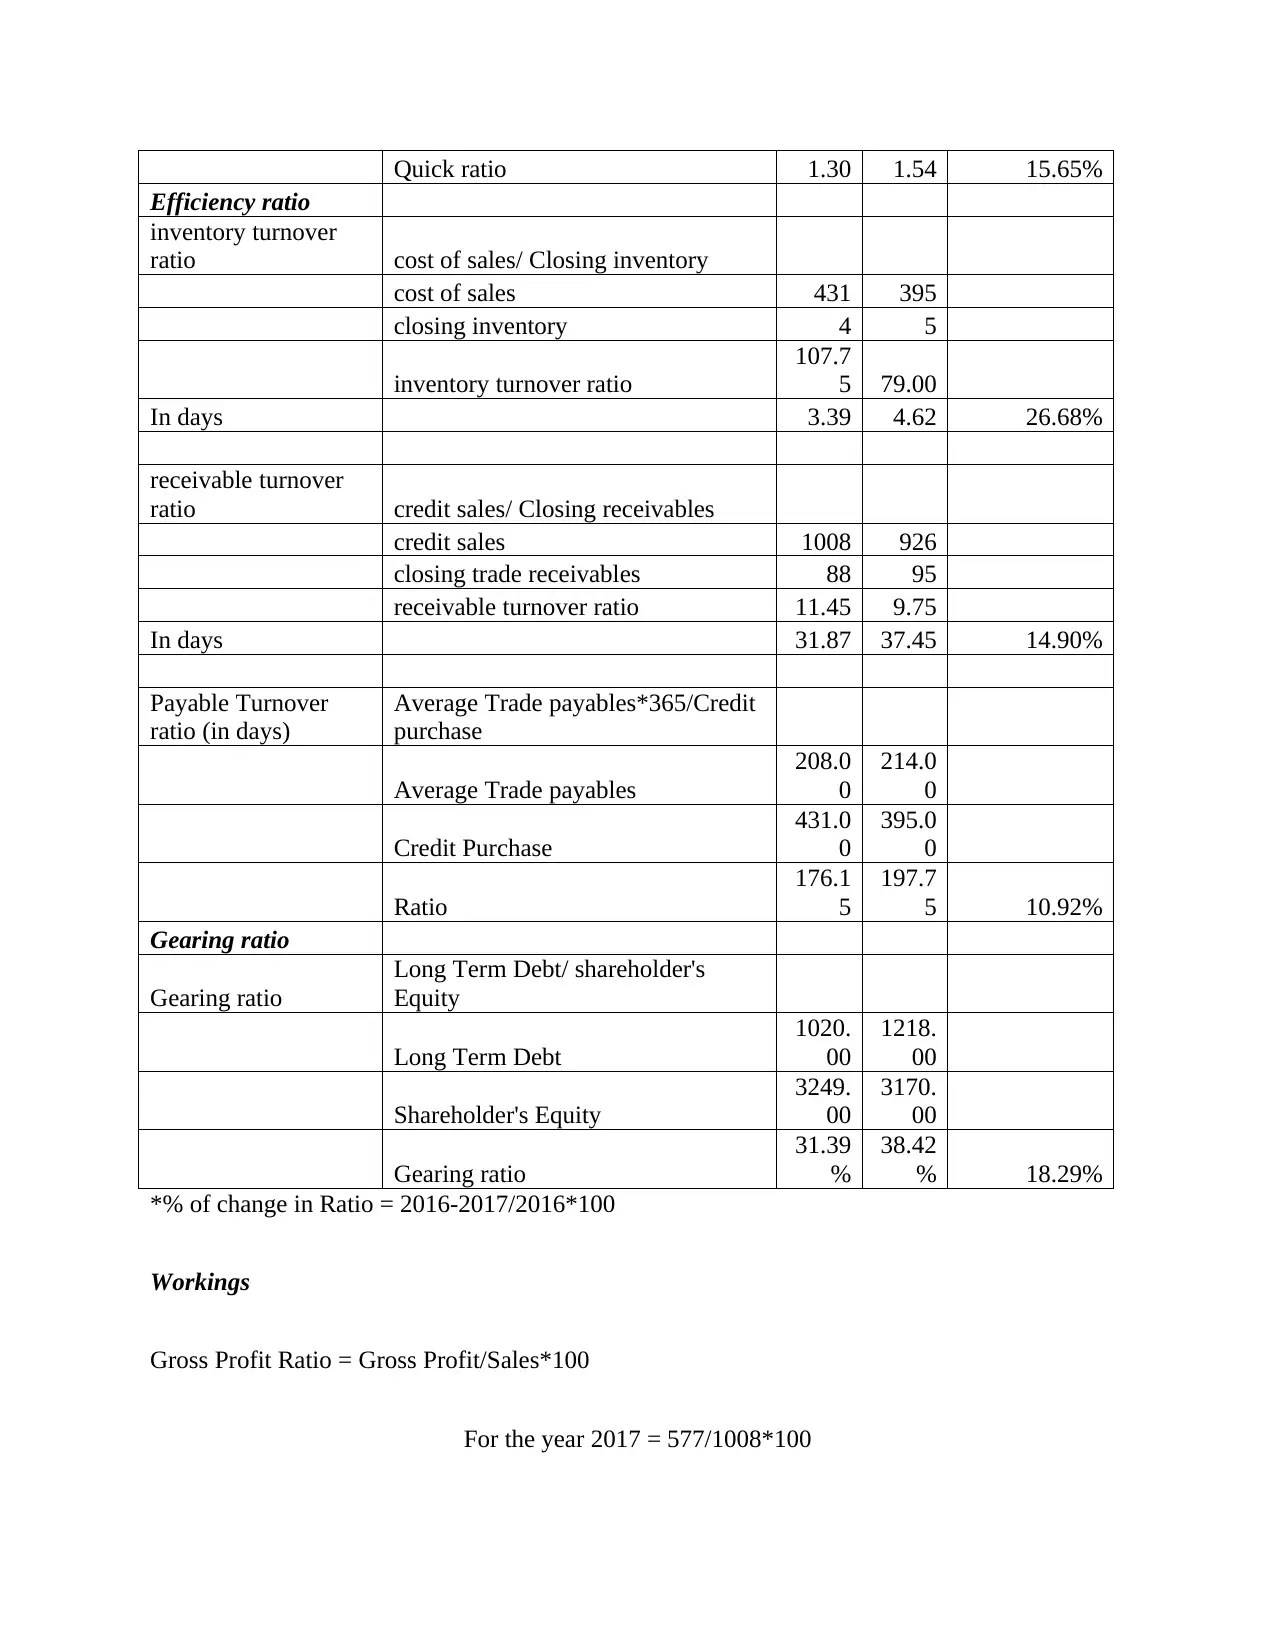
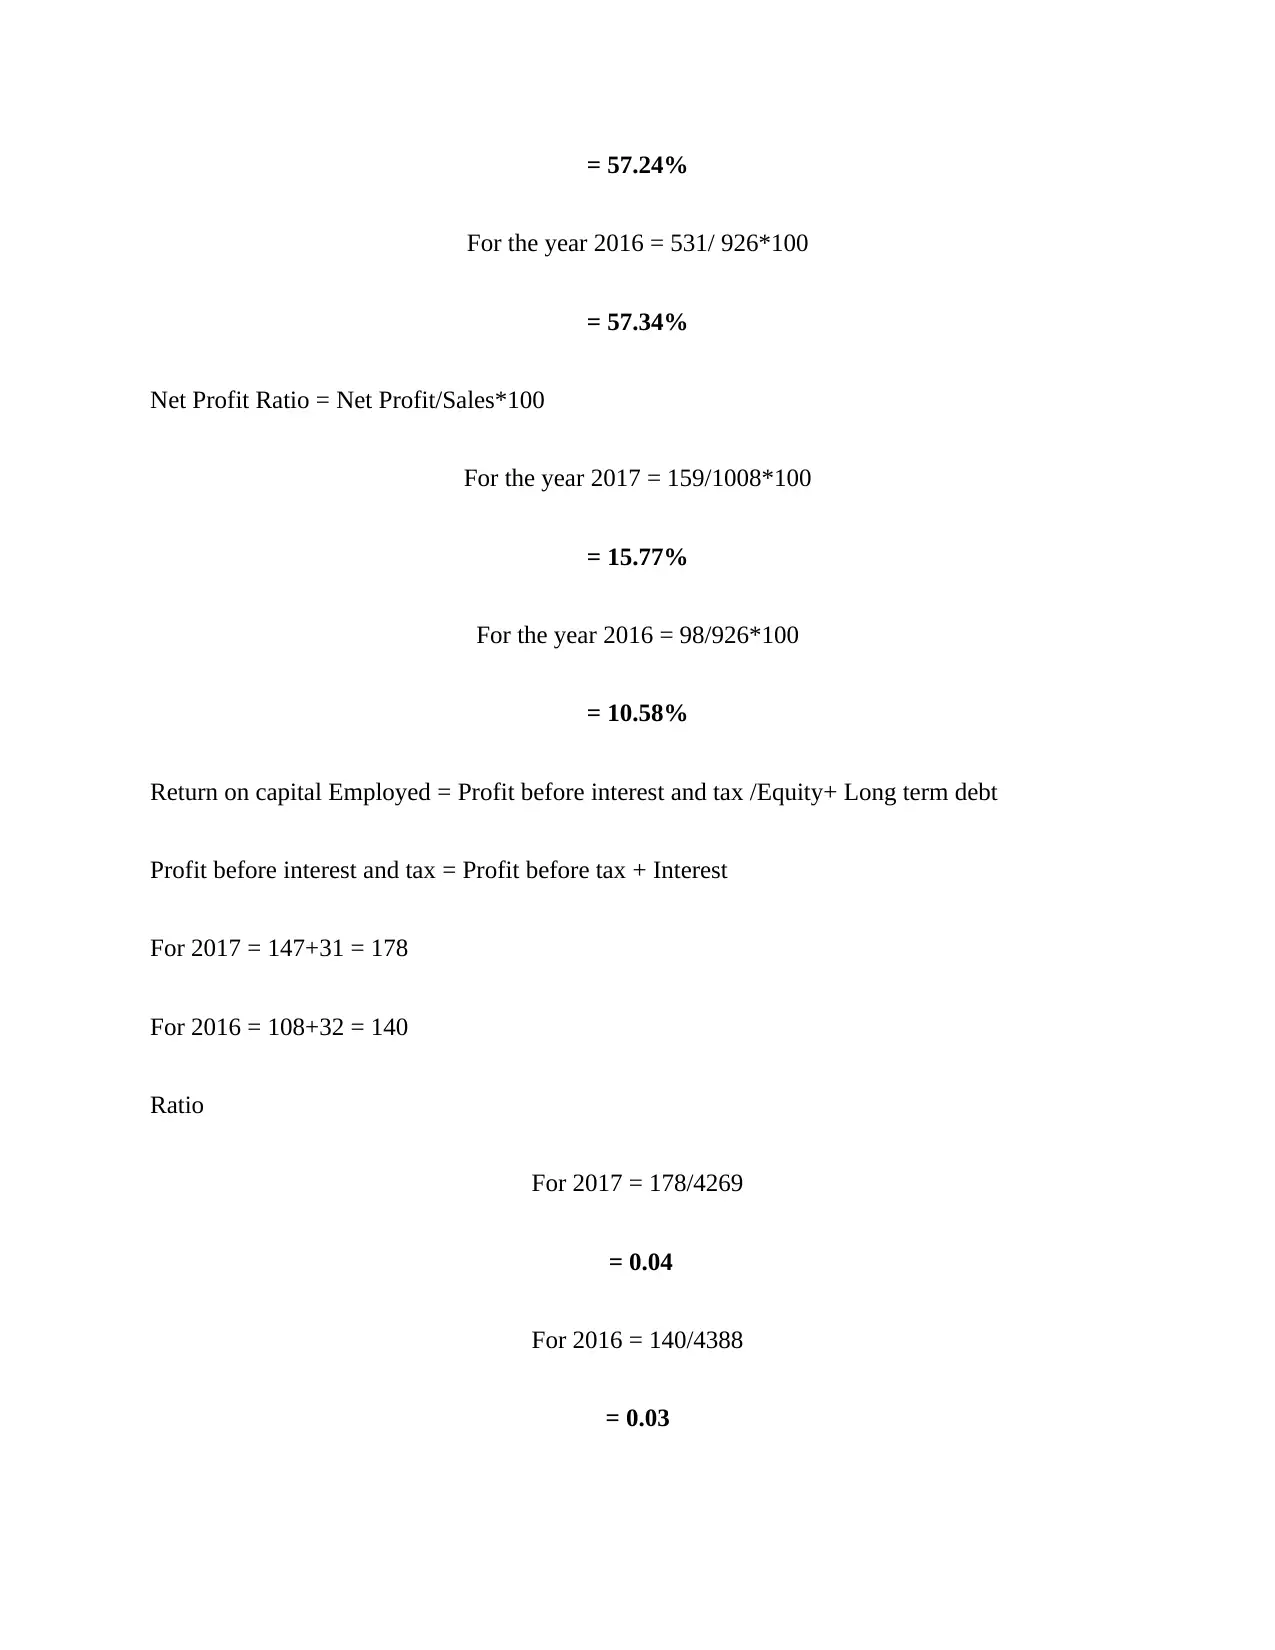
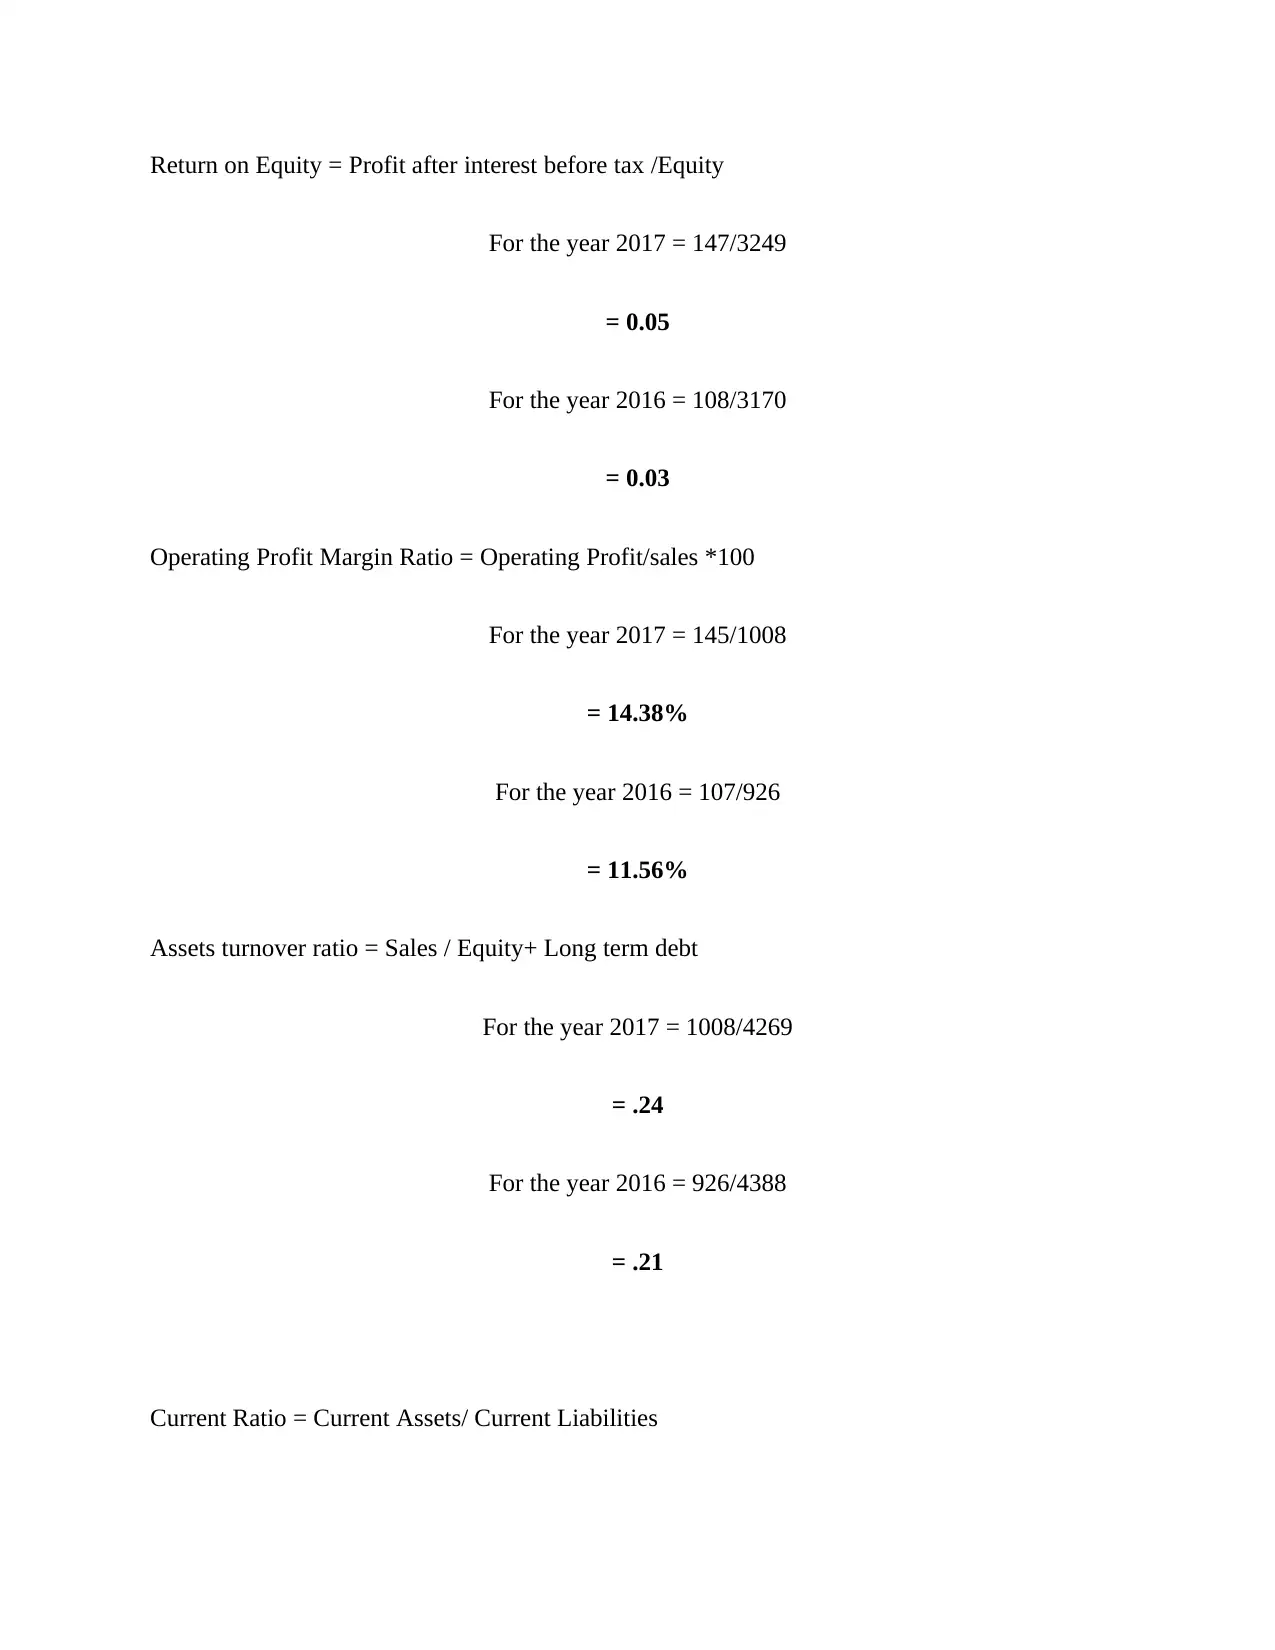
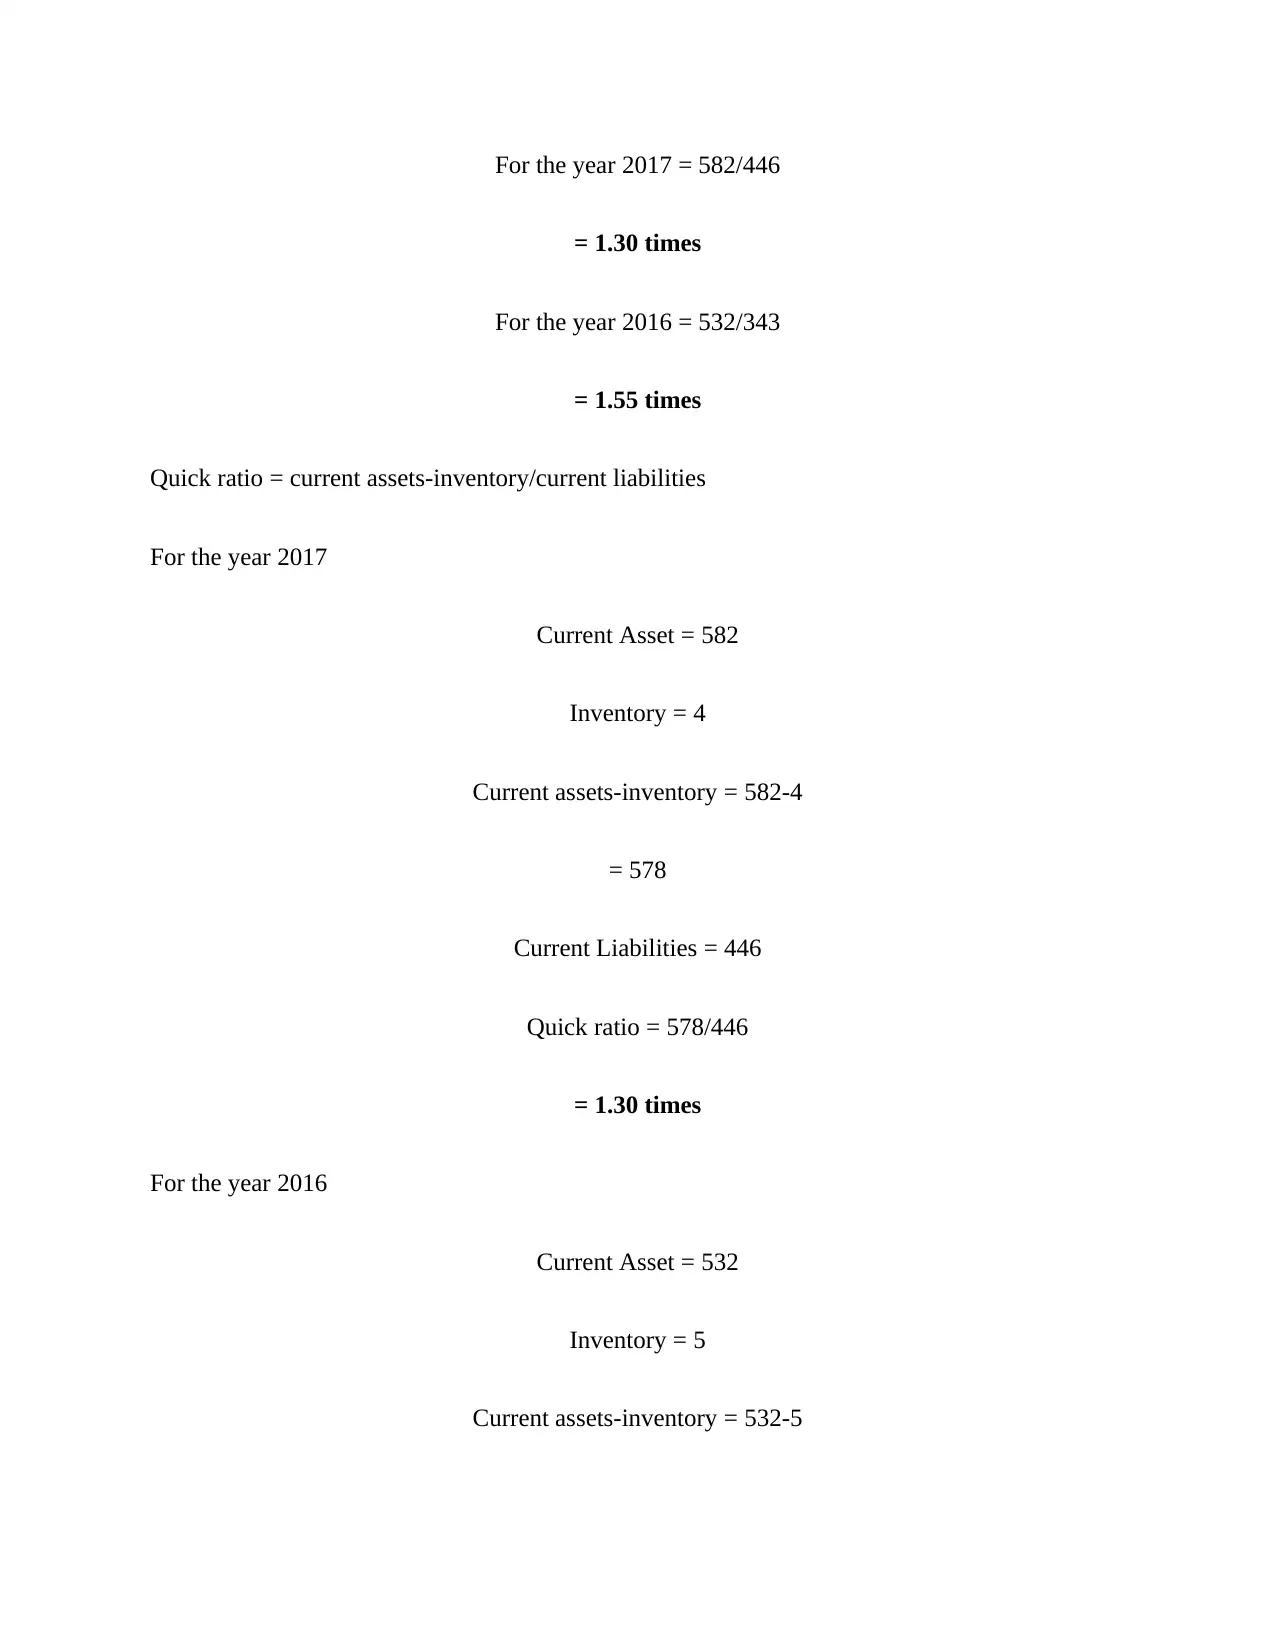
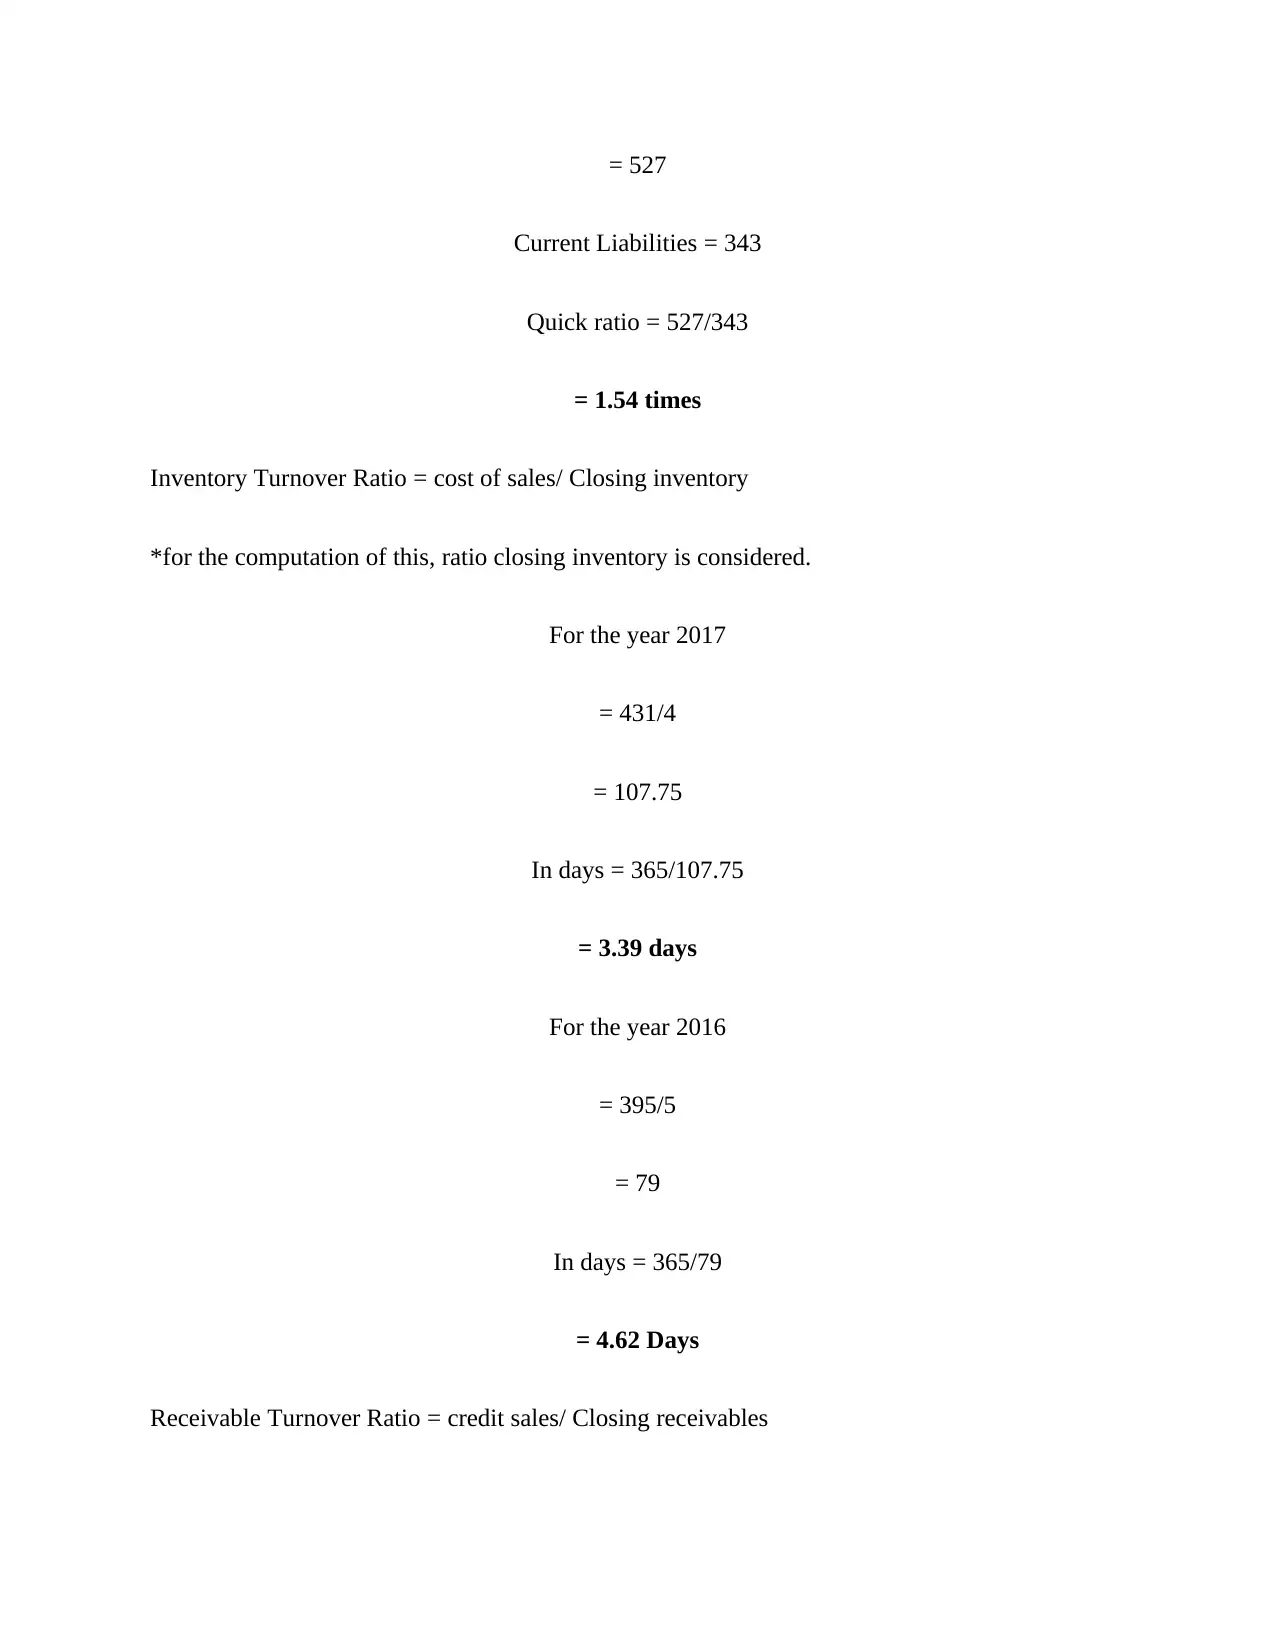
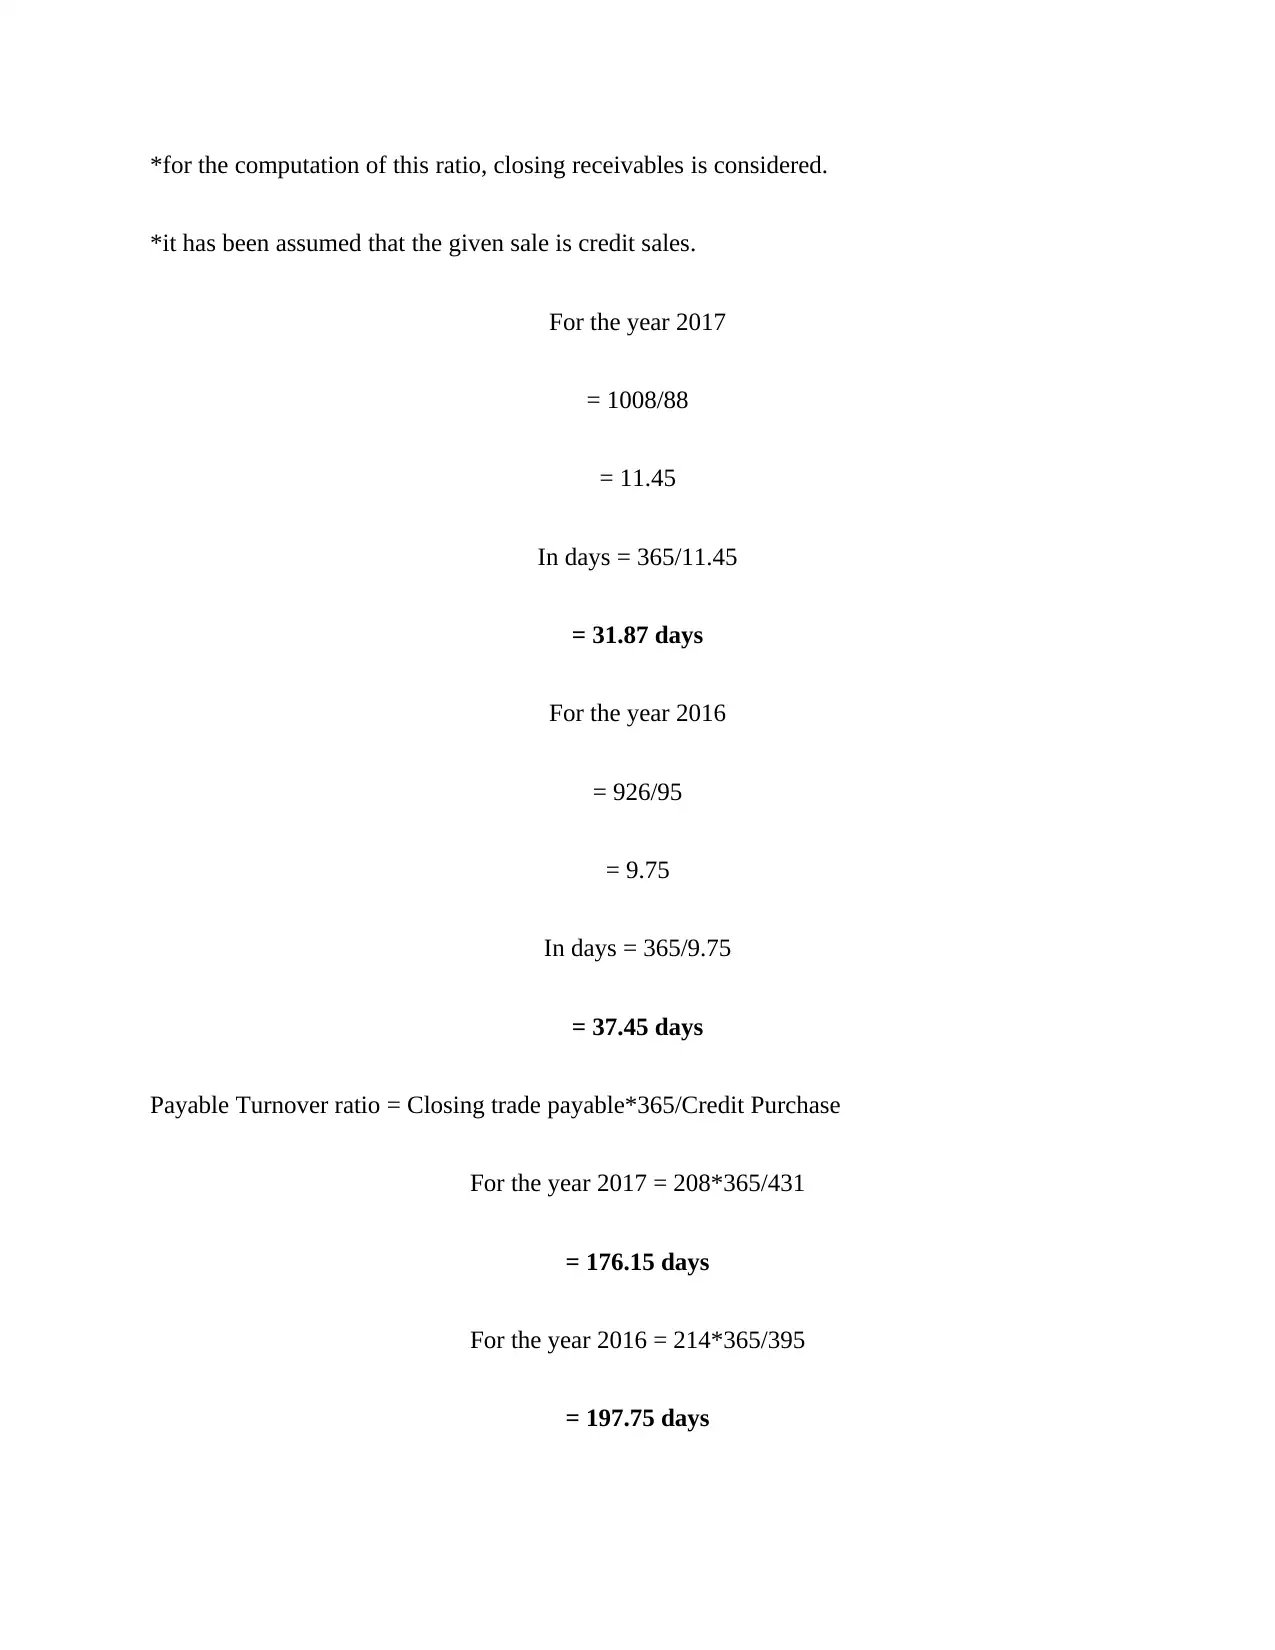
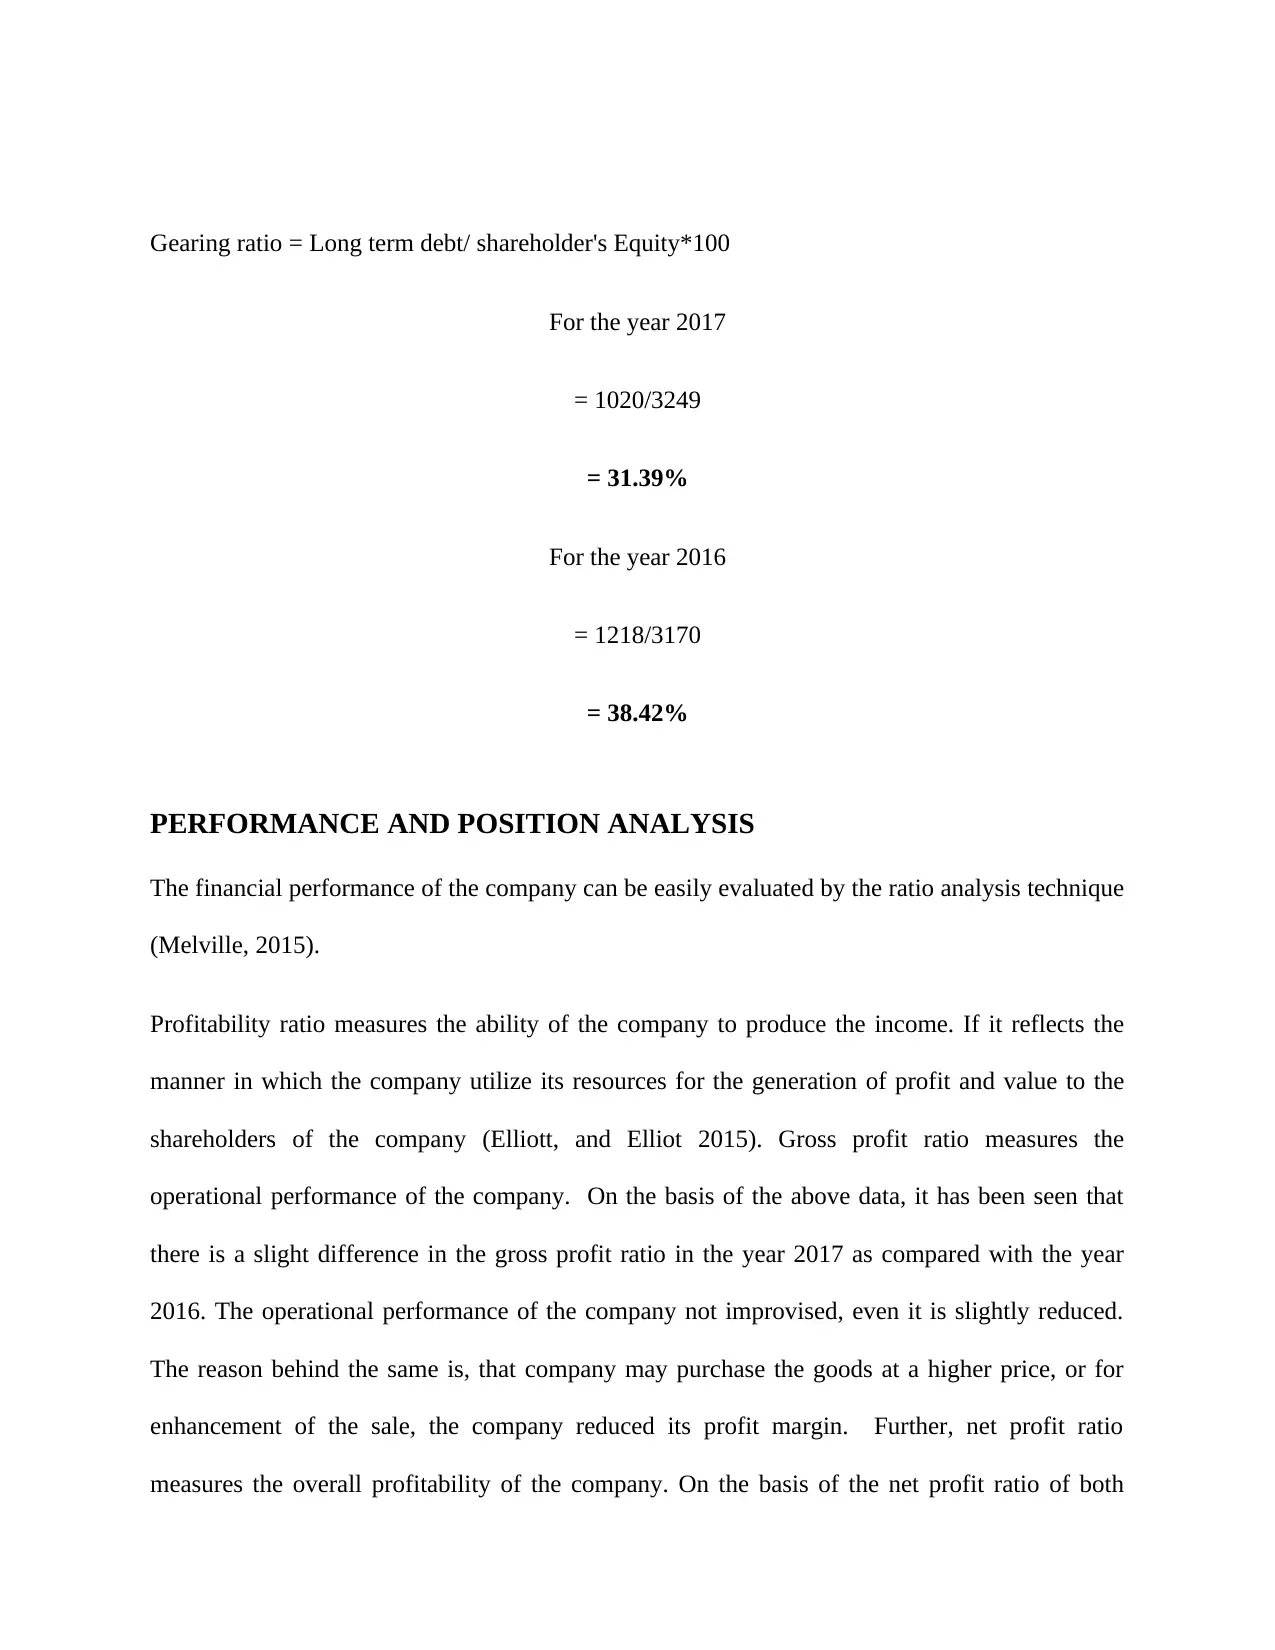
This report offers a comprehensive financial analysis of Millennium and Copthorne Hotels plc, focusing on the company's performance through ratio analysis and addressing the reporting requirements of IAS 19 Employee Benefits, specifically concerning pension schemes. The analysis includes the calculation of profitability, liquidity, efficiency, and gearing ratios for 2017 and 2016, providing insights into the company's operational and financial positions. The report evaluates the company's gross profit, net profit, return on capital employed, return on equity, operating profit margin, asset turnover, and liquidity, including current and quick ratios. It further examines efficiency ratios like inventory and receivable turnover, along with payable turnover and gearing ratios. The study then delves into the application of IAS 19, analyzing the requirements for reporting pension schemes and employee benefits within the context of the company's financial statements. The report concludes with an assessment of the company's financial health and compliance with accounting standards.

Financial Reporting for Business
Paraphrase This Document
Need a fresh take? Get an instant paraphrase of this document with our AI Paraphraser

Table of Contents
Introduction......................................................................................................................................3
Calculation of Ratios.......................................................................................................................3
Performance and Position analysis................................................................................................11
Reporting of IAS 19 Employee Benefit.........................................................................................14
The requirement of reporting of pension schemes as per IAS 19..............................................14
Conclusion.....................................................................................................................................17
References......................................................................................................................................18

INTRODUCTION
The present study is based on the company, named as Millennium and Copthorne Hotels plc,
headquarter at London, United Kingdom (Millennium and Copthorne Hotels plc, 2019). The
present study aims to critically analyse the financial performance of the company with the help
of ratio analysis technique. Along with this it will also evaluate MC reporting of Pension
schemes in regards to the IAS 19 Employee Benefits.
CALCULATION OF RATIOS
Computation of ratios for profitability, liquidity, efficiency and gearing for the years 2017 and
2016
Table 1 Calculation of Ratios
Amount In
Million £
% of change
in Ratio
Particulars Formula 2017 2016
Profitability Ratio
Gross profit ratio gross profit/sales*100
Sales 1008 926
gross profit 577 531
gross profit ratio
57.24
%
57.34
% 0.18%
Net profit Ratio net profit/sales*100
net profit 159 98
net profit ratio
15.77
%
10.58
% -49.05%
Return on capital
Employed
Profit before interest and tax /Equity
+ Long term debt
Profit before interest and tax
178.0
0
140.0
0
⊘ This is a preview!⊘
Do you want full access?
Subscribe today to unlock all pages.

Trusted by 1+ million students worldwide

Equity
3249.
00
3170.
00
Long term debt
1020.
00
1218.
00
Equity + Long term debt
4269.
00
4388.
00
Ratio 0.04 0.03 -30.69%
Return on Equity
Profit after interest before tax
/Equity
Profit after interest before tax
147.0
0
108.0
0
Equity
3249.
00
3170.
00
Ratio 0.05 0.03 -32.80%
Operating Profit
Margin Operating Profit/Sales*100
Operating Profit
145.0
0
107.0
0
Sales
1008.
00
926.0
0
Ratio
14.38
%
11.56
% -24.49 %
Asset Turnover Ratio Sales/Equity+ Long Term debt
Sales
1008.
00
926.0
0
Equity
3249.
00
3170.
00
Long term debt
1020.
00
1218.
00
Equity+ Long term debt
4269.
00
4388.
00
Ratio 0.24 0.21 -11.89%
Liquidity ratio
current ratio current assets/current liabilities
current assets 582 532
current liabilities 446 343
current ratio 1.30 1.55 15.87%
Quick ratio
current assets-inventory/current
liabilities
current assets-inventory 578 527
3249.
00
3170.
00
Long term debt
1020.
00
1218.
00
Equity + Long term debt
4269.
00
4388.
00
Ratio 0.04 0.03 -30.69%
Return on Equity
Profit after interest before tax
/Equity
Profit after interest before tax
147.0
0
108.0
0
Equity
3249.
00
3170.
00
Ratio 0.05 0.03 -32.80%
Operating Profit
Margin Operating Profit/Sales*100
Operating Profit
145.0
0
107.0
0
Sales
1008.
00
926.0
0
Ratio
14.38
%
11.56
% -24.49 %
Asset Turnover Ratio Sales/Equity+ Long Term debt
Sales
1008.
00
926.0
0
Equity
3249.
00
3170.
00
Long term debt
1020.
00
1218.
00
Equity+ Long term debt
4269.
00
4388.
00
Ratio 0.24 0.21 -11.89%
Liquidity ratio
current ratio current assets/current liabilities
current assets 582 532
current liabilities 446 343
current ratio 1.30 1.55 15.87%
Quick ratio
current assets-inventory/current
liabilities
current assets-inventory 578 527
Paraphrase This Document
Need a fresh take? Get an instant paraphrase of this document with our AI Paraphraser

Quick ratio 1.30 1.54 15.65%
Efficiency ratio
inventory turnover
ratio cost of sales/ Closing inventory
cost of sales 431 395
closing inventory 4 5
inventory turnover ratio
107.7
5 79.00
In days 3.39 4.62 26.68%
receivable turnover
ratio credit sales/ Closing receivables
credit sales 1008 926
closing trade receivables 88 95
receivable turnover ratio 11.45 9.75
In days 31.87 37.45 14.90%
Payable Turnover
ratio (in days)
Average Trade payables*365/Credit
purchase
Average Trade payables
208.0
0
214.0
0
Credit Purchase
431.0
0
395.0
0
Ratio
176.1
5
197.7
5 10.92%
Gearing ratio
Gearing ratio
Long Term Debt/ shareholder's
Equity
Long Term Debt
1020.
00
1218.
00
Shareholder's Equity
3249.
00
3170.
00
Gearing ratio
31.39
%
38.42
% 18.29%
*% of change in Ratio = 2016-2017/2016*100
Workings
Gross Profit Ratio = Gross Profit/Sales*100
For the year 2017 = 577/1008*100

= 57.24%
For the year 2016 = 531/ 926*100
= 57.34%
Net Profit Ratio = Net Profit/Sales*100
For the year 2017 = 159/1008*100
= 15.77%
For the year 2016 = 98/926*100
= 10.58%
Return on capital Employed = Profit before interest and tax /Equity+ Long term debt
Profit before interest and tax = Profit before tax + Interest
For 2017 = 147+31 = 178
For 2016 = 108+32 = 140
Ratio
For 2017 = 178/4269
= 0.04
For 2016 = 140/4388
= 0.03
⊘ This is a preview!⊘
Do you want full access?
Subscribe today to unlock all pages.

Trusted by 1+ million students worldwide

Return on Equity = Profit after interest before tax /Equity
For the year 2017 = 147/3249
= 0.05
For the year 2016 = 108/3170
= 0.03
Operating Profit Margin Ratio = Operating Profit/sales *100
For the year 2017 = 145/1008
= 14.38%
For the year 2016 = 107/926
= 11.56%
Assets turnover ratio = Sales / Equity+ Long term debt
For the year 2017 = 1008/4269
= .24
For the year 2016 = 926/4388
= .21
Current Ratio = Current Assets/ Current Liabilities
Paraphrase This Document
Need a fresh take? Get an instant paraphrase of this document with our AI Paraphraser

For the year 2017 = 582/446
= 1.30 times
For the year 2016 = 532/343
= 1.55 times
Quick ratio = current assets-inventory/current liabilities
For the year 2017
Current Asset = 582
Inventory = 4
Current assets-inventory = 582-4
= 578
Current Liabilities = 446
Quick ratio = 578/446
= 1.30 times
For the year 2016
Current Asset = 532
Inventory = 5
Current assets-inventory = 532-5
= 1.30 times
For the year 2016 = 532/343
= 1.55 times
Quick ratio = current assets-inventory/current liabilities
For the year 2017
Current Asset = 582
Inventory = 4
Current assets-inventory = 582-4
= 578
Current Liabilities = 446
Quick ratio = 578/446
= 1.30 times
For the year 2016
Current Asset = 532
Inventory = 5
Current assets-inventory = 532-5

= 527
Current Liabilities = 343
Quick ratio = 527/343
= 1.54 times
Inventory Turnover Ratio = cost of sales/ Closing inventory
*for the computation of this, ratio closing inventory is considered.
For the year 2017
= 431/4
= 107.75
In days = 365/107.75
= 3.39 days
For the year 2016
= 395/5
= 79
In days = 365/79
= 4.62 Days
Receivable Turnover Ratio = credit sales/ Closing receivables
⊘ This is a preview!⊘
Do you want full access?
Subscribe today to unlock all pages.

Trusted by 1+ million students worldwide

*for the computation of this ratio, closing receivables is considered.
*it has been assumed that the given sale is credit sales.
For the year 2017
= 1008/88
= 11.45
In days = 365/11.45
= 31.87 days
For the year 2016
= 926/95
= 9.75
In days = 365/9.75
= 37.45 days
Payable Turnover ratio = Closing trade payable*365/Credit Purchase
For the year 2017 = 208*365/431
= 176.15 days
For the year 2016 = 214*365/395
= 197.75 days
Paraphrase This Document
Need a fresh take? Get an instant paraphrase of this document with our AI Paraphraser

Gearing ratio = Long term debt/ shareholder's Equity*100
For the year 2017
= 1020/3249
= 31.39%
For the year 2016
= 1218/3170
= 38.42%
PERFORMANCE AND POSITION ANALYSIS
The financial performance of the company can be easily evaluated by the ratio analysis technique
(Melville, 2015).
Profitability ratio measures the ability of the company to produce the income. If it reflects the
manner in which the company utilize its resources for the generation of profit and value to the
shareholders of the company (Elliott, and Elliot 2015). Gross profit ratio measures the
operational performance of the company. On the basis of the above data, it has been seen that
there is a slight difference in the gross profit ratio in the year 2017 as compared with the year
2016. The operational performance of the company not improvised, even it is slightly reduced.
The reason behind the same is, that company may purchase the goods at a higher price, or for
enhancement of the sale, the company reduced its profit margin. Further, net profit ratio
measures the overall profitability of the company. On the basis of the net profit ratio of both

years, it has been observed that the overall profitability of the company gets improvised in the
year 2017 as compared with the year 2016 (Millennium and Copthorne Hotels plc, 2017). The
reason behind the improvement in the performance was increased in the operating income, and
an increase in the financial income of the company (Helfert, 2011). Further, the unnecessary
expenses also cut down by the company, by which the profitability of the company improved.
Return on capital employed shows the profitability of company, by considering the amount of
capital used by company (Fridson, and Alvarez, 2011). The reason behind the same, was,
payment of debt, improved sales, or reduction in cost. Return on equity shows the wellness of the
company for using investment to generate profit. In the year 2017, company acquire some
investment, by which the profitability of the company improvised. Operating profit margin
shows, profit from operational activities. The company through geographical diversification of
its activities such as UK acquisition, gain benefit and enhanced its operational performance.
Asset turnover ratio shows company’s revenue relative to its total assets. The improvement in
management of inventory is the reason for improved asset turnover ratio.
Further, the liquidity ratio measures the liquidity position of the company for the payment of its
obligation (Bauer, O’Brien, and Umar, 2014. The current ratio measures the capability of the
company to meet its short term obligation by utilization of its short term asset. The company
should have twice its current asset as compared with its current liabilities (Williams, and
Dobelman, 2017). The high current ratio indicates that not effective utilization of current asset of
the company and low indication indicates that the company may face difficulty in payment of
short term obligation (Chandra, 2017). On the basis of the above calculation, it has been
evaluated that the liquidity position of the company is not as better as in the year 2017 as
compared with the year 2016. The reason for the decrease in current ratio is because of the
⊘ This is a preview!⊘
Do you want full access?
Subscribe today to unlock all pages.

Trusted by 1+ million students worldwide
1 out of 19
Related Documents

Your All-in-One AI-Powered Toolkit for Academic Success.
+13062052269
info@desklib.com
Available 24*7 on WhatsApp / Email
Unlock your academic potential
Copyright © 2020–2025 A2Z Services. All Rights Reserved. Developed and managed by ZUCOL.