Statistical Analysis Project: Milton Keynes Central Passenger Data

Verified

Added on  2021/02/19

|8
|1333
|28
Project
AI Summary
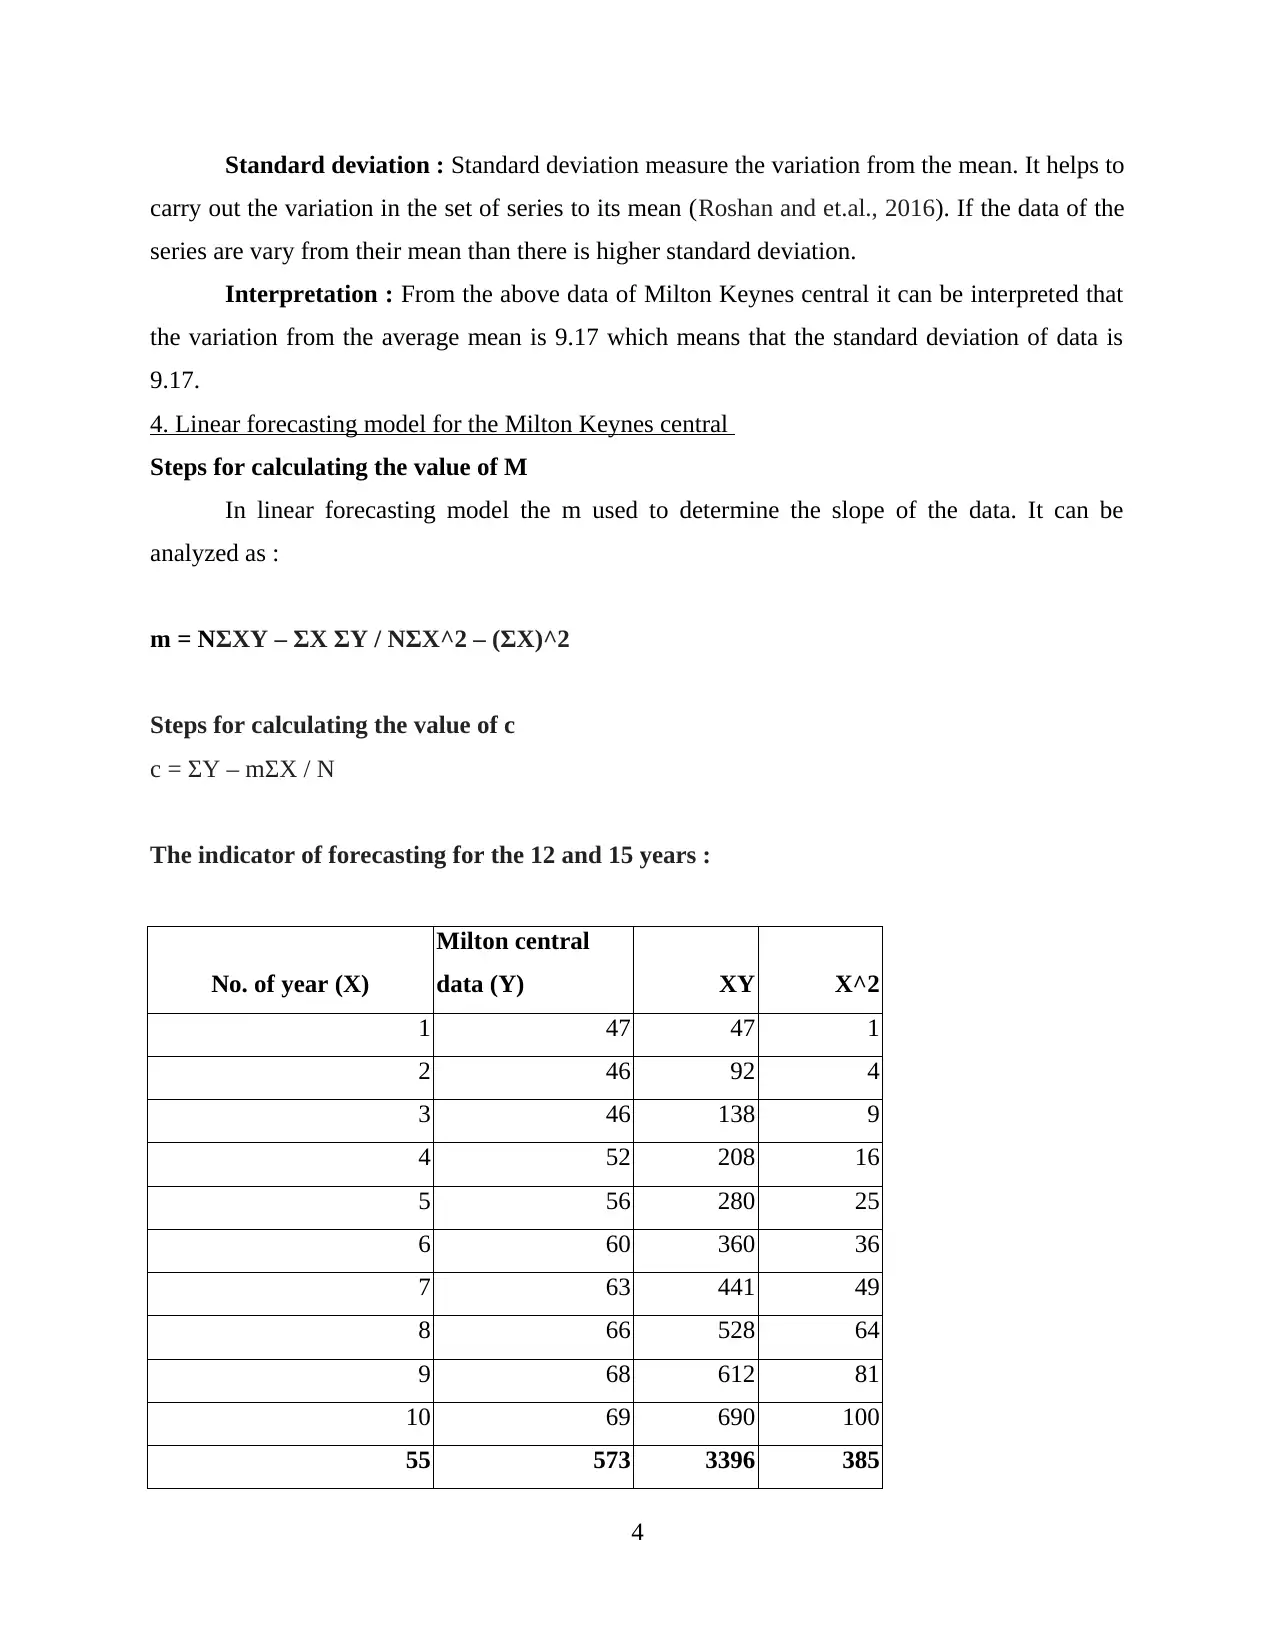
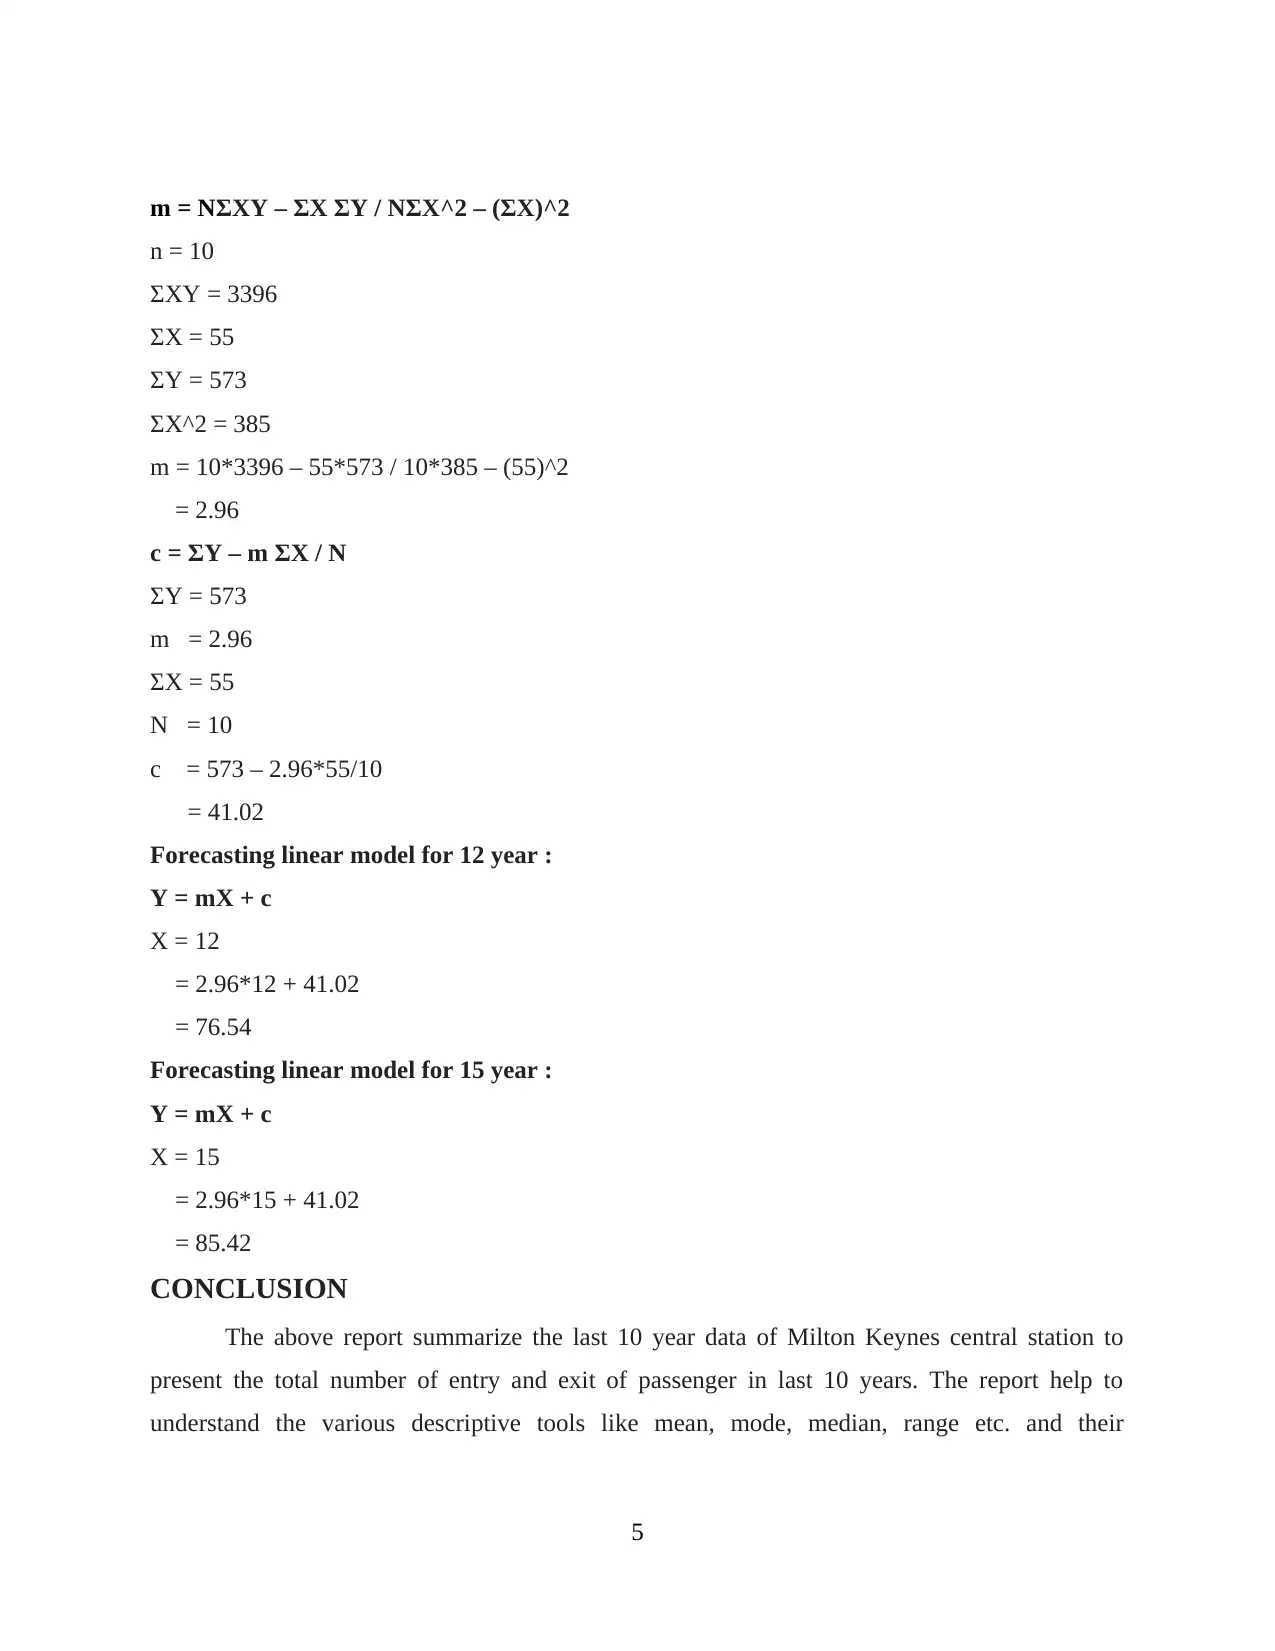
This individual project analyzes passenger data from Milton Keynes Central railway station over a 10-year period (2008-2017). The project begins with a presentation of the data in tabular form, followed by data visualization through charts. Key statistical measures, including mean, median, mode, standard deviation, and range, are calculated and interpreted to understand passenger trends. Furthermore, the project employs a linear forecasting model to predict passenger numbers for future years (2012 and 2015). The report concludes with a summary of findings and includes references to relevant sources. The project demonstrates the application of statistical tools in analyzing real-world data and making predictions. The data analysis includes the calculation of mean, median, mode, standard deviation and range. A linear forecasting model is used to forecast passenger numbers.
Document Page
INDIVIDUAL PROJECT
tabler-icon-diamond-filled.svg

Paraphrase This Document

Need a fresh take? Get an instant paraphrase of this document with our AI Paraphraser
Document Page
Table of Contents
INTRODUCTION...........................................................................................................................1
1. Last 10 year data of entry and exit of passenger of the Milton Keynes central......................1
2. Presentation of data in the form of different charts.................................................................1
3. Calculation of mean, median, mode, standard deviation and range........................................2
4. Linear forecasting model for the Milton Keynes central .......................................................3
CONCLUSION ...............................................................................................................................5
REFERENCES................................................................................................................................6
Document Page
INTRODUCTION
Milton Keynes Railway Station is located in west coast main line and spread in 80 km of
northwest of London. It was opened in 1982 and it is the most busiest route. The report
highlights the data of last 10 year of entry and exit of the passenger in Milton Keynes Central. It
helps to present the data in different graph to understand them much better way. It also describes
the mean, median, mode, standard deviation and range of the last 10 year of data (Definition of
'Standard Deviation'. 2019). The report highlights the use of linear forecasting model to forecast
the situation of Milton Keynes Station in different years.
1. Last 10 year data of entry and exit of passenger of the Milton Keynes central
In thousands
Milton Keynes central
2008 47
2009 46
2010 46
2011 52
2012 56
2013 60
2014 63
2015 66
2016 68
2017 69
The above table shows the total number of entry and exit of passenger in last 10 year of
Milton Keynes central. The data are present in the value of thousand.
2. Presentation of data in the form of different charts
The last 10 year data of Milton Keynes central
1
Document Page
4 7 4 6
4 6
5 2
5 6
6 0
6 3
6 6
6 8
6 9
Milto n K e y n e s c e n tra l
3 0 /0 6 /1 9 0 5 0 1 /0 7 /1 9 0 5 0 2 /0 7 /1 9 0 5 0 3 /0 7 /1 9 0 5 0 4 /0 7 /1 9 0 5
0 5 /0 7 /1 9 0 5 0 6 /0 7 /1 9 0 5 0 7 /0 7 /1 9 0 5 0 8 /0 7 /1 9 0 5 0 9 /0 7 /1 9 0 5
3 0 /0 6 /1 9 0 5
0 1 /0 7 /1 9 0 5
0 2 /0 7 /1 9 0 5
0 3 /0 7 /1 9 0 5
0 4 /0 7 /1 9 0 5
0 5 /0 7 /1 9 0 5
0 6 /0 7 /1 9 0 5
0 7 /0 7 /1 9 0 5
0 8 /0 7 /1 9 0 5
0 9 /0 7 /1 9 0 5
05 01 0 0
4 7 4 6 4 6 5 2 5 6 6 0 6 3 6 6 6 8 6 9
Milto n K e y n e s c e n tra l
3. Calculation of mean, median, mode, standard deviation and range
Milton Keynes central
Mean 57.3
Standard Error 2.9022979401
Median 58
Mode 46
Standard Deviation 9.1778719393
Sample Variance 84.2333333333
Kurtosis -1.7756697339
Skewness -0.0789695544
Range 23
2
tabler-icon-diamond-filled.svg

Paraphrase This Document

Need a fresh take? Get an instant paraphrase of this document with our AI Paraphraser
Document Page
Minimum 46
Maximum 69
Sum 573
Count 10
Largest(1) 69
Smallest(1) 46
Confidence Level(95.0%) 6.5654540739
Mean : mean is the average of the range value and divided by the total no. of value.
Mean is also known as arithmetic mean (Zhang 2016). It is the most suitable method to calculate
the mid point. It is a simplest and quick calculation method.
Interpretation : In the above case study the mean of the data of Milton Keynes central is
57.3 which shows that the average no. of entry and exit of passenger.
Median : Median is the middle number in the sequence of number (Davis 2015). Median
are used to define the central value. It can be calculated by the total number of values + 1 divided
by 2. For example there are values like 2, 5, 7, 8, 11. The median of the number are 7 (total no.
of values = 5+1/2 = 3). The third no. of the sequence after adjusting them in ascending or
descending no. is 7.
Interpretation : The median of the above case study is 58 which means that the average
of the entry and exit of total no. of passenger in last 10 year is 58.
Mode : mode is most frequent number come across the set of the sequence. If the some
no. are repeated in a set of sequence than the no. which occurs the most in the series is known as
mode. There is possibility that mode can be more than two number.
Interpretation : from the above data of the Milton Keynes central it can be concluded
that the most frequent number of entry and exit of passenger in last 10 year is 46.
Range : the difference between the highest and the lowest value within the set of the
values. For the calculation of the range subtract the lowest no. from the highest number (Wikswo
and et.al., 2015).
Interpretation : From the above data it can be concluded that the range of the entry and
exit of passenger is 23 in last 10 year.
3
Document Page
Standard deviation : Standard deviation measure the variation from the mean. It helps to
carry out the variation in the set of series to its mean (Roshan and et.al., 2016). If the data of the
series are vary from their mean than there is higher standard deviation.
Interpretation : From the above data of Milton Keynes central it can be interpreted that
the variation from the average mean is 9.17 which means that the standard deviation of data is
9.17.
4. Linear forecasting model for the Milton Keynes central
Steps for calculating the value of M
In linear forecasting model the m used to determine the slope of the data. It can be
analyzed as :
m = NΣXY – ΣX ΣY / NΣX^2 – (ΣX)^2
Steps for calculating the value of c
c = ΣY – mΣX / N
The indicator of forecasting for the 12 and 15 years :
No. of year (X)
Milton central
data (Y) XY X^2
1 47 47 1
2 46 92 4
3 46 138 9
4 52 208 16
5 56 280 25
6 60 360 36
7 63 441 49
8 66 528 64
9 68 612 81
10 69 690 100
55 573 3396 385
4
Document Page
m = NΣXY – ΣX ΣY / NΣX^2 – (ΣX)^2
n = 10
ΣXY = 3396
ΣX = 55
ΣY = 573
ΣX^2 = 385
m = 10*3396 – 55*573 / 10*385 – (55)^2
= 2.96
c = ΣY – m ΣX / N
ΣY = 573
m = 2.96
ΣX = 55
N = 10
c = 573 – 2.96*55/10
= 41.02
Forecasting linear model for 12 year :
Y = mX + c
X = 12
= 2.96*12 + 41.02
= 76.54
Forecasting linear model for 15 year :
Y = mX + c
X = 15
= 2.96*15 + 41.02
= 85.42
CONCLUSION
The above report summarize the last 10 year data of Milton Keynes central station to
present the total number of entry and exit of passenger in last 10 years. The report help to
understand the various descriptive tools like mean, mode, median, range etc. and their
5
tabler-icon-diamond-filled.svg

Paraphrase This Document

Need a fresh take? Get an instant paraphrase of this document with our AI Paraphraser
Document Page
implication in the railway line customer. It also help to understand the use of linear forecasting
model in Milton Keynes Central.
REFERENCES
Books and Journals
Davis, J., 2015. Know your median from your mean and mode. Primary Teacher
Update, 2015(43). pp.35-36.
Roshan and et.al., 2016. Human keratinocytes have two interconvertible modes of
proliferation.Nature cell biology, 18(2). p.145.
Wikswo and et.al., 2015. Outbreaks of acute gastroenteritis transmitted by person-to-person
contact, environmental contamination, and unknown modes of transmission—United
States, 2009–2013. Morbidity and Mortality Weekly Report: Surveillance
Summaries, 64(12). pp.1-16.
6
chevron_up_icon
1 out of 8
circle_padding
hide_on_mobile
zoom_out_icon
[object Object]