Comprehensive Financial Performance Analysis of Mineral Resource Ltd
VerifiedAdded on 2020/05/16
|18
|2712
|58
Report
AI Summary
This report presents a comprehensive financial performance analysis of Mineral Resource Ltd, evaluating its financial health through various tools. It includes an overview of the company's operations, ownership structure, and governance. The analysis delves into ratio analysis, including ROA, ROE, and debt ratios, to assess the company's profitability and financial leverage over a four-year period. Furthermore, the report examines the movement of the company's share price, comparing it to the broader market index and computing the beta value. The study also incorporates the Capital Asset Pricing Model (CAPM) to determine the required rate of return and calculates the Weighted Average Cost of Capital (WACC), discussing its implications for investment decisions. The report concludes with a letter of recommendation, suggesting investment strategies based on the financial analysis. Finally, the report highlights the company's dividend policies and overall financial stability. The analysis is based on the company's annual reports and relevant financial data.
RUNNING HEAD: Financial performance analysis of Mineral resource Ltd 1
Name of the student
Topic- Financial performance analysis of Mineral resource Ltd
University name
Name of the student
Topic- Financial performance analysis of Mineral resource Ltd
University name
Paraphrase This Document
Need a fresh take? Get an instant paraphrase of this document with our AI Paraphraser
Financial performance analysis of Mineral resource Ltd
2
Table of Contents
Introduction...........................................................................................................................................2
1. Present description of the company..........................................................................................2
2. Ownership and governance structure...........................................................................................2
3. Performance ratio analysis of Mineral resource Ltd......................................................................3
4. Movement of share price of Mineral resources limited.................................................................5
4.1 Graph of share price movement of Mineral resources limited....................................................5
4.2 Comparison of share price movement of Mineral resources limited with the movement of share
price of all ordinary index..................................................................................................................6
5. Announcements............................................................................................................................7
6. Research via internet.....................................................................................................................7
6.1 The beta computation...........................................................................................................7
6.2 Computation of required rate of return by using CAPM method................................................8
6.3 Determination of conservative investment.................................................................................8
7. Weighted Average Cost of Capital (WACC)....................................................................................9
7.1 Cost of equity (calculated above using CAPM........................................................................9
7.2 Implications that a higher WACC on investment decision...........................................................9
8. Consideration of debt ratio for the company..............................................................................10
8.1 Appear to stable............................................................................................................................10
8.2 Gearing ratio discussion.............................................................................................................10
9. Divided policies of company........................................................................................................11
10. Letter of recommendation.......................................................................................................11
11. Conclusion...............................................................................................................................12
12. References...............................................................................................................................13
13. Appendix..................................................................................................................................14
Financial performance analysis of Mineral resource Ltd
3
Introduction
In this report, financial performance analysis of Mineral resource Ltd has been taken
into consideration. There are several financial analysis tools such as ratio analysis, bottom up
analysis, capital budgeting tool and share price movement analysis. It is observed these tools
help investors to evaluate the financial performance of particular company in which they are
going to invest their capital.
1. Present description of the company
Mineral resources plc is an Australian listed company having extensive business of
selling mineral service, contracting, processing and commodities production factors around
the globe.
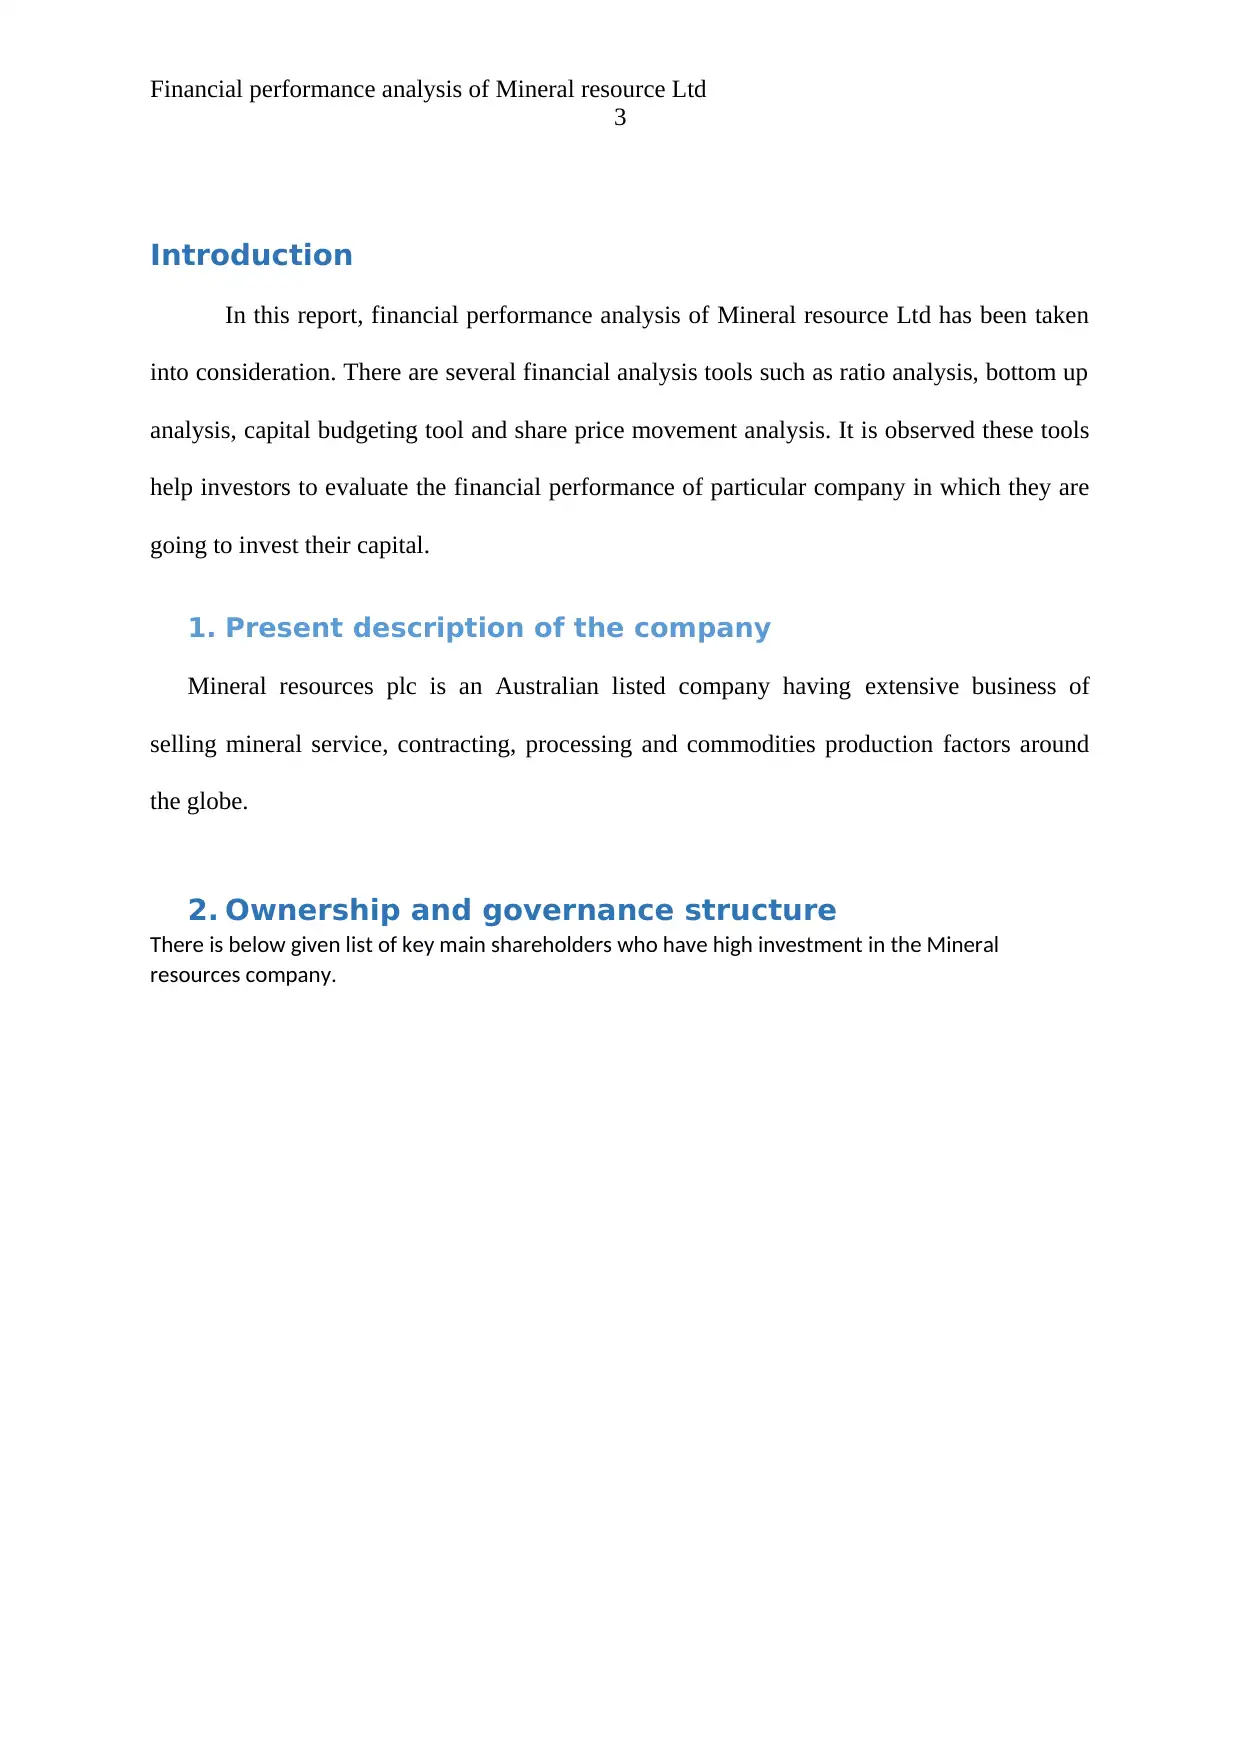
2. Ownership and governance structure
There is below given list of key main shareholders who have high investment in the Mineral
resources company.
3
Introduction
In this report, financial performance analysis of Mineral resource Ltd has been taken
into consideration. There are several financial analysis tools such as ratio analysis, bottom up
analysis, capital budgeting tool and share price movement analysis. It is observed these tools
help investors to evaluate the financial performance of particular company in which they are
going to invest their capital.
1. Present description of the company
Mineral resources plc is an Australian listed company having extensive business of
selling mineral service, contracting, processing and commodities production factors around
the globe.
2. Ownership and governance structure
There is below given list of key main shareholders who have high investment in the Mineral
resources company.
⊘ This is a preview!⊘
Do you want full access?
Subscribe today to unlock all pages.
Trusted by 1+ million students worldwide
Financial performance analysis of Mineral resource Ltd
4
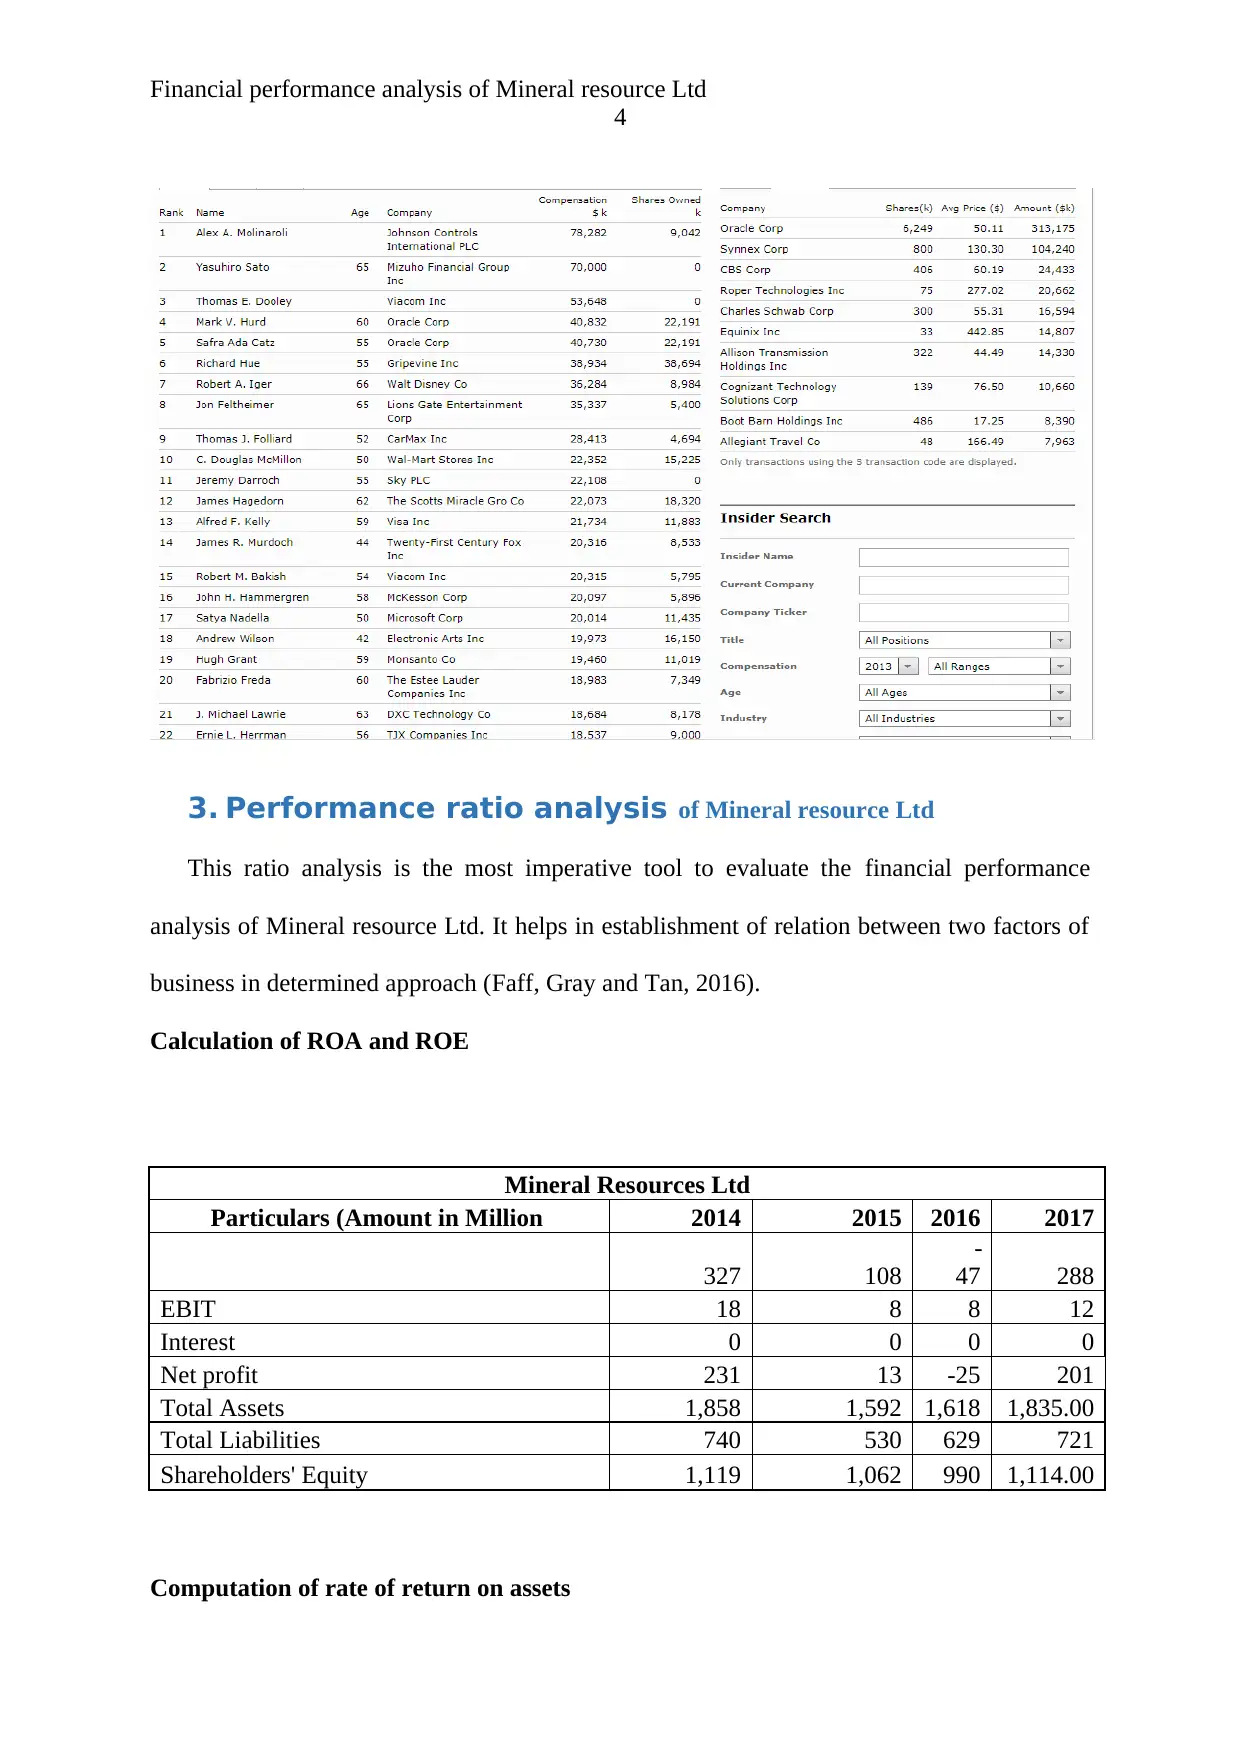
3. Performance ratio analysis of Mineral resource Ltd
This ratio analysis is the most imperative tool to evaluate the financial performance
analysis of Mineral resource Ltd. It helps in establishment of relation between two factors of
business in determined approach (Faff, Gray and Tan, 2016).
Calculation of ROA and ROE
Mineral Resources Ltd
Particulars (Amount in Million 2014 2015 2016 2017
327 108
-
47 288
EBIT 18 8 8 12
Interest 0 0 0 0
Net profit 231 13 -25 201
Total Assets 1,858 1,592 1,618 1,835.00
Total Liabilities 740 530 629 721
Shareholders' Equity 1,119 1,062 990 1,114.00
Computation of rate of return on assets
4
3. Performance ratio analysis of Mineral resource Ltd
This ratio analysis is the most imperative tool to evaluate the financial performance
analysis of Mineral resource Ltd. It helps in establishment of relation between two factors of
business in determined approach (Faff, Gray and Tan, 2016).
Calculation of ROA and ROE
Mineral Resources Ltd
Particulars (Amount in Million 2014 2015 2016 2017
327 108
-
47 288
EBIT 18 8 8 12
Interest 0 0 0 0
Net profit 231 13 -25 201
Total Assets 1,858 1,592 1,618 1,835.00
Total Liabilities 740 530 629 721
Shareholders' Equity 1,119 1,062 990 1,114.00
Computation of rate of return on assets
Paraphrase This Document
Need a fresh take? Get an instant paraphrase of this document with our AI Paraphraser
Financial performance analysis of Mineral resource Ltd
5
1. Rate of Return on Assets
2014 2015 2016 2017
A. Net income 231 13 -25 201
B. Total assets 1,858 1,592 1,618 1,835
(A/B) 12.43% 1% -2% 11%
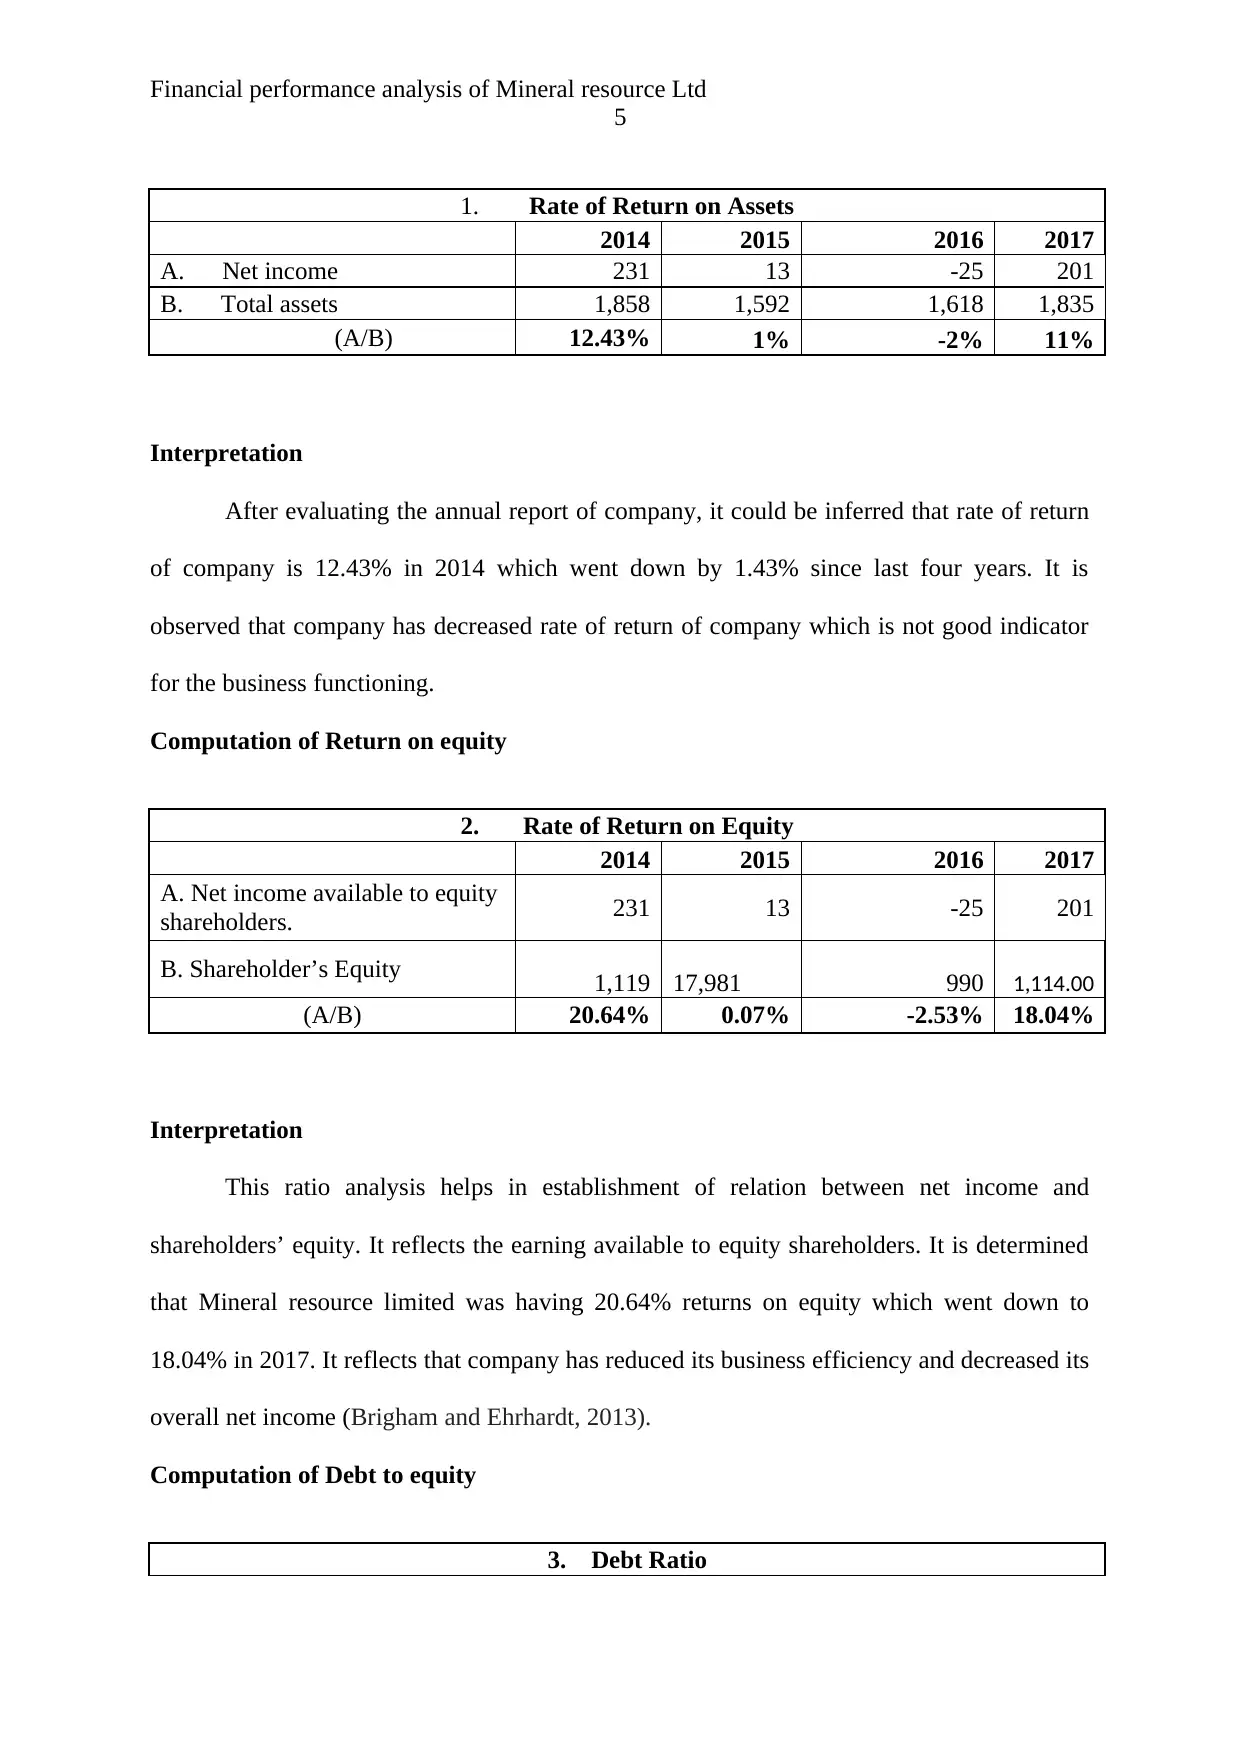
Interpretation
After evaluating the annual report of company, it could be inferred that rate of return
of company is 12.43% in 2014 which went down by 1.43% since last four years. It is
observed that company has decreased rate of return of company which is not good indicator
for the business functioning.
Computation of Return on equity
2. Rate of Return on Equity
2014 2015 2016 2017
A. Net income available to equity
shareholders. 231 13 -25 201
B. Shareholder’s Equity 1,119 17,981 990 1,114.00
(A/B) 20.64% 0.07% -2.53% 18.04%
Interpretation
This ratio analysis helps in establishment of relation between net income and
shareholders’ equity. It reflects the earning available to equity shareholders. It is determined
that Mineral resource limited was having 20.64% returns on equity which went down to
18.04% in 2017. It reflects that company has reduced its business efficiency and decreased its
overall net income (Brigham and Ehrhardt, 2013).
Computation of Debt to equity
3. Debt Ratio
5
1. Rate of Return on Assets
2014 2015 2016 2017
A. Net income 231 13 -25 201
B. Total assets 1,858 1,592 1,618 1,835
(A/B) 12.43% 1% -2% 11%
Interpretation
After evaluating the annual report of company, it could be inferred that rate of return
of company is 12.43% in 2014 which went down by 1.43% since last four years. It is
observed that company has decreased rate of return of company which is not good indicator
for the business functioning.
Computation of Return on equity
2. Rate of Return on Equity
2014 2015 2016 2017
A. Net income available to equity
shareholders. 231 13 -25 201
B. Shareholder’s Equity 1,119 17,981 990 1,114.00
(A/B) 20.64% 0.07% -2.53% 18.04%
Interpretation
This ratio analysis helps in establishment of relation between net income and
shareholders’ equity. It reflects the earning available to equity shareholders. It is determined
that Mineral resource limited was having 20.64% returns on equity which went down to
18.04% in 2017. It reflects that company has reduced its business efficiency and decreased its
overall net income (Brigham and Ehrhardt, 2013).
Computation of Debt to equity
3. Debt Ratio
Financial performance analysis of Mineral resource Ltd
6
2014 2015 2016 2017
A. Total Liabilities 740 530 629 721
B. Total assets 1,858 1,592 1,618 1,835.00
(A/B) 40% 33% 39% 39%
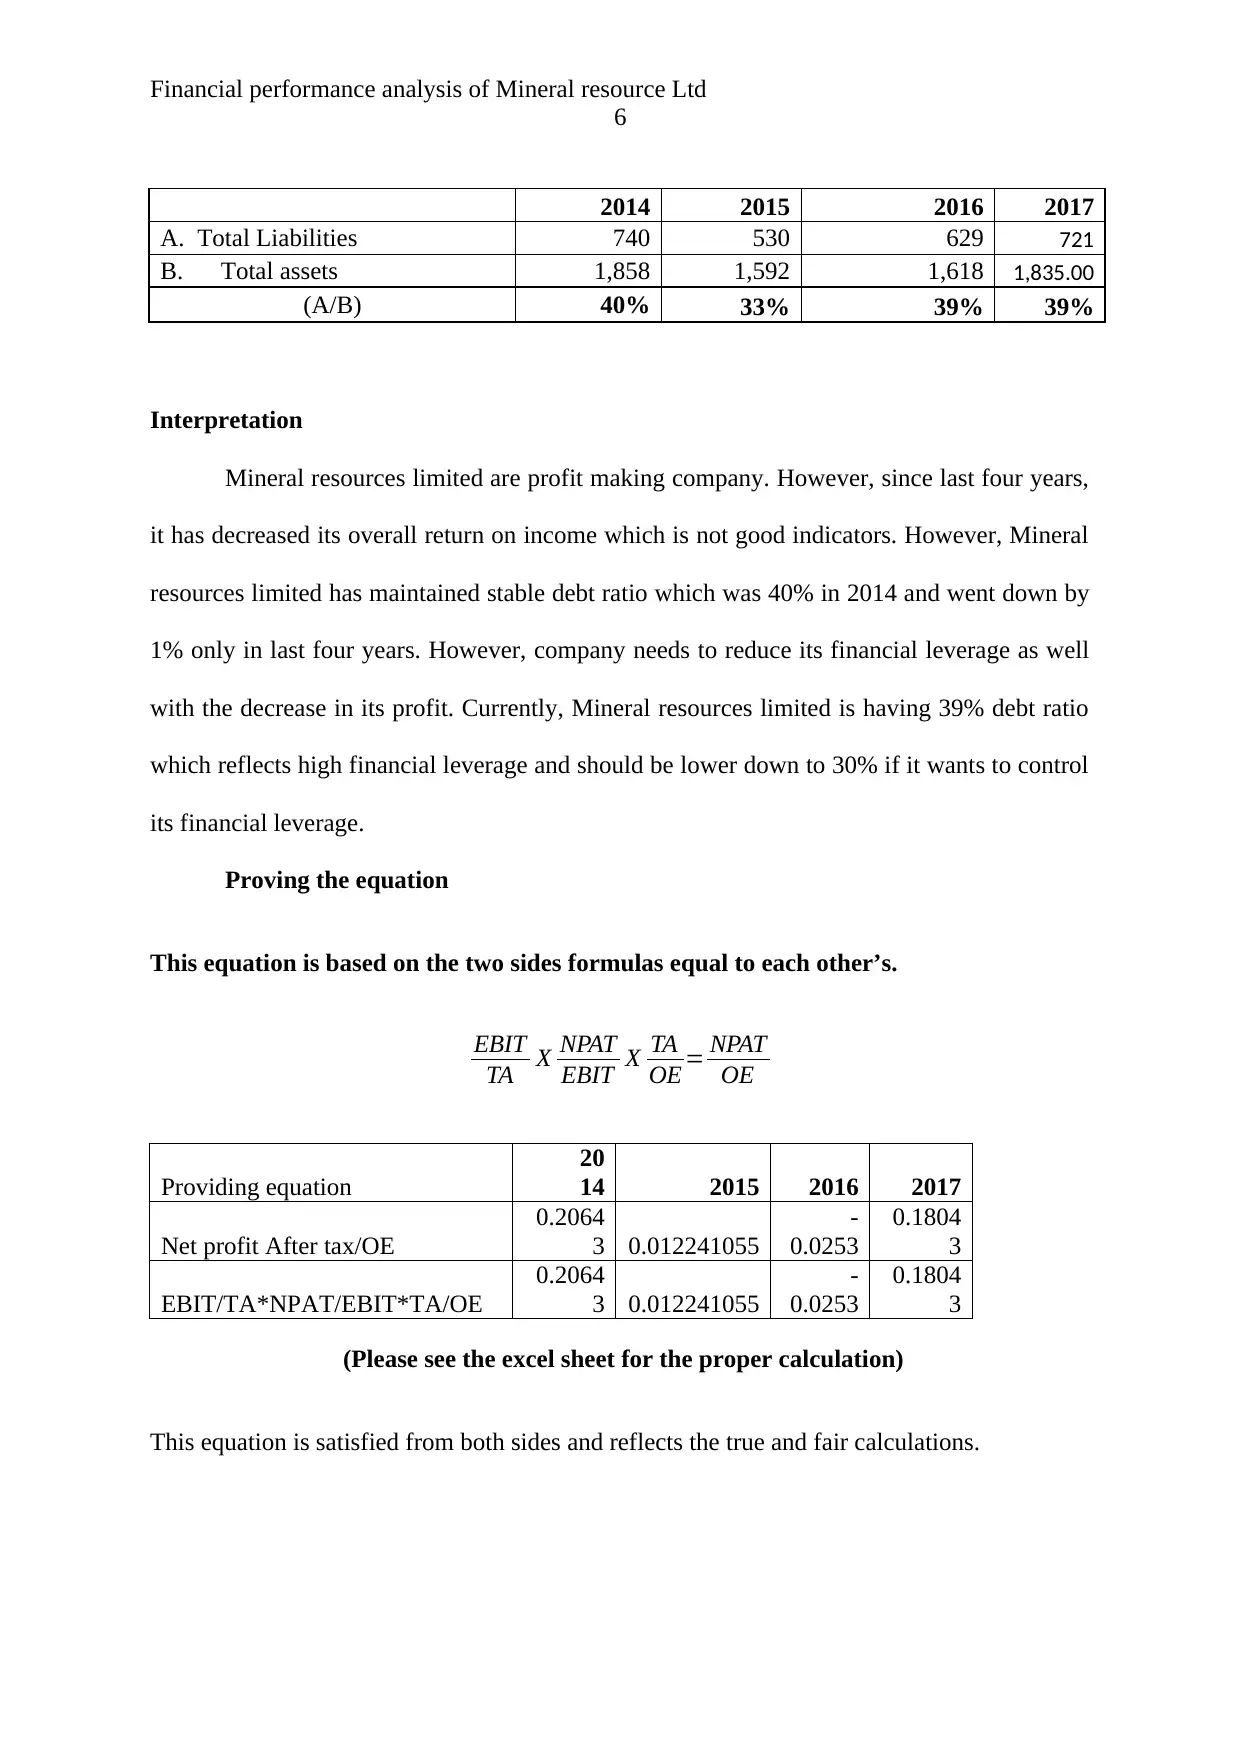
Interpretation
Mineral resources limited are profit making company. However, since last four years,
it has decreased its overall return on income which is not good indicators. However, Mineral
resources limited has maintained stable debt ratio which was 40% in 2014 and went down by
1% only in last four years. However, company needs to reduce its financial leverage as well
with the decrease in its profit. Currently, Mineral resources limited is having 39% debt ratio
which reflects high financial leverage and should be lower down to 30% if it wants to control
its financial leverage.
Proving the equation
This equation is based on the two sides formulas equal to each other’s.
EBIT
TA X NPAT
EBIT X TA
OE = NPAT
OE
Providing equation
20
14 2015 2016 2017
Net profit After tax/OE
0.2064
3 0.012241055
-
0.0253
0.1804
3
EBIT/TA*NPAT/EBIT*TA/OE
0.2064
3 0.012241055
-
0.0253
0.1804
3
(Please see the excel sheet for the proper calculation)
This equation is satisfied from both sides and reflects the true and fair calculations.
6
2014 2015 2016 2017
A. Total Liabilities 740 530 629 721
B. Total assets 1,858 1,592 1,618 1,835.00
(A/B) 40% 33% 39% 39%
Interpretation
Mineral resources limited are profit making company. However, since last four years,
it has decreased its overall return on income which is not good indicators. However, Mineral
resources limited has maintained stable debt ratio which was 40% in 2014 and went down by
1% only in last four years. However, company needs to reduce its financial leverage as well
with the decrease in its profit. Currently, Mineral resources limited is having 39% debt ratio
which reflects high financial leverage and should be lower down to 30% if it wants to control
its financial leverage.
Proving the equation
This equation is based on the two sides formulas equal to each other’s.
EBIT
TA X NPAT
EBIT X TA
OE = NPAT
OE
Providing equation
20
14 2015 2016 2017
Net profit After tax/OE
0.2064
3 0.012241055
-
0.0253
0.1804
3
EBIT/TA*NPAT/EBIT*TA/OE
0.2064
3 0.012241055
-
0.0253
0.1804
3
(Please see the excel sheet for the proper calculation)
This equation is satisfied from both sides and reflects the true and fair calculations.
⊘ This is a preview!⊘
Do you want full access?
Subscribe today to unlock all pages.
Trusted by 1+ million students worldwide
Financial performance analysis of Mineral resource Ltd
7
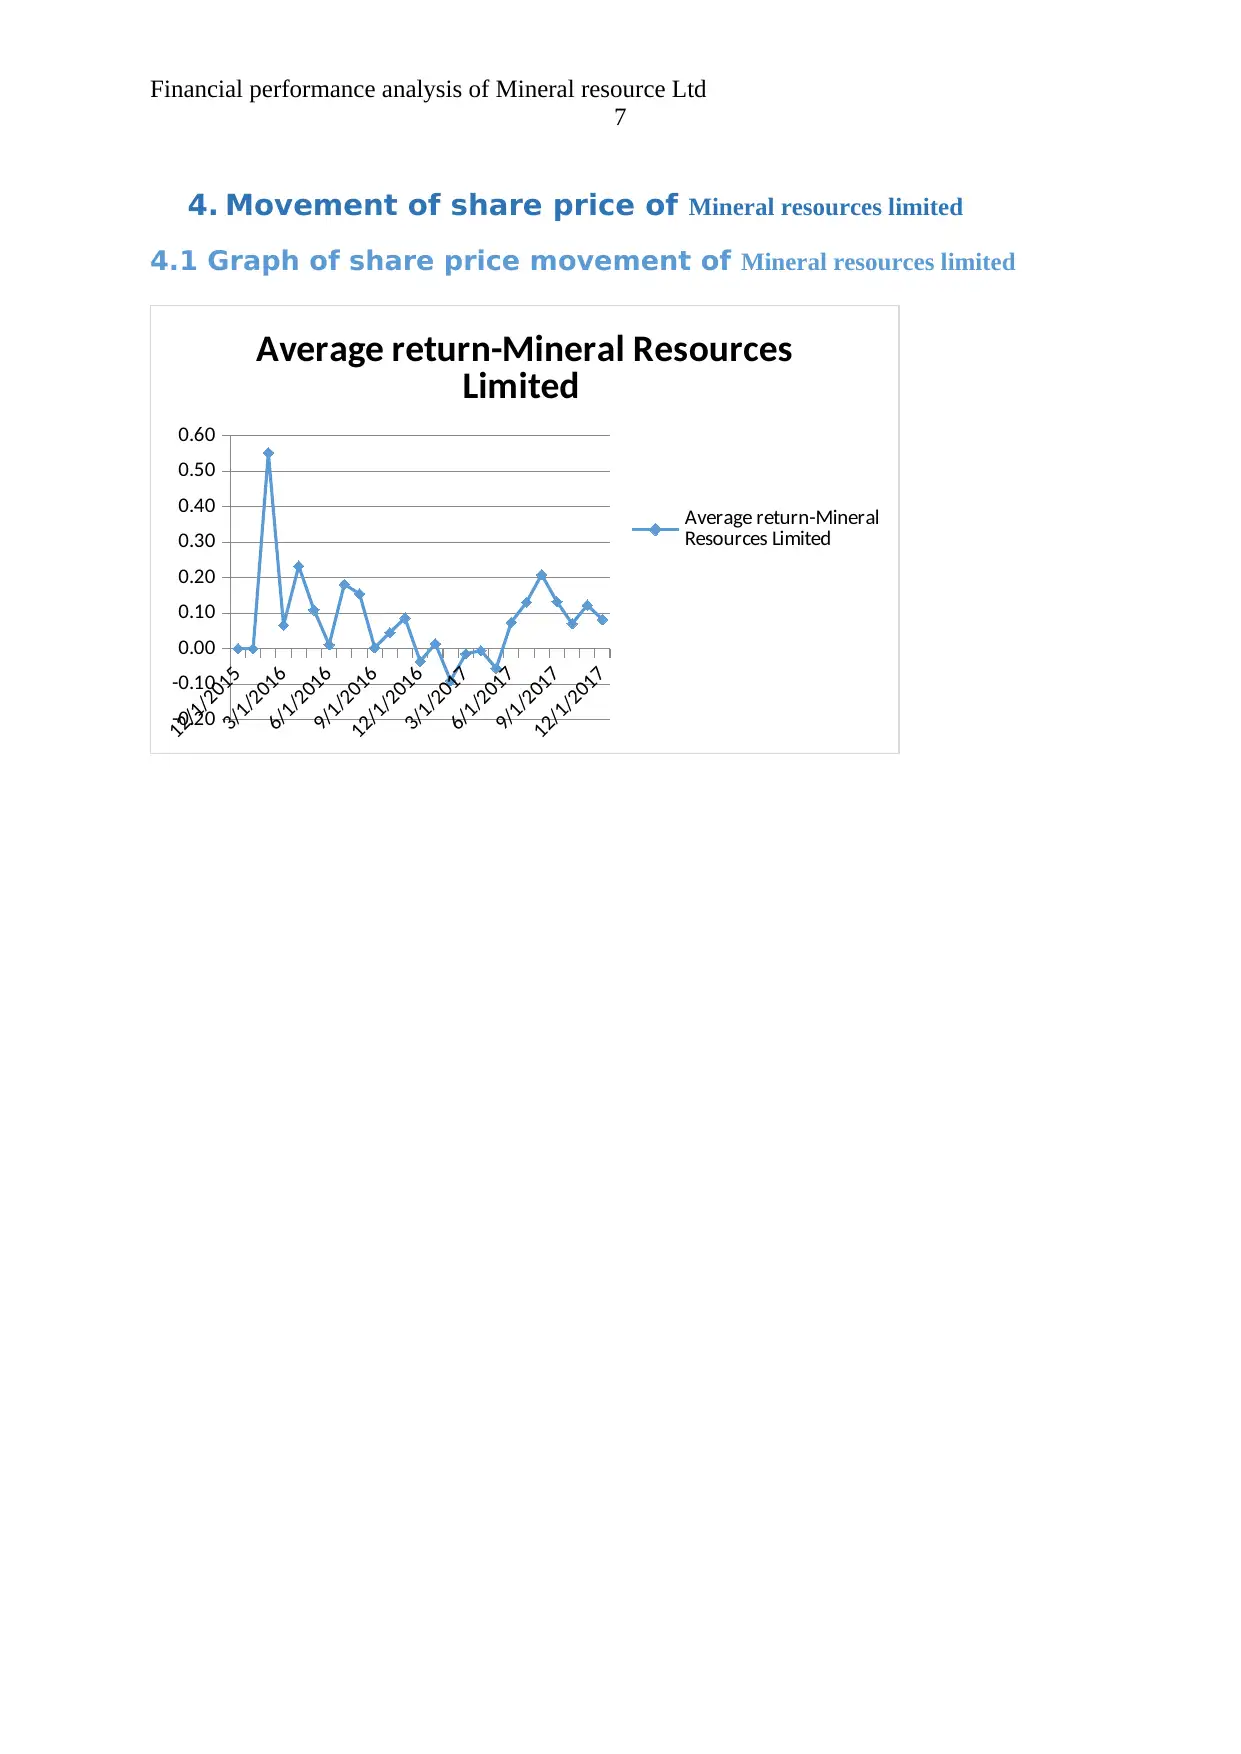
4. Movement of share price of Mineral resources limited
4.1 Graph of share price movement of Mineral resources limited
12/1/2015
3/1/2016
6/1/2016
9/1/2016
12/1/2016
3/1/2017
6/1/2017
9/1/2017
12/1/2017
-0.20
-0.10
0.00
0.10
0.20
0.30
0.40
0.50
0.60
Average return-Mineral Resources
Limited
Average return-Mineral
Resources Limited
7
4. Movement of share price of Mineral resources limited
4.1 Graph of share price movement of Mineral resources limited
12/1/2015
3/1/2016
6/1/2016
9/1/2016
12/1/2016
3/1/2017
6/1/2017
9/1/2017
12/1/2017
-0.20
-0.10
0.00
0.10
0.20
0.30
0.40
0.50
0.60
Average return-Mineral Resources
Limited
Average return-Mineral
Resources Limited
Paraphrase This Document
Need a fresh take? Get an instant paraphrase of this document with our AI Paraphraser
Financial performance analysis of Mineral resource Ltd
8
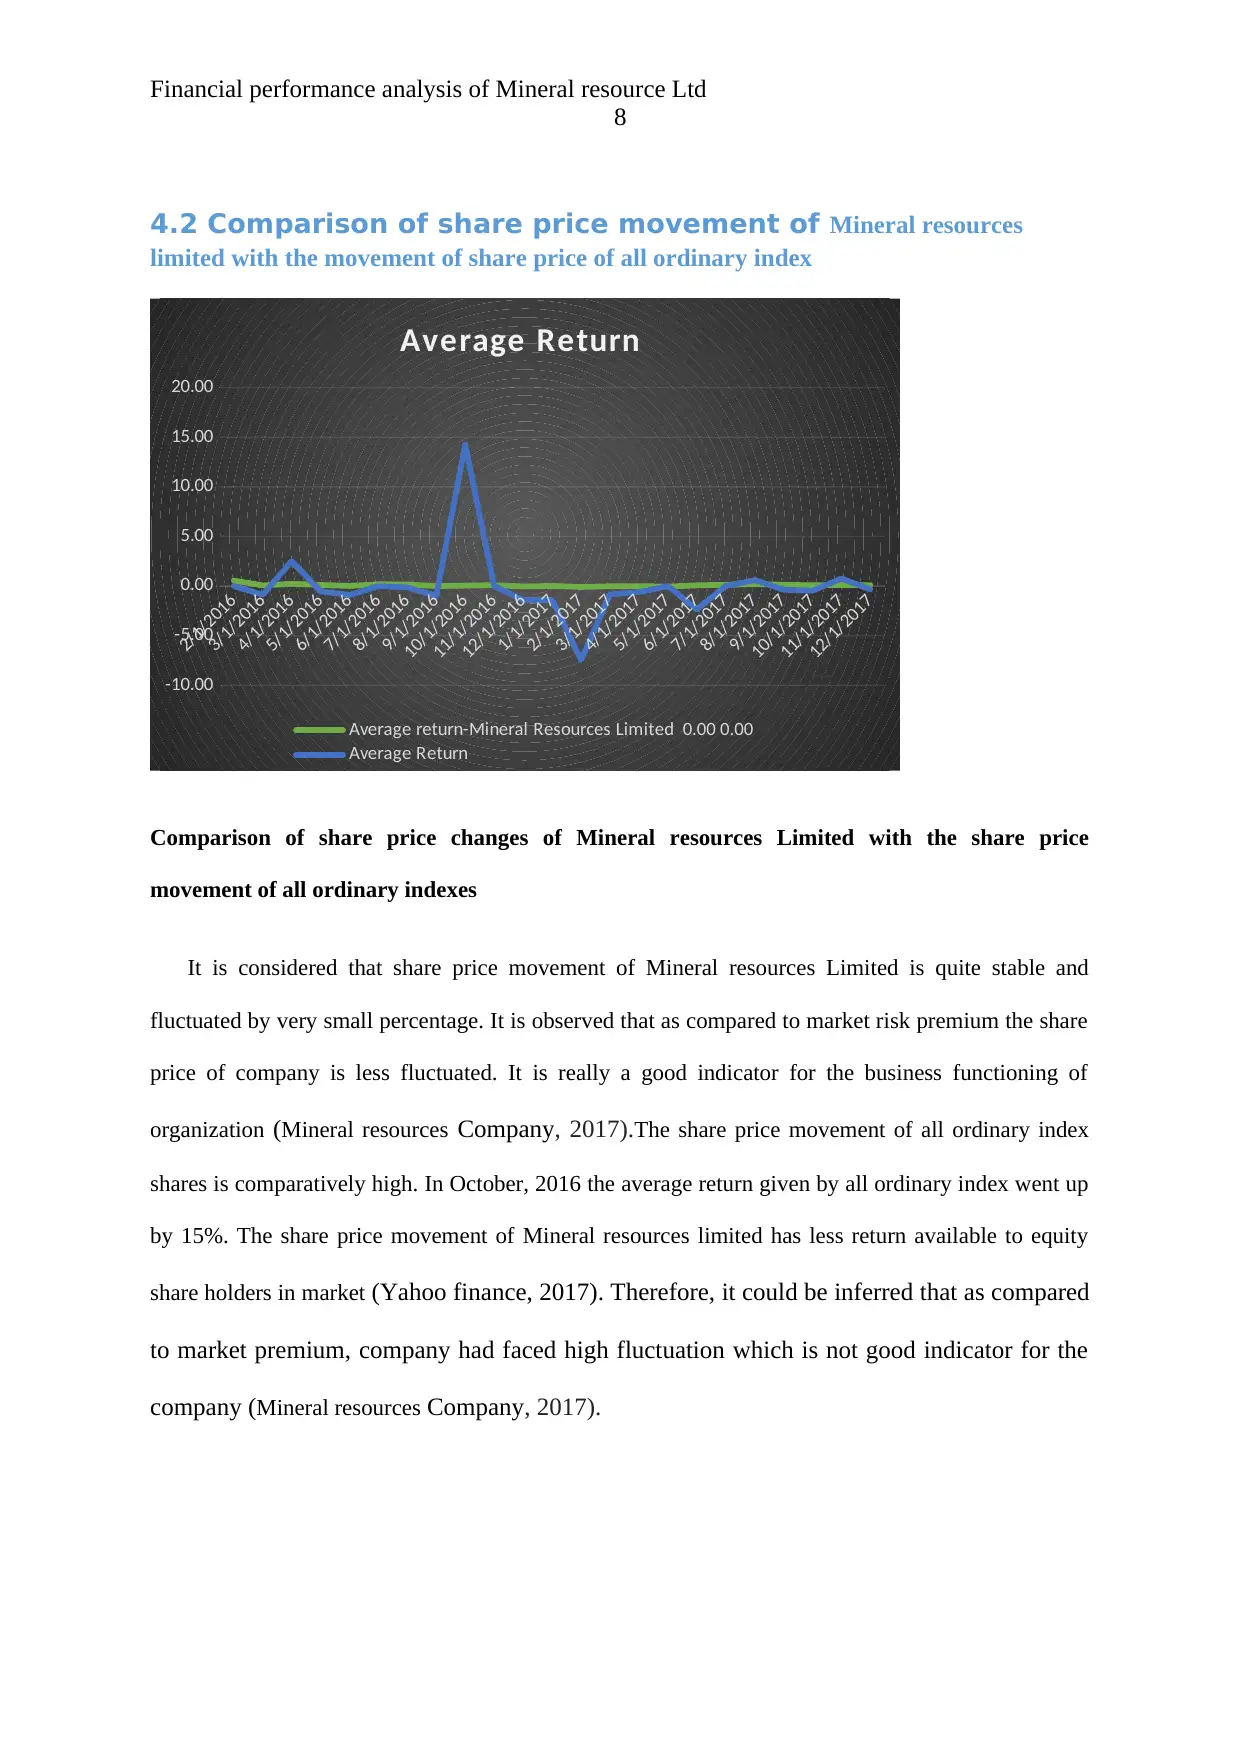
4.2 Comparison of share price movement of Mineral resources
limited with the movement of share price of all ordinary index
2/1/2016
3/1/2016
4/1/2016
5/1/2016
6/1/2016
7/1/2016
8/1/2016
9/1/2016
10/1/2016
11/1/2016
12/1/2016
1/1/2017
2/1/2017
3/1/2017
4/1/2017
5/1/2017
6/1/2017
7/1/2017
8/1/2017
9/1/2017
10/1/2017
11/1/2017
12/1/2017
-10.00
-5.00
0.00
5.00
10.00
15.00
20.00
Average Return
Average return-Mineral Resources Limited 0.00 0.00
Average Return
Comparison of share price changes of Mineral resources Limited with the share price
movement of all ordinary indexes
It is considered that share price movement of Mineral resources Limited is quite stable and
fluctuated by very small percentage. It is observed that as compared to market risk premium the share
price of company is less fluctuated. It is really a good indicator for the business functioning of
organization (Mineral resources Company, 2017).The share price movement of all ordinary index
shares is comparatively high. In October, 2016 the average return given by all ordinary index went up
by 15%. The share price movement of Mineral resources limited has less return available to equity
share holders in market (Yahoo finance, 2017). Therefore, it could be inferred that as compared
to market premium, company had faced high fluctuation which is not good indicator for the
company (Mineral resources Company, 2017).
8
4.2 Comparison of share price movement of Mineral resources
limited with the movement of share price of all ordinary index
2/1/2016
3/1/2016
4/1/2016
5/1/2016
6/1/2016
7/1/2016
8/1/2016
9/1/2016
10/1/2016
11/1/2016
12/1/2016
1/1/2017
2/1/2017
3/1/2017
4/1/2017
5/1/2017
6/1/2017
7/1/2017
8/1/2017
9/1/2017
10/1/2017
11/1/2017
12/1/2017
-10.00
-5.00
0.00
5.00
10.00
15.00
20.00
Average Return
Average return-Mineral Resources Limited 0.00 0.00
Average Return
Comparison of share price changes of Mineral resources Limited with the share price
movement of all ordinary indexes
It is considered that share price movement of Mineral resources Limited is quite stable and
fluctuated by very small percentage. It is observed that as compared to market risk premium the share
price of company is less fluctuated. It is really a good indicator for the business functioning of
organization (Mineral resources Company, 2017).The share price movement of all ordinary index
shares is comparatively high. In October, 2016 the average return given by all ordinary index went up
by 15%. The share price movement of Mineral resources limited has less return available to equity
share holders in market (Yahoo finance, 2017). Therefore, it could be inferred that as compared
to market premium, company had faced high fluctuation which is not good indicator for the
company (Mineral resources Company, 2017).
Financial performance analysis of Mineral resource Ltd
9
5. Announcements
1. In 2017, company has less fluctuation in its share price movement and invested high amount
in the other business to diversify its business chain.
2. Company has planned to establish automation in its business by using cyber computing
enterprises resources planning in its value chain activities (Mineral resources Company, 2017).
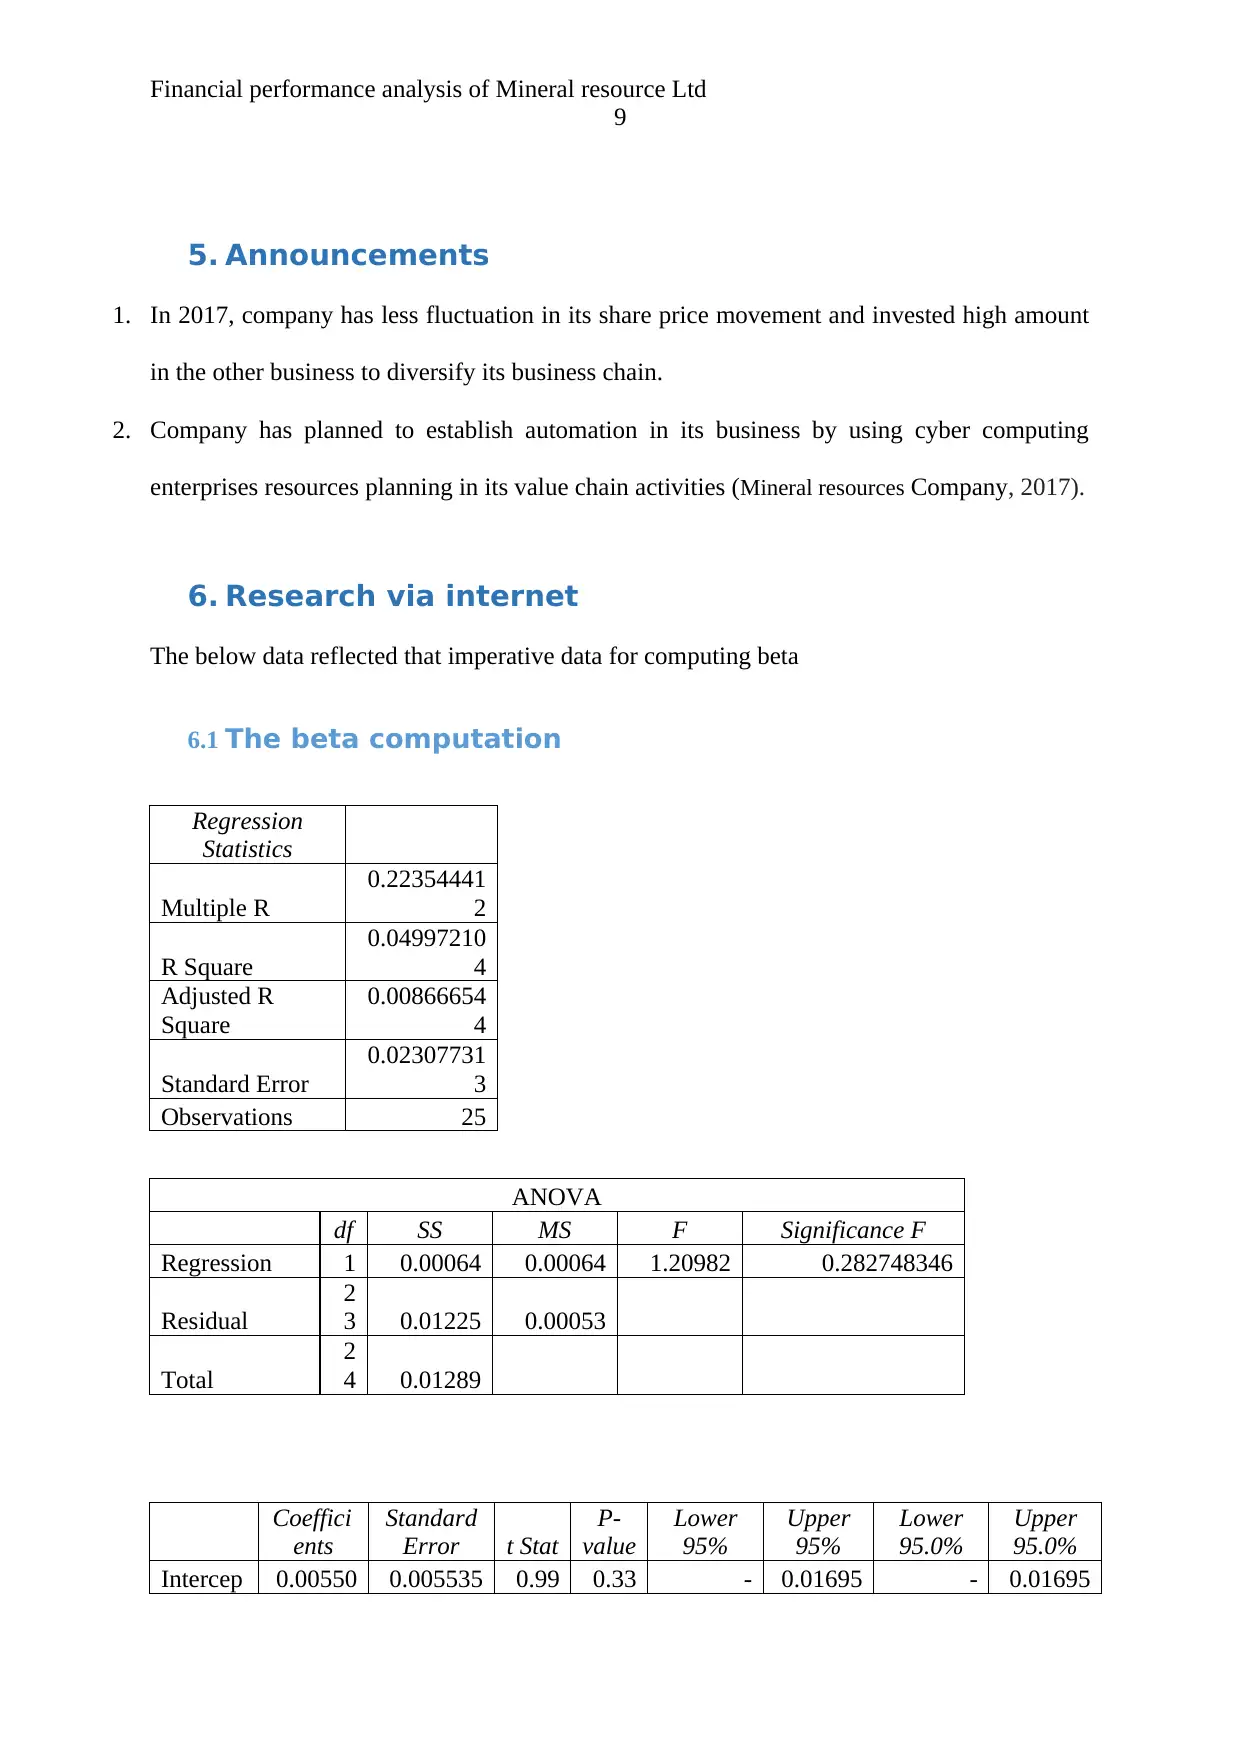
6. Research via internet
The below data reflected that imperative data for computing beta
6.1 The beta computation
Regression
Statistics
Multiple R
0.22354441
2
R Square
0.04997210
4
Adjusted R
Square
0.00866654
4
Standard Error
0.02307731
3
Observations 25
ANOVA
df SS MS F Significance F
Regression 1 0.00064 0.00064 1.20982 0.282748346
Residual
2
3 0.01225 0.00053
Total
2
4 0.01289
Coeffici
ents
Standard
Error t Stat
P-
value
Lower
95%
Upper
95%
Lower
95.0%
Upper
95.0%
Intercep 0.00550 0.005535 0.99 0.33 - 0.01695 - 0.01695
9
5. Announcements
1. In 2017, company has less fluctuation in its share price movement and invested high amount
in the other business to diversify its business chain.
2. Company has planned to establish automation in its business by using cyber computing
enterprises resources planning in its value chain activities (Mineral resources Company, 2017).
6. Research via internet
The below data reflected that imperative data for computing beta
6.1 The beta computation
Regression
Statistics
Multiple R
0.22354441
2
R Square
0.04997210
4
Adjusted R
Square
0.00866654
4
Standard Error
0.02307731
3
Observations 25
ANOVA
df SS MS F Significance F
Regression 1 0.00064 0.00064 1.20982 0.282748346
Residual
2
3 0.01225 0.00053
Total
2
4 0.01289
Coeffici
ents
Standard
Error t Stat
P-
value
Lower
95%
Upper
95%
Lower
95.0%
Upper
95.0%
Intercep 0.00550 0.005535 0.99 0.33 - 0.01695 - 0.01695
⊘ This is a preview!⊘
Do you want full access?
Subscribe today to unlock all pages.
Trusted by 1+ million students worldwide
Financial performance analysis of Mineral resource Ltd
10
t 1315 738 378 067
0.00595
0233 2862
0.00595
0233 2862
X
Variabl
e 1
0.04046
8037
0.036791
931
1.09
992
0.28
275
-
0.03564
1871
0.11657
7944
-
0.03564
1871
0.11657
7944
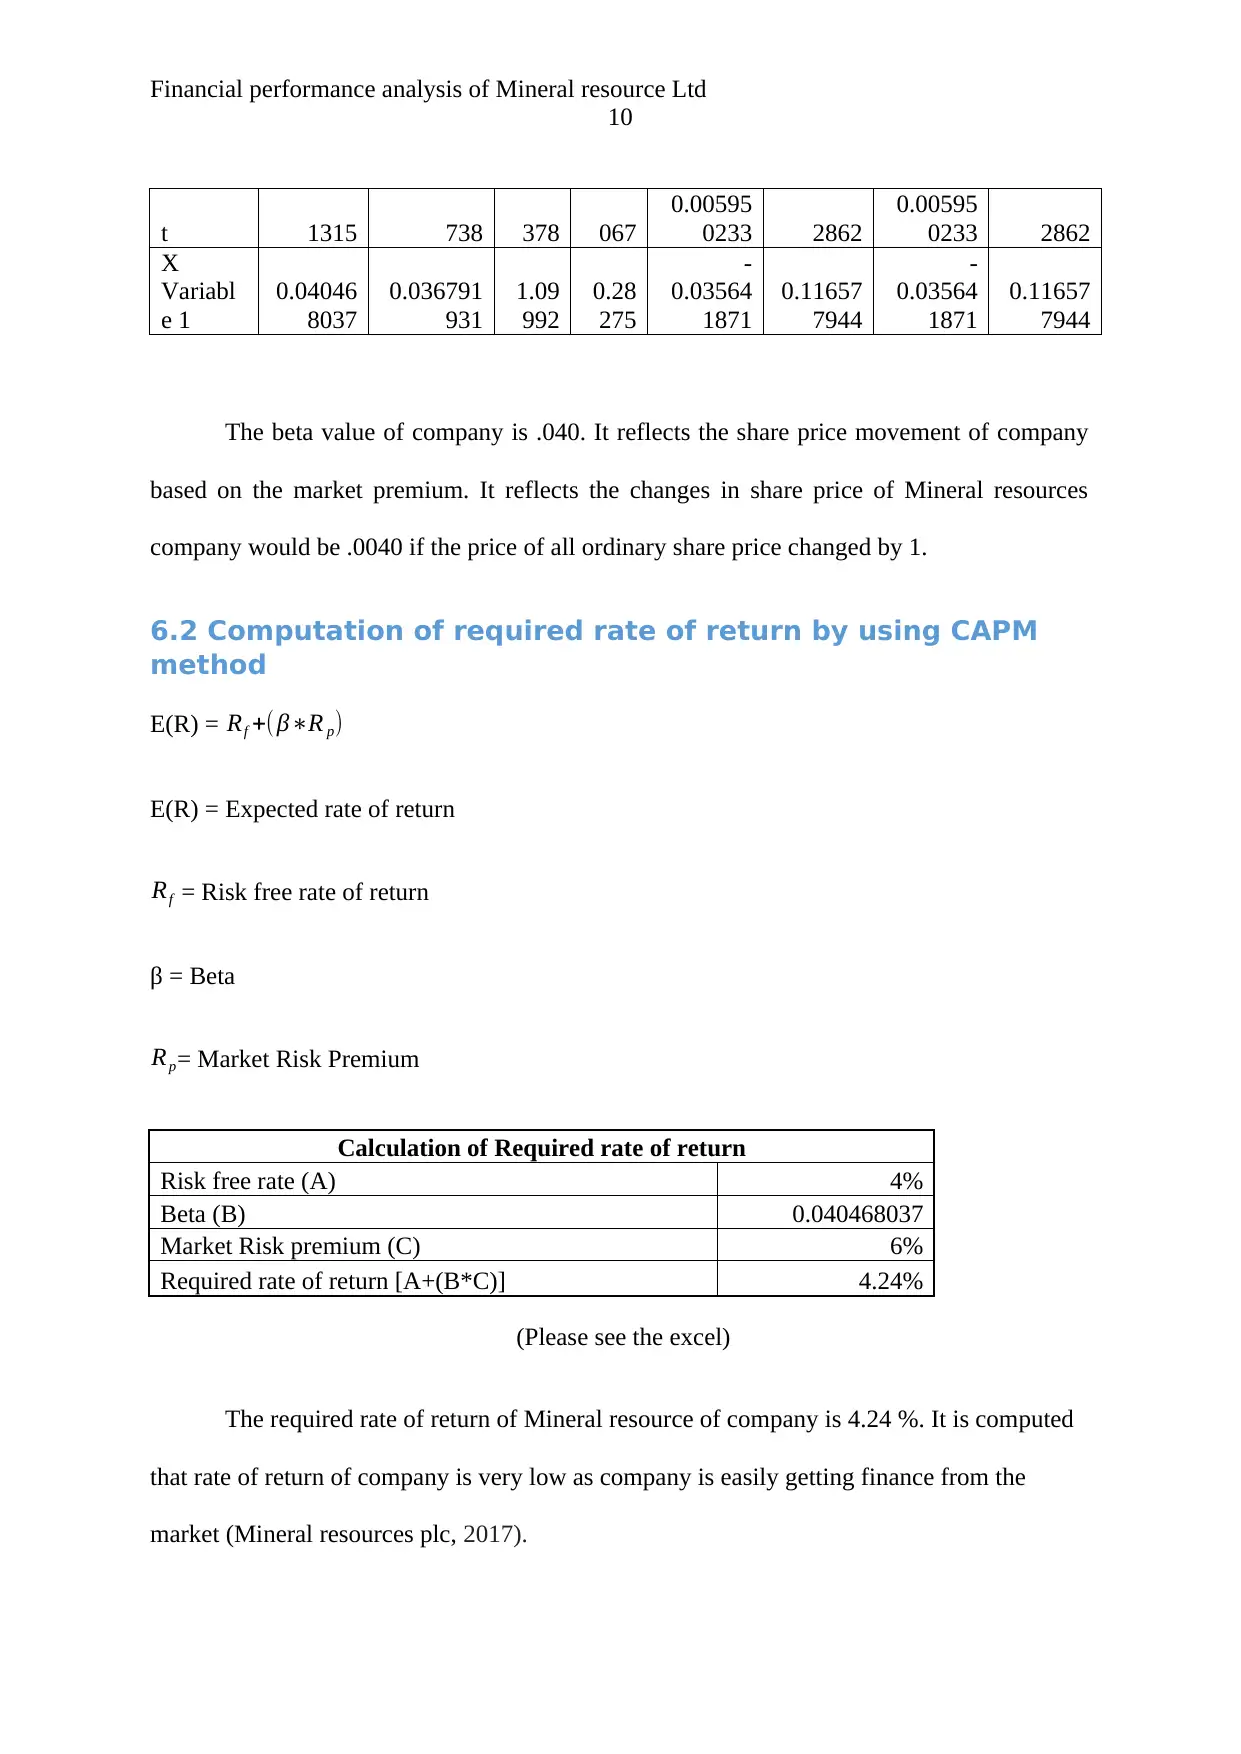
The beta value of company is .040. It reflects the share price movement of company
based on the market premium. It reflects the changes in share price of Mineral resources
company would be .0040 if the price of all ordinary share price changed by 1.
6.2 Computation of required rate of return by using CAPM
method
E(R) = Rf +( β∗R p)
E(R) = Expected rate of return
Rf = Risk free rate of return
β = Beta
Rp= Market Risk Premium
Calculation of Required rate of return
Risk free rate (A) 4%
Beta (B) 0.040468037
Market Risk premium (C) 6%
Required rate of return [A+(B*C)] 4.24%
(Please see the excel)
The required rate of return of Mineral resource of company is 4.24 %. It is computed
that rate of return of company is very low as company is easily getting finance from the
market (Mineral resources plc, 2017).
10
t 1315 738 378 067
0.00595
0233 2862
0.00595
0233 2862
X
Variabl
e 1
0.04046
8037
0.036791
931
1.09
992
0.28
275
-
0.03564
1871
0.11657
7944
-
0.03564
1871
0.11657
7944
The beta value of company is .040. It reflects the share price movement of company
based on the market premium. It reflects the changes in share price of Mineral resources
company would be .0040 if the price of all ordinary share price changed by 1.
6.2 Computation of required rate of return by using CAPM
method
E(R) = Rf +( β∗R p)
E(R) = Expected rate of return
Rf = Risk free rate of return
β = Beta
Rp= Market Risk Premium
Calculation of Required rate of return
Risk free rate (A) 4%
Beta (B) 0.040468037
Market Risk premium (C) 6%
Required rate of return [A+(B*C)] 4.24%
(Please see the excel)
The required rate of return of Mineral resource of company is 4.24 %. It is computed
that rate of return of company is very low as company is easily getting finance from the
market (Mineral resources plc, 2017).
Paraphrase This Document
Need a fresh take? Get an instant paraphrase of this document with our AI Paraphraser
Financial performance analysis of Mineral resource Ltd
11
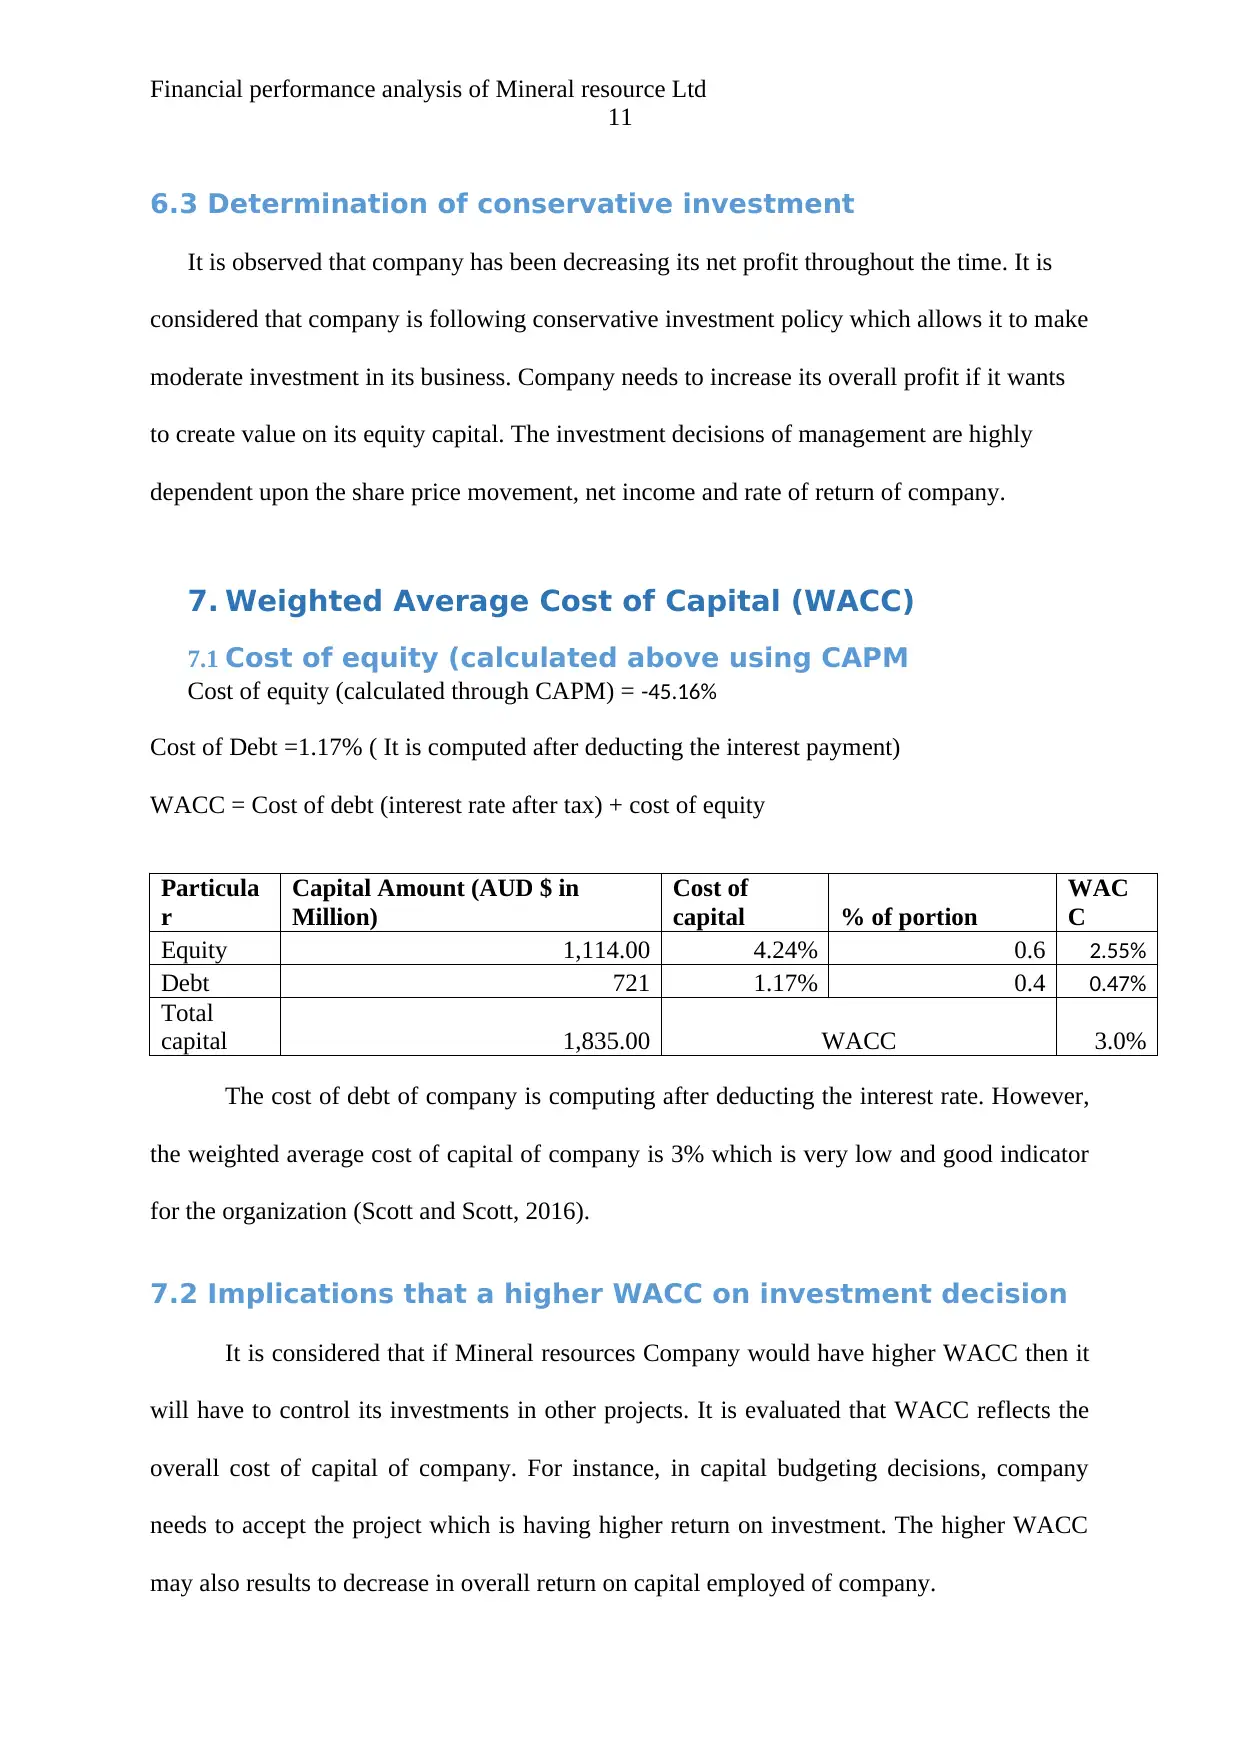
6.3 Determination of conservative investment
It is observed that company has been decreasing its net profit throughout the time. It is
considered that company is following conservative investment policy which allows it to make
moderate investment in its business. Company needs to increase its overall profit if it wants
to create value on its equity capital. The investment decisions of management are highly
dependent upon the share price movement, net income and rate of return of company.
7. Weighted Average Cost of Capital (WACC)
7.1 Cost of equity (calculated above using CAPM
Cost of equity (calculated through CAPM) = -45.16%
Cost of Debt =1.17% ( It is computed after deducting the interest payment)
WACC = Cost of debt (interest rate after tax) + cost of equity
Particula
r
Capital Amount (AUD $ in
Million)
Cost of
capital % of portion
WAC
C
Equity 1,114.00 4.24% 0.6 2.55%
Debt 721 1.17% 0.4 0.47%
Total
capital 1,835.00 WACC 3.0%
The cost of debt of company is computing after deducting the interest rate. However,
the weighted average cost of capital of company is 3% which is very low and good indicator
for the organization (Scott and Scott, 2016).
7.2 Implications that a higher WACC on investment decision
It is considered that if Mineral resources Company would have higher WACC then it
will have to control its investments in other projects. It is evaluated that WACC reflects the
overall cost of capital of company. For instance, in capital budgeting decisions, company
needs to accept the project which is having higher return on investment. The higher WACC
may also results to decrease in overall return on capital employed of company.
11
6.3 Determination of conservative investment
It is observed that company has been decreasing its net profit throughout the time. It is
considered that company is following conservative investment policy which allows it to make
moderate investment in its business. Company needs to increase its overall profit if it wants
to create value on its equity capital. The investment decisions of management are highly
dependent upon the share price movement, net income and rate of return of company.
7. Weighted Average Cost of Capital (WACC)
7.1 Cost of equity (calculated above using CAPM
Cost of equity (calculated through CAPM) = -45.16%
Cost of Debt =1.17% ( It is computed after deducting the interest payment)
WACC = Cost of debt (interest rate after tax) + cost of equity
Particula
r
Capital Amount (AUD $ in
Million)
Cost of
capital % of portion
WAC
C
Equity 1,114.00 4.24% 0.6 2.55%
Debt 721 1.17% 0.4 0.47%
Total
capital 1,835.00 WACC 3.0%
The cost of debt of company is computing after deducting the interest rate. However,
the weighted average cost of capital of company is 3% which is very low and good indicator
for the organization (Scott and Scott, 2016).
7.2 Implications that a higher WACC on investment decision
It is considered that if Mineral resources Company would have higher WACC then it
will have to control its investments in other projects. It is evaluated that WACC reflects the
overall cost of capital of company. For instance, in capital budgeting decisions, company
needs to accept the project which is having higher return on investment. The higher WACC
may also results to decrease in overall return on capital employed of company.
Financial performance analysis of Mineral resource Ltd
12
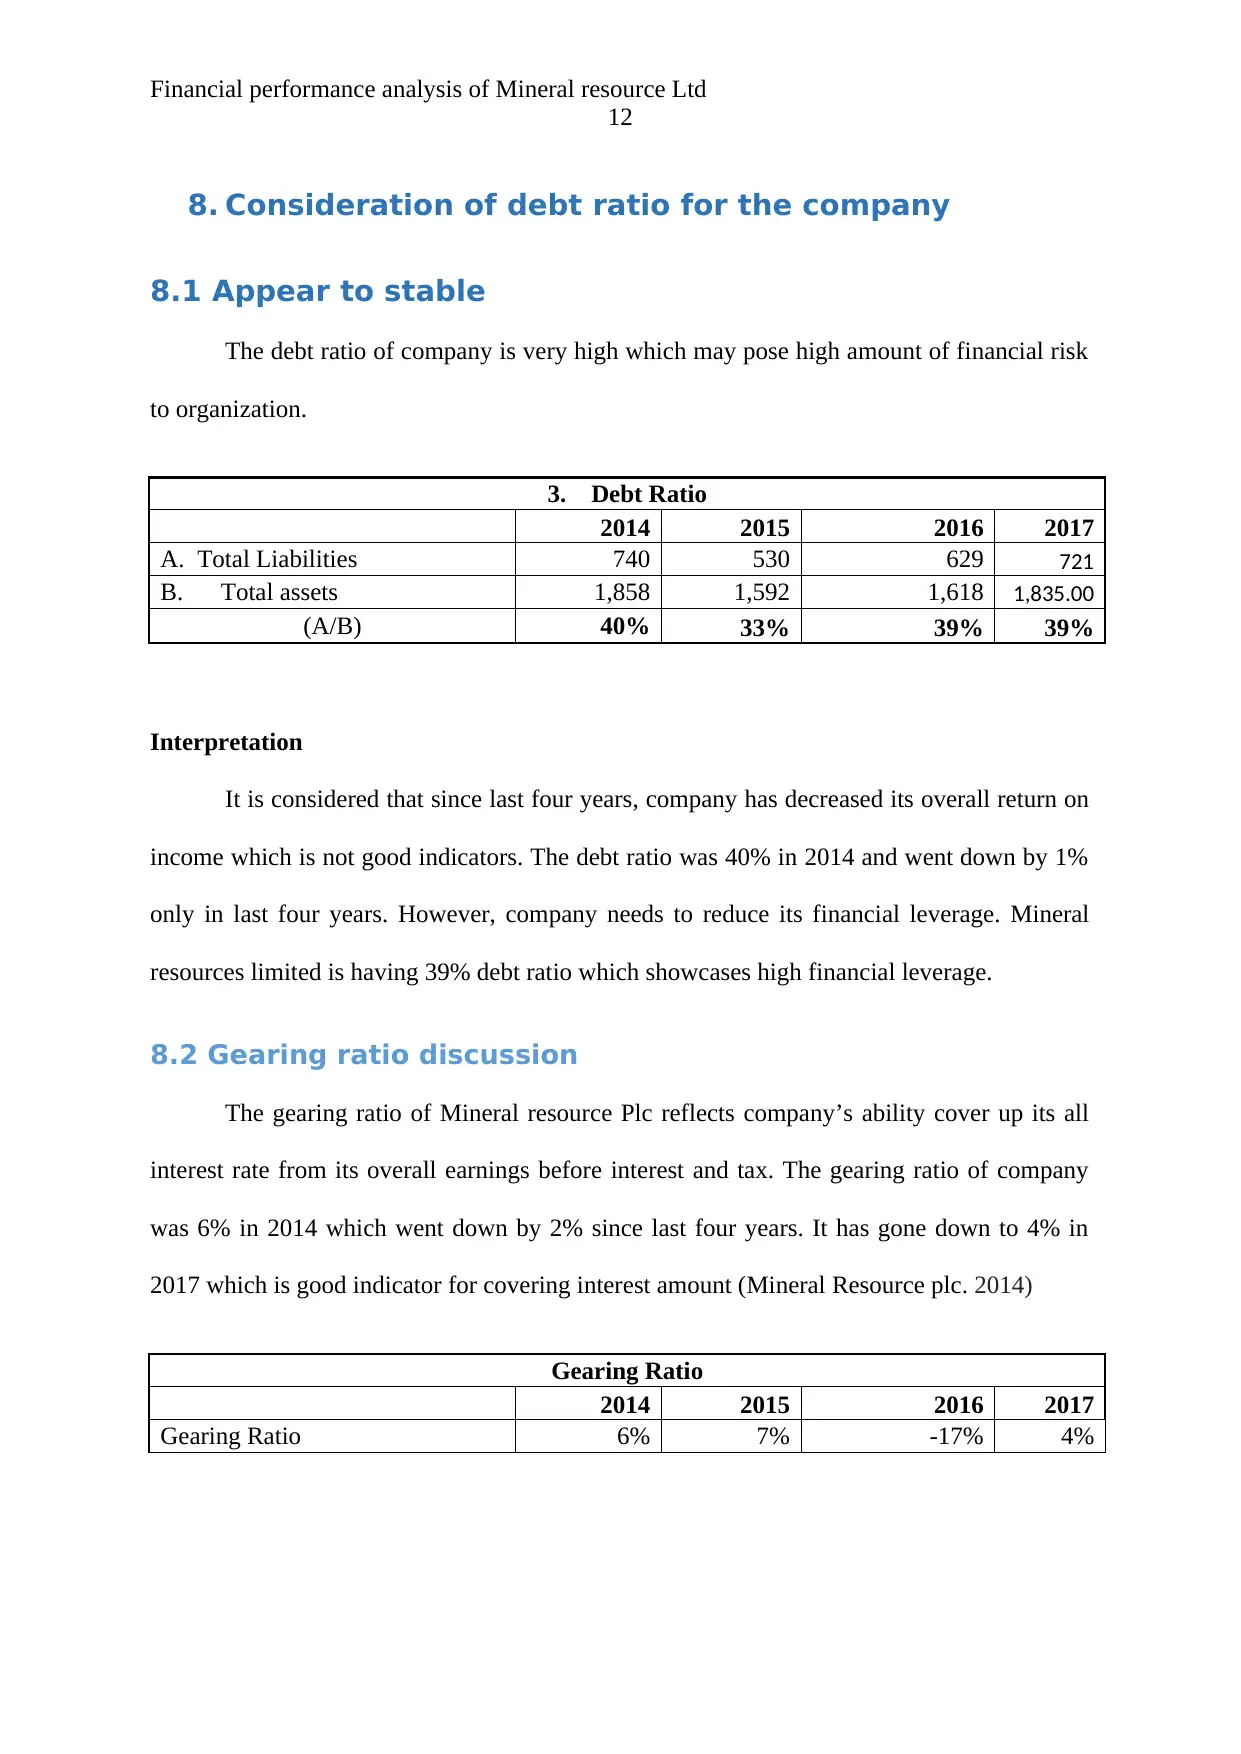
8. Consideration of debt ratio for the company
8.1 Appear to stable
The debt ratio of company is very high which may pose high amount of financial risk
to organization.
3. Debt Ratio
2014 2015 2016 2017
A. Total Liabilities 740 530 629 721
B. Total assets 1,858 1,592 1,618 1,835.00
(A/B) 40% 33% 39% 39%
Interpretation
It is considered that since last four years, company has decreased its overall return on
income which is not good indicators. The debt ratio was 40% in 2014 and went down by 1%
only in last four years. However, company needs to reduce its financial leverage. Mineral
resources limited is having 39% debt ratio which showcases high financial leverage.
8.2 Gearing ratio discussion
The gearing ratio of Mineral resource Plc reflects company’s ability cover up its all
interest rate from its overall earnings before interest and tax. The gearing ratio of company
was 6% in 2014 which went down by 2% since last four years. It has gone down to 4% in
2017 which is good indicator for covering interest amount (Mineral Resource plc. 2014)
Gearing Ratio
2014 2015 2016 2017
Gearing Ratio 6% 7% -17% 4%
12
8. Consideration of debt ratio for the company
8.1 Appear to stable
The debt ratio of company is very high which may pose high amount of financial risk
to organization.
3. Debt Ratio
2014 2015 2016 2017
A. Total Liabilities 740 530 629 721
B. Total assets 1,858 1,592 1,618 1,835.00
(A/B) 40% 33% 39% 39%
Interpretation
It is considered that since last four years, company has decreased its overall return on
income which is not good indicators. The debt ratio was 40% in 2014 and went down by 1%
only in last four years. However, company needs to reduce its financial leverage. Mineral
resources limited is having 39% debt ratio which showcases high financial leverage.
8.2 Gearing ratio discussion
The gearing ratio of Mineral resource Plc reflects company’s ability cover up its all
interest rate from its overall earnings before interest and tax. The gearing ratio of company
was 6% in 2014 which went down by 2% since last four years. It has gone down to 4% in
2017 which is good indicator for covering interest amount (Mineral Resource plc. 2014)
Gearing Ratio
2014 2015 2016 2017
Gearing Ratio 6% 7% -17% 4%
⊘ This is a preview!⊘
Do you want full access?
Subscribe today to unlock all pages.
Trusted by 1+ million students worldwide
1 out of 18
Related Documents


Your All-in-One AI-Powered Toolkit for Academic Success.
+13062052269
info@desklib.com
Available 24*7 on WhatsApp / Email
![[object Object]](/_next/static/media/star-bottom.7253800d.svg)
Unlock your academic potential
Copyright © 2020–2026 A2Z Services. All Rights Reserved. Developed and managed by ZUCOL.