The Global Minimum Wage Problem: Comparative Analysis and Solutions
VerifiedAdded on 2021/06/17
|16
|4221
|21
Report
AI Summary
This report delves into the global minimum wage problem, examining its multifaceted impacts on various economies. It begins by defining the minimum wage and its significance as a global societal challenge, highlighting the varied minimum wage policies across countries like the United States and the United Kingdom. The report explores the background of the issue, discussing the challenges in setting appropriate minimum wage levels and the limitations of existing mechanisms. It analyzes the effects of minimum wage on employment, income inequality, and poverty, supported by statistical data from different countries and regions, including the United Kingdom, the United States, and Sub-Saharan Africa. The analysis includes specific data on minimum wage determinants, effects on employment levels, and the prevalence of multiple minimum wage systems. The report concludes by emphasizing the importance of a moderate minimum wage level to ensure both fair resource distribution and the avoidance of pricing low-productivity workers out of employment.
Running head: THE GLOBAL MINIMUM WAGE PROBLEM 1
The Global Minimum Wage Problem
Student’s name
Course name
Course number
Instructor’s name
Date submitted
The Global Minimum Wage Problem
Student’s name
Course name
Course number
Instructor’s name
Date submitted
Paraphrase This Document
Need a fresh take? Get an instant paraphrase of this document with our AI Paraphraser
Running head: THE GLOBAL MINIMUM WAGE PROBLEM 2
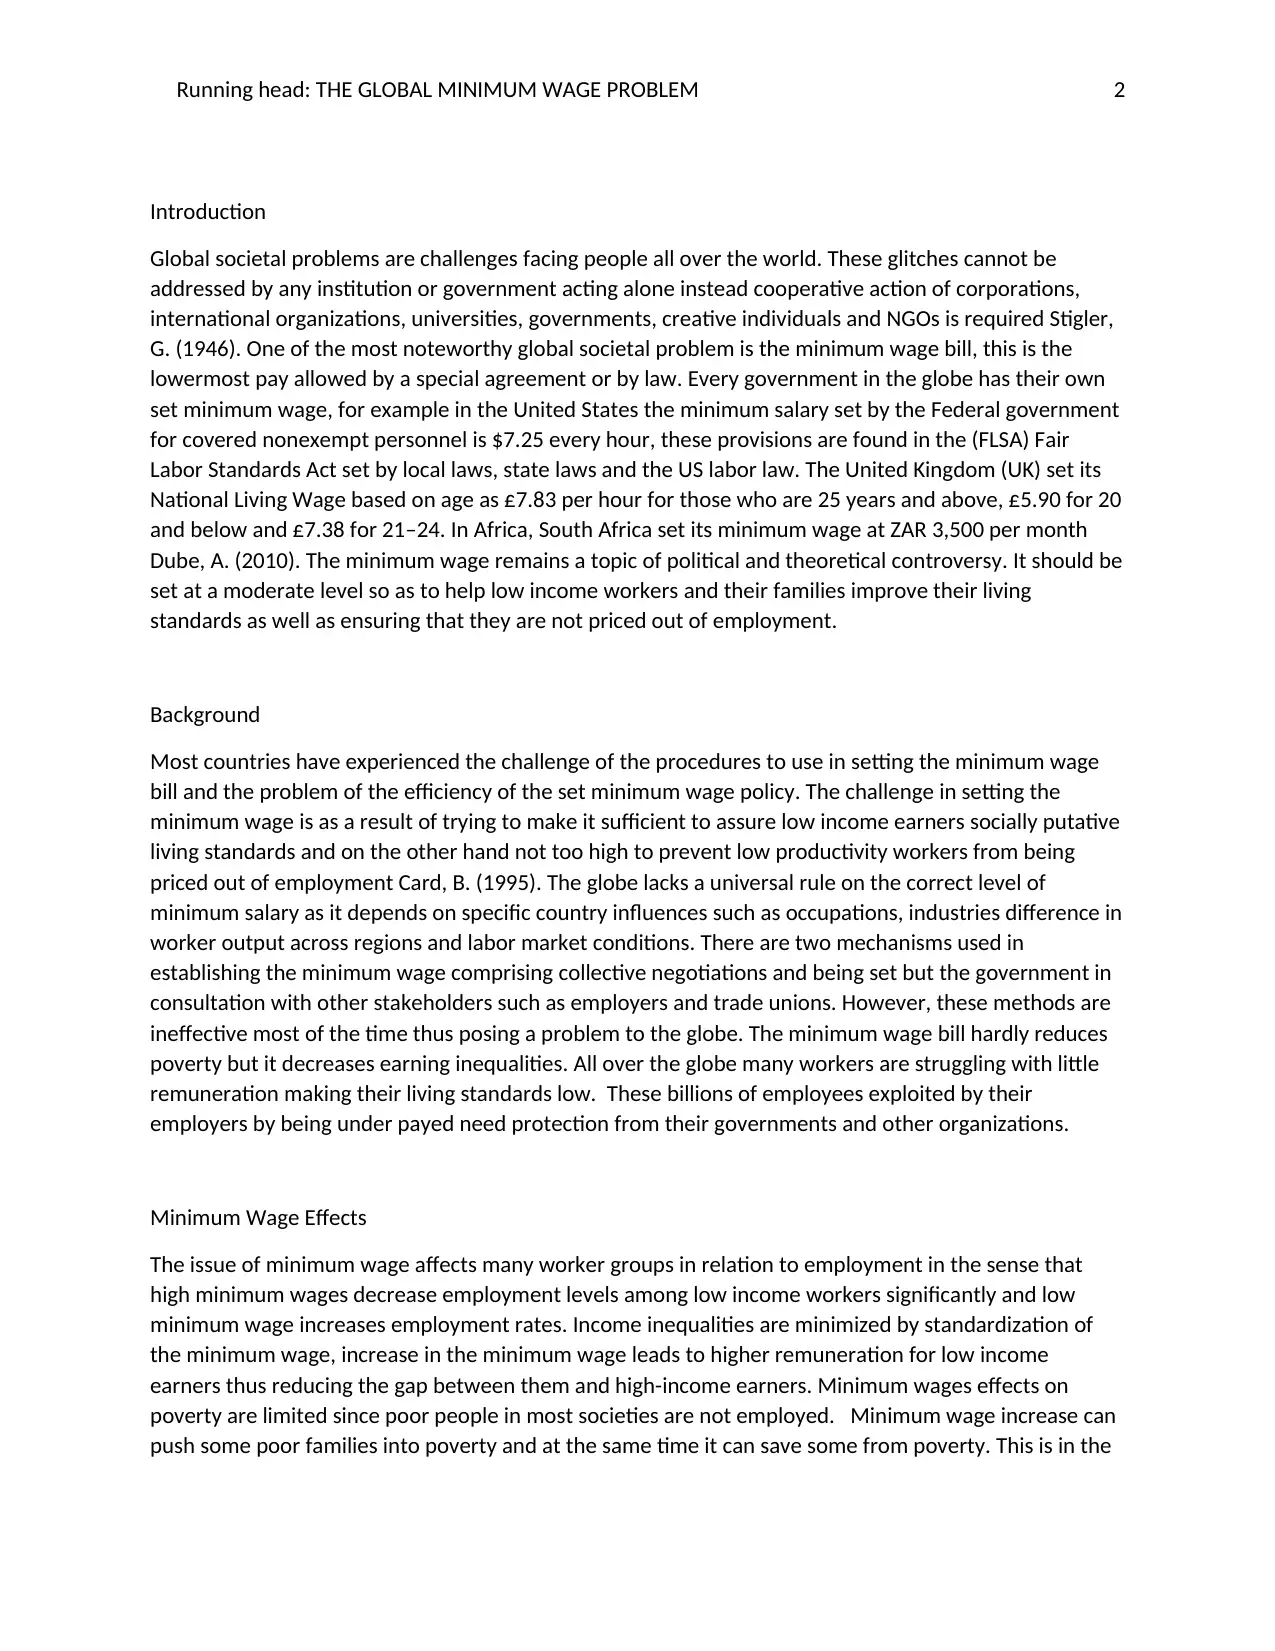
Introduction
Global societal problems are challenges facing people all over the world. These glitches cannot be
addressed by any institution or government acting alone instead cooperative action of corporations,
international organizations, universities, governments, creative individuals and NGOs is required Stigler,
G. (1946). One of the most noteworthy global societal problem is the minimum wage bill, this is the
lowermost pay allowed by a special agreement or by law. Every government in the globe has their own
set minimum wage, for example in the United States the minimum salary set by the Federal government
for covered nonexempt personnel is $7.25 every hour, these provisions are found in the (FLSA) Fair
Labor Standards Act set by local laws, state laws and the US labor law. The United Kingdom (UK) set its
National Living Wage based on age as £7.83 per hour for those who are 25 years and above, £5.90 for 20
and below and £7.38 for 21–24. In Africa, South Africa set its minimum wage at ZAR 3,500 per month
Dube, A. (2010). The minimum wage remains a topic of political and theoretical controversy. It should be
set at a moderate level so as to help low income workers and their families improve their living
standards as well as ensuring that they are not priced out of employment.
Background
Most countries have experienced the challenge of the procedures to use in setting the minimum wage
bill and the problem of the efficiency of the set minimum wage policy. The challenge in setting the
minimum wage is as a result of trying to make it sufficient to assure low income earners socially putative
living standards and on the other hand not too high to prevent low productivity workers from being
priced out of employment Card, B. (1995). The globe lacks a universal rule on the correct level of
minimum salary as it depends on specific country influences such as occupations, industries difference in
worker output across regions and labor market conditions. There are two mechanisms used in
establishing the minimum wage comprising collective negotiations and being set but the government in
consultation with other stakeholders such as employers and trade unions. However, these methods are
ineffective most of the time thus posing a problem to the globe. The minimum wage bill hardly reduces
poverty but it decreases earning inequalities. All over the globe many workers are struggling with little
remuneration making their living standards low. These billions of employees exploited by their
employers by being under payed need protection from their governments and other organizations.
Minimum Wage Effects
The issue of minimum wage affects many worker groups in relation to employment in the sense that
high minimum wages decrease employment levels among low income workers significantly and low
minimum wage increases employment rates. Income inequalities are minimized by standardization of
the minimum wage, increase in the minimum wage leads to higher remuneration for low income
earners thus reducing the gap between them and high-income earners. Minimum wages effects on
poverty are limited since poor people in most societies are not employed. Minimum wage increase can
push some poor families into poverty and at the same time it can save some from poverty. This is in the
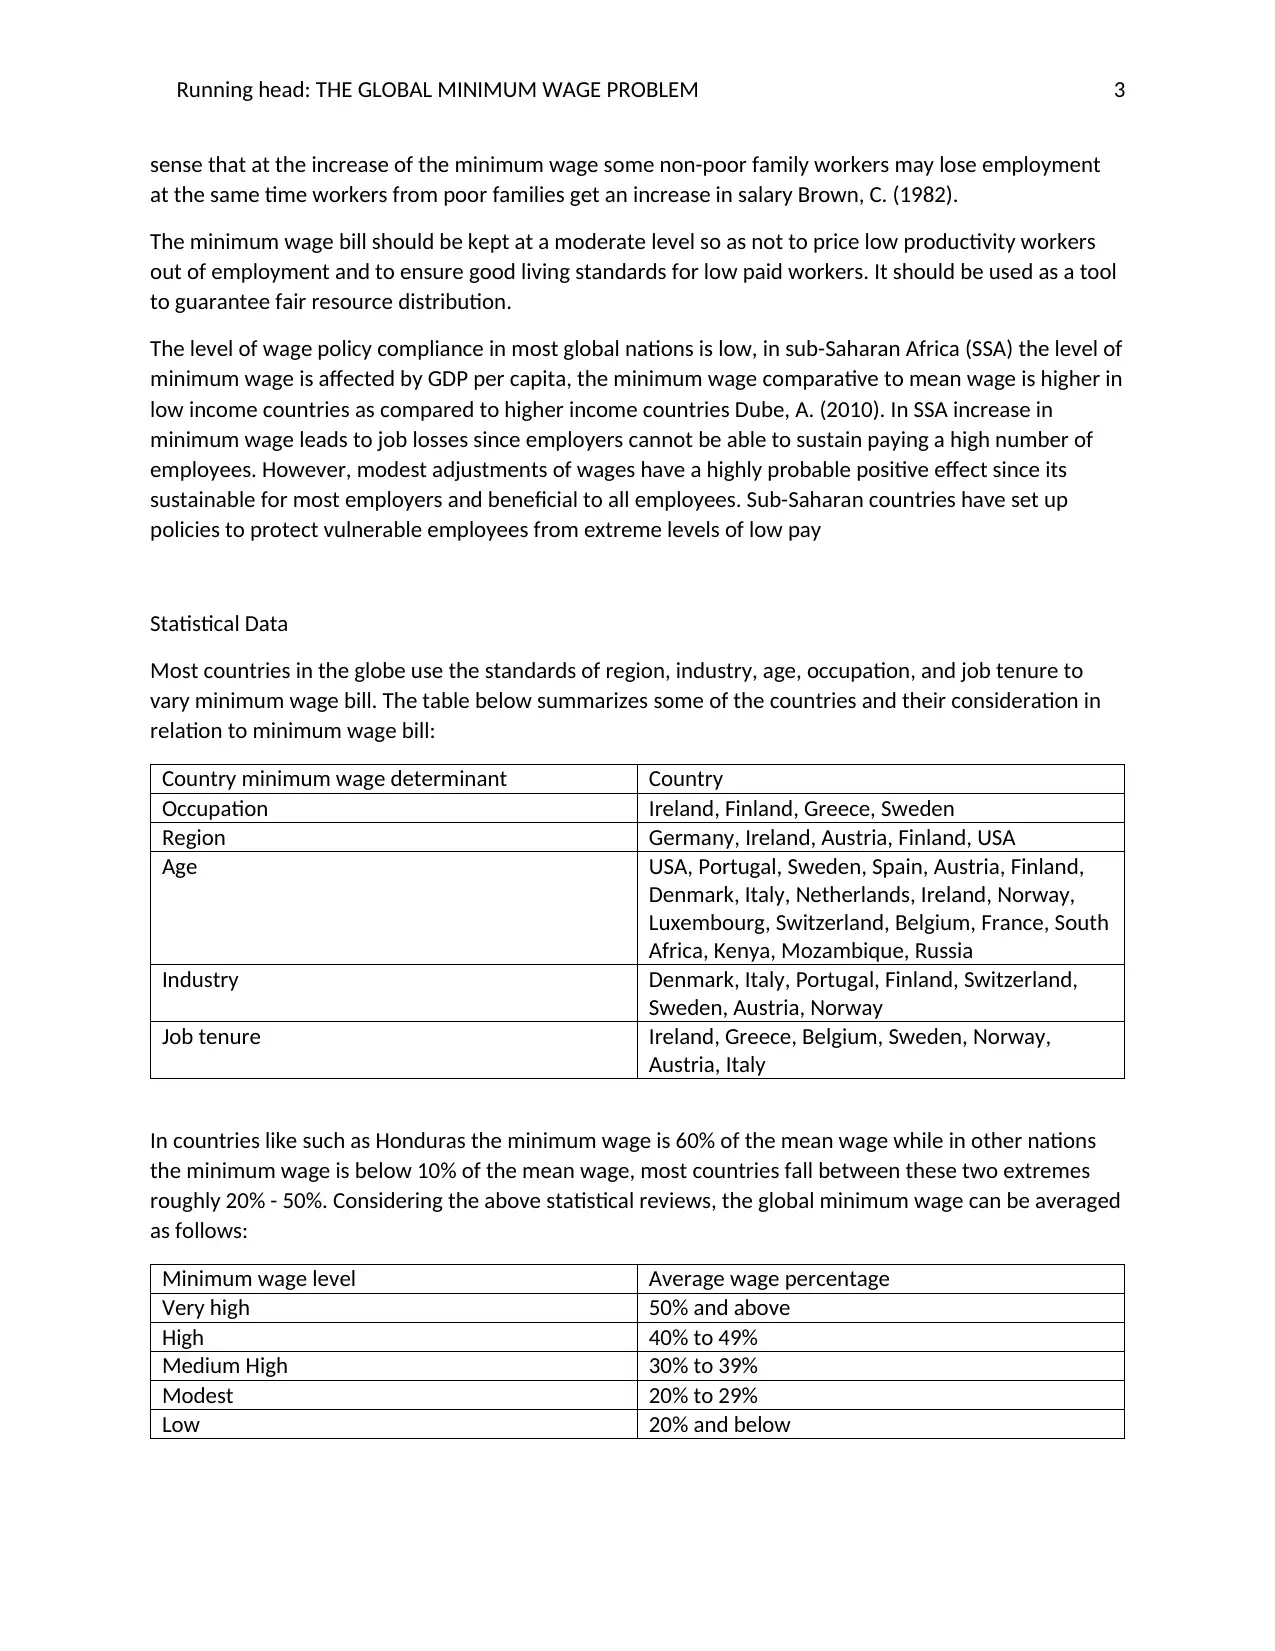
Running head: THE GLOBAL MINIMUM WAGE PROBLEM 3
sense that at the increase of the minimum wage some non-poor family workers may lose employment
at the same time workers from poor families get an increase in salary Brown, C. (1982).
The minimum wage bill should be kept at a moderate level so as not to price low productivity workers
out of employment and to ensure good living standards for low paid workers. It should be used as a tool
to guarantee fair resource distribution.
The level of wage policy compliance in most global nations is low, in sub-Saharan Africa (SSA) the level of
minimum wage is affected by GDP per capita, the minimum wage comparative to mean wage is higher in
low income countries as compared to higher income countries Dube, A. (2010). In SSA increase in
minimum wage leads to job losses since employers cannot be able to sustain paying a high number of
employees. However, modest adjustments of wages have a highly probable positive effect since its
sustainable for most employers and beneficial to all employees. Sub-Saharan countries have set up
policies to protect vulnerable employees from extreme levels of low pay
Statistical Data
Most countries in the globe use the standards of region, industry, age, occupation, and job tenure to
vary minimum wage bill. The table below summarizes some of the countries and their consideration in
relation to minimum wage bill:
Country minimum wage determinant Country
Occupation Ireland, Finland, Greece, Sweden
Region Germany, Ireland, Austria, Finland, USA
Age USA, Portugal, Sweden, Spain, Austria, Finland,
Denmark, Italy, Netherlands, Ireland, Norway,
Luxembourg, Switzerland, Belgium, France, South
Africa, Kenya, Mozambique, Russia
Industry Denmark, Italy, Portugal, Finland, Switzerland,
Sweden, Austria, Norway
Job tenure Ireland, Greece, Belgium, Sweden, Norway,
Austria, Italy
In countries like such as Honduras the minimum wage is 60% of the mean wage while in other nations
the minimum wage is below 10% of the mean wage, most countries fall between these two extremes
roughly 20% - 50%. Considering the above statistical reviews, the global minimum wage can be averaged
as follows:
Minimum wage level Average wage percentage
Very high 50% and above
High 40% to 49%
Medium High 30% to 39%
Modest 20% to 29%
Low 20% and below
⊘ This is a preview!⊘
Do you want full access?
Subscribe today to unlock all pages.
Trusted by 1+ million students worldwide
Running head: THE GLOBAL MINIMUM WAGE PROBLEM 4
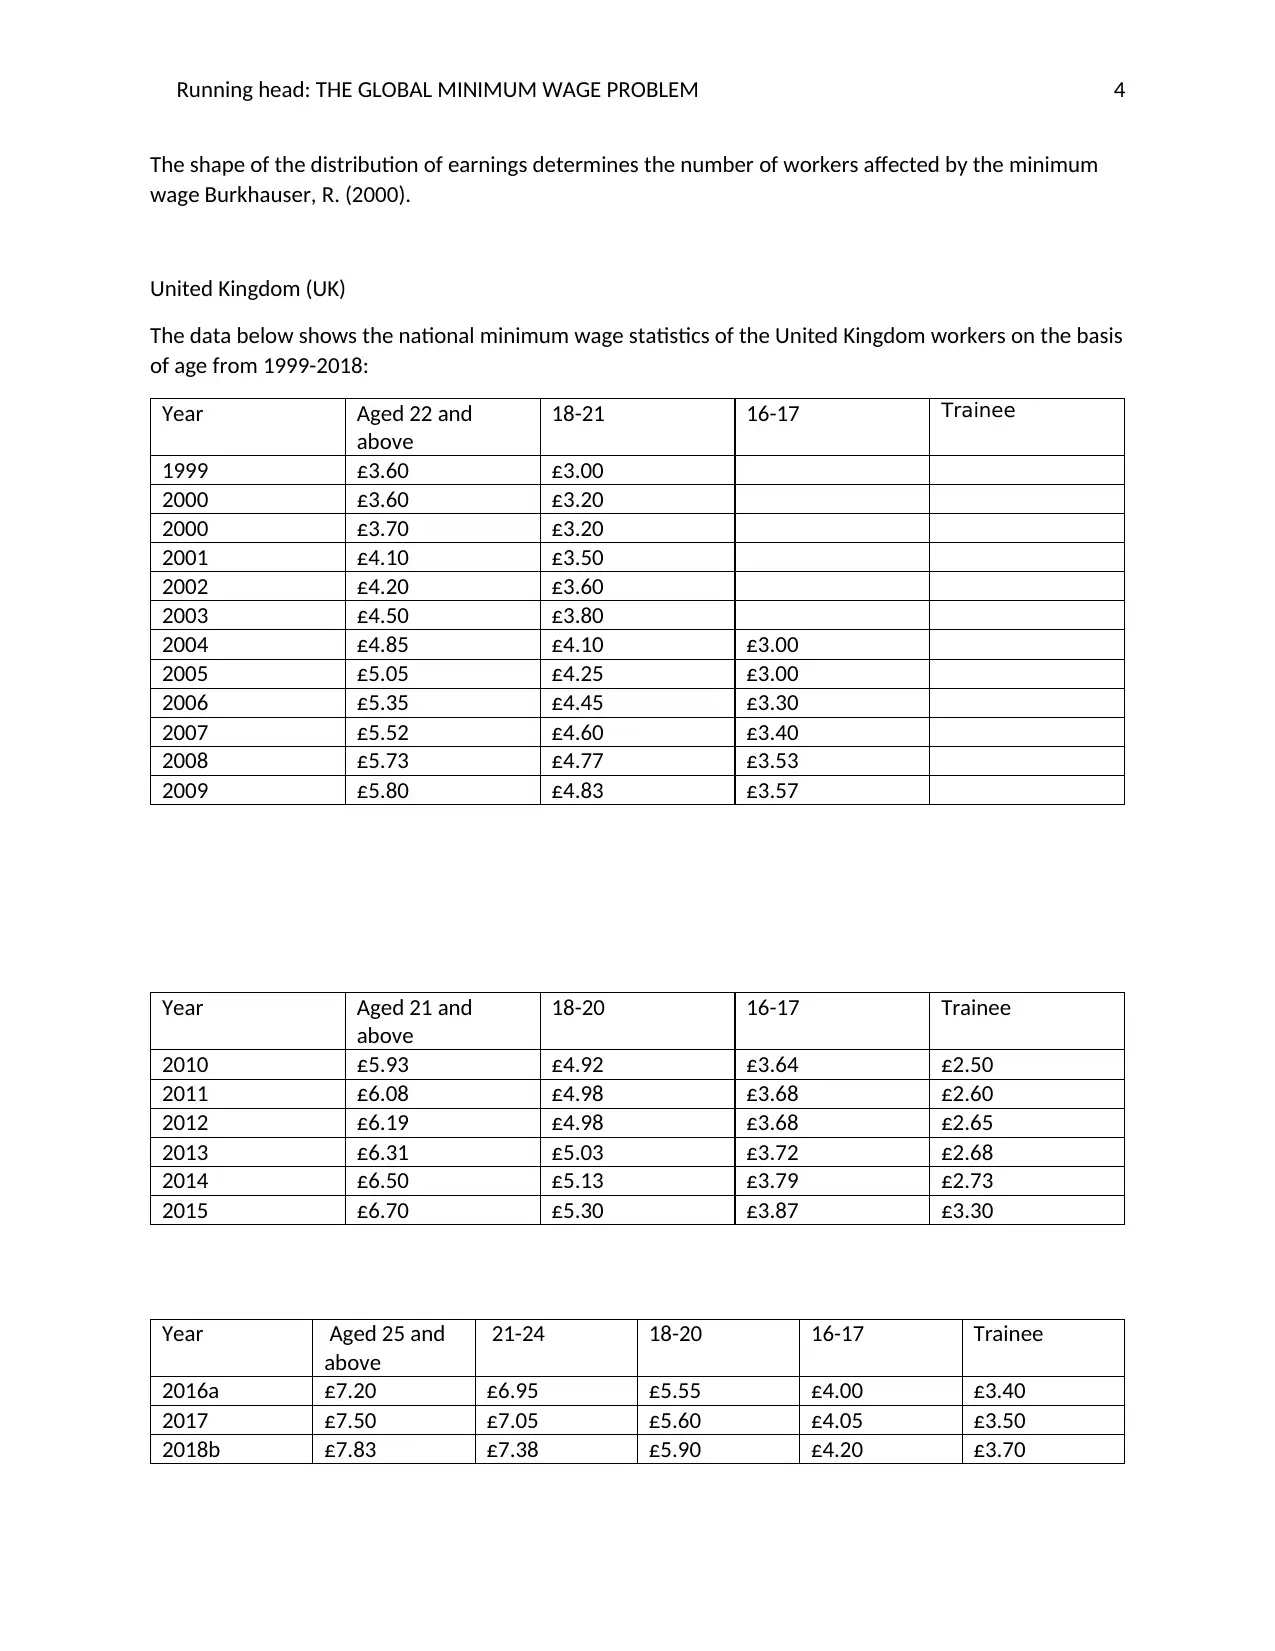
The shape of the distribution of earnings determines the number of workers affected by the minimum
wage Burkhauser, R. (2000).
United Kingdom (UK)
The data below shows the national minimum wage statistics of the United Kingdom workers on the basis
of age from 1999-2018:
Year Aged 22 and
above
18-21 16-17 Trainee
1999 £3.60 £3.00
2000 £3.60 £3.20
2000 £3.70 £3.20
2001 £4.10 £3.50
2002 £4.20 £3.60
2003 £4.50 £3.80
2004 £4.85 £4.10 £3.00
2005 £5.05 £4.25 £3.00
2006 £5.35 £4.45 £3.30
2007 £5.52 £4.60 £3.40
2008 £5.73 £4.77 £3.53
2009 £5.80 £4.83 £3.57
Year Aged 21 and
above
18-20 16-17 Trainee
2010 £5.93 £4.92 £3.64 £2.50
2011 £6.08 £4.98 £3.68 £2.60
2012 £6.19 £4.98 £3.68 £2.65
2013 £6.31 £5.03 £3.72 £2.68
2014 £6.50 £5.13 £3.79 £2.73
2015 £6.70 £5.30 £3.87 £3.30
Year Aged 25 and
above
21-24 18-20 16-17 Trainee
2016a £7.20 £6.95 £5.55 £4.00 £3.40
2017 £7.50 £7.05 £5.60 £4.05 £3.50
2018b £7.83 £7.38 £5.90 £4.20 £3.70
Paraphrase This Document
Need a fresh take? Get an instant paraphrase of this document with our AI Paraphraser
Running head: THE GLOBAL MINIMUM WAGE PROBLEM 5
From the table above employees aged twenty-five years and above earn more averagely as compared to
those aged sixteen and seventeen years. This evidences the fact that the United Kingdom highly bases
their payments on age.
The table further social that the national Minimum Wage increases gradually as the years go by which is
beneficial to low income earners Freeman, R (1996).
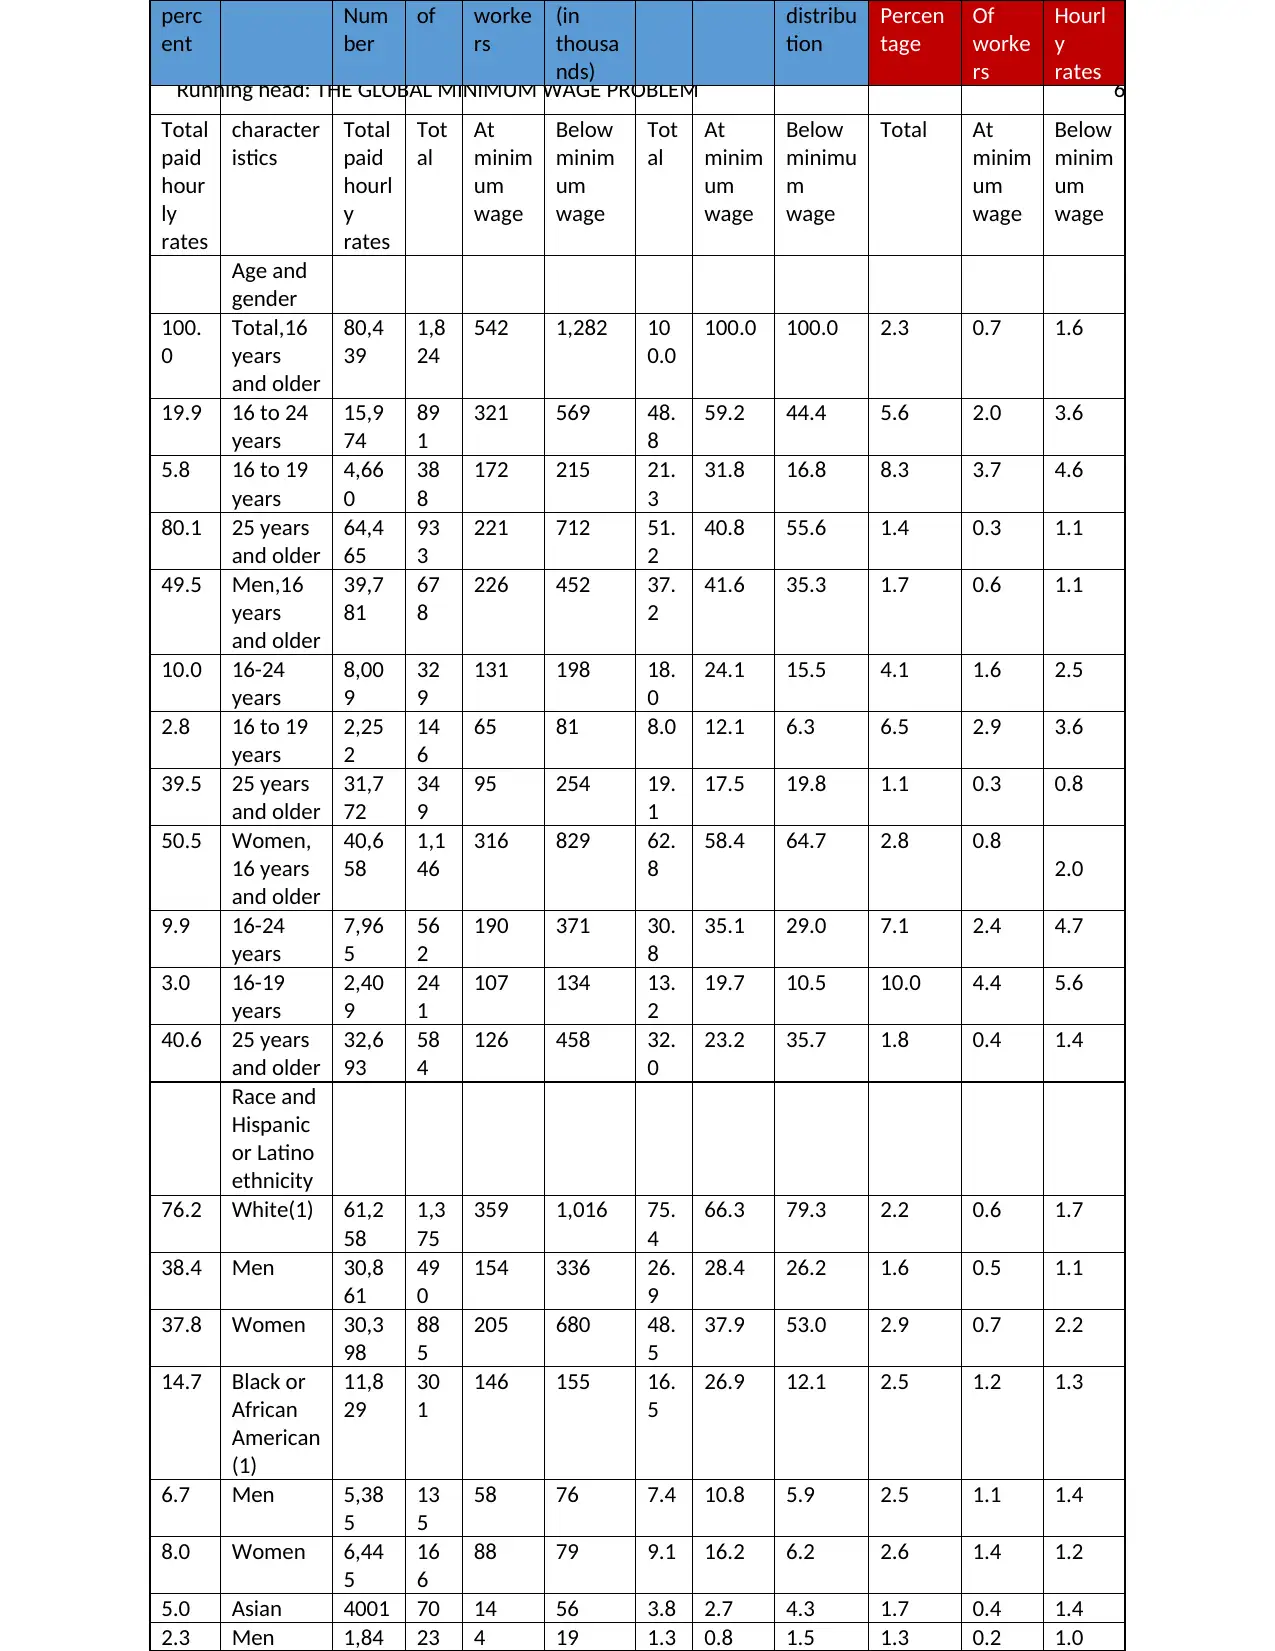
United States of America (USA)
The table below shows the Federal minimum wage of workers in the United States in 2017 Lemos, S
(2004):
Note: Table obtained from: https://www.bls.gov/opub/reports/minimum-wage/2017/home.htm
From the table above employees aged twenty-five years and above earn more averagely as compared to
those aged sixteen and seventeen years. This evidences the fact that the United Kingdom highly bases
their payments on age.
The table further social that the national Minimum Wage increases gradually as the years go by which is
beneficial to low income earners Freeman, R (1996).
United States of America (USA)
The table below shows the Federal minimum wage of workers in the United States in 2017 Lemos, S
(2004):
Note: Table obtained from: https://www.bls.gov/opub/reports/minimum-wage/2017/home.htm
Running head: THE GLOBAL MINIMUM WAGE PROBLEM 6
perc
ent
Num
ber
of worke
rs
(in
thousa
nds)
distribu
tion
Percen
tage
Of
worke
rs
Hourl
y
rates
Total
paid
hour
ly
rates
character
istics
Total
paid
hourl
y
rates
Tot
al
At
minim
um
wage
Below
minim
um
wage
Tot
al
At
minim
um
wage
Below
minimu
m
wage
Total At
minim
um
wage
Below
minim
um
wage
Age and
gender
100.
0
Total,16
years
and older
80,4
39
1,8
24
542 1,282 10
0.0
100.0 100.0 2.3 0.7 1.6
19.9 16 to 24
years
15,9
74
89
1
321 569 48.
8
59.2 44.4 5.6 2.0 3.6
5.8 16 to 19
years
4,66
0
38
8
172 215 21.
3
31.8 16.8 8.3 3.7 4.6
80.1 25 years
and older
64,4
65
93
3
221 712 51.
2
40.8 55.6 1.4 0.3 1.1
49.5 Men,16
years
and older
39,7
81
67
8
226 452 37.
2
41.6 35.3 1.7 0.6 1.1
10.0 16-24
years
8,00
9
32
9
131 198 18.
0
24.1 15.5 4.1 1.6 2.5
2.8 16 to 19
years
2,25
2
14
6
65 81 8.0 12.1 6.3 6.5 2.9 3.6
39.5 25 years
and older
31,7
72
34
9
95 254 19.
1
17.5 19.8 1.1 0.3 0.8
50.5 Women,
16 years
and older
40,6
58
1,1
46
316 829 62.
8
58.4 64.7 2.8 0.8
2.0
9.9 16-24
years
7,96
5
56
2
190 371 30.
8
35.1 29.0 7.1 2.4 4.7
3.0 16-19
years
2,40
9
24
1
107 134 13.
2
19.7 10.5 10.0 4.4 5.6
40.6 25 years
and older
32,6
93
58
4
126 458 32.
0
23.2 35.7 1.8 0.4 1.4
Race and
Hispanic
or Latino
ethnicity
76.2 White(1) 61,2
58
1,3
75
359 1,016 75.
4
66.3 79.3 2.2 0.6 1.7
38.4 Men 30,8
61
49
0
154 336 26.
9
28.4 26.2 1.6 0.5 1.1
37.8 Women 30,3
98
88
5
205 680 48.
5
37.9 53.0 2.9 0.7 2.2
14.7 Black or
African
American
(1)
11,8
29
30
1
146 155 16.
5
26.9 12.1 2.5 1.2 1.3
6.7 Men 5,38
5
13
5
58 76 7.4 10.8 5.9 2.5 1.1 1.4
8.0 Women 6,44
5
16
6
88 79 9.1 16.2 6.2 2.6 1.4 1.2
5.0 Asian 4001 70 14 56 3.8 2.7 4.3 1.7 0.4 1.4
2.3 Men 1,84 23 4 19 1.3 0.8 1.5 1.3 0.2 1.0
⊘ This is a preview!⊘
Do you want full access?
Subscribe today to unlock all pages.
Trusted by 1+ million students worldwide
Running head: THE GLOBAL MINIMUM WAGE PROBLEM 7
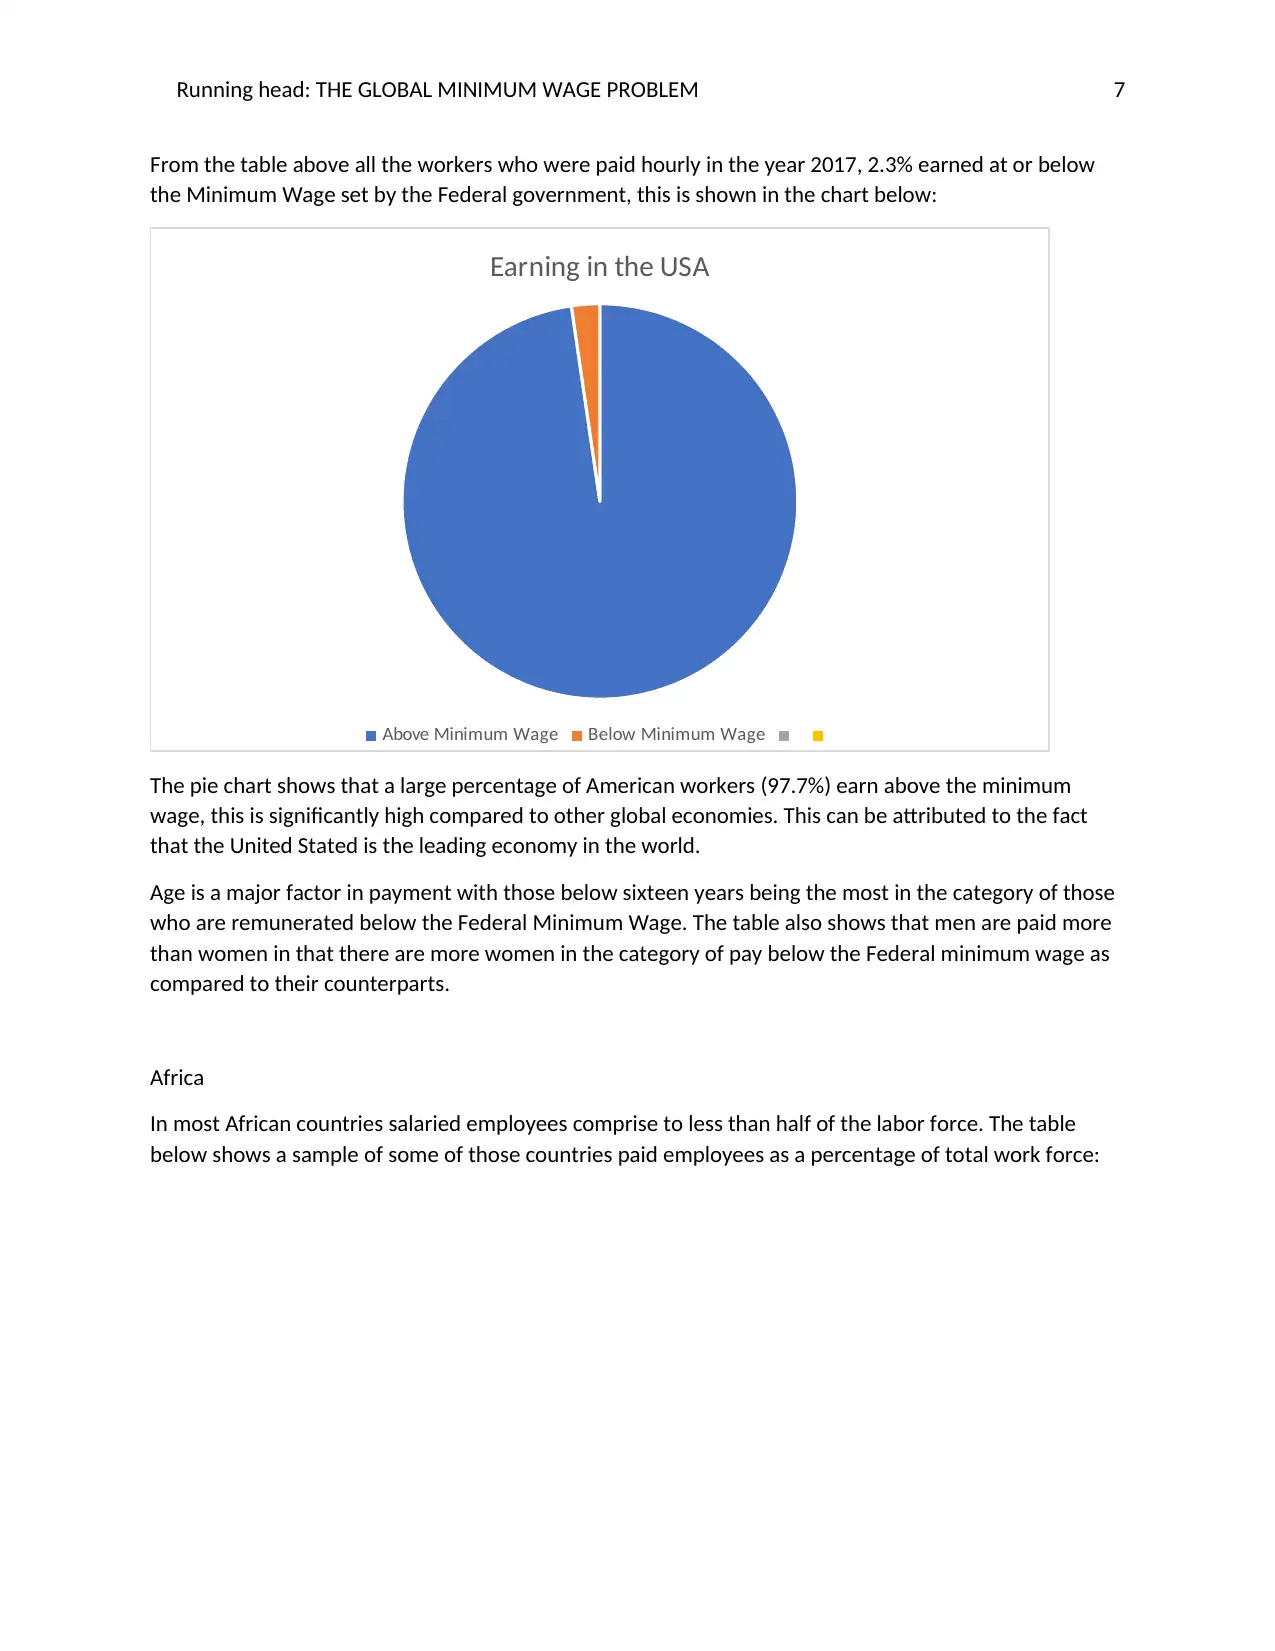
From the table above all the workers who were paid hourly in the year 2017, 2.3% earned at or below
the Minimum Wage set by the Federal government, this is shown in the chart below:
Earning in the USA
Above Minimum Wage Below Minimum Wage
The pie chart shows that a large percentage of American workers (97.7%) earn above the minimum
wage, this is significantly high compared to other global economies. This can be attributed to the fact
that the United Stated is the leading economy in the world.
Age is a major factor in payment with those below sixteen years being the most in the category of those
who are remunerated below the Federal Minimum Wage. The table also shows that men are paid more
than women in that there are more women in the category of pay below the Federal minimum wage as
compared to their counterparts.
Africa
In most African countries salaried employees comprise to less than half of the labor force. The table
below shows a sample of some of those countries paid employees as a percentage of total work force:
Paraphrase This Document
Need a fresh take? Get an instant paraphrase of this document with our AI Paraphraser
Running head: THE GLOBAL MINIMUM WAGE PROBLEM 8
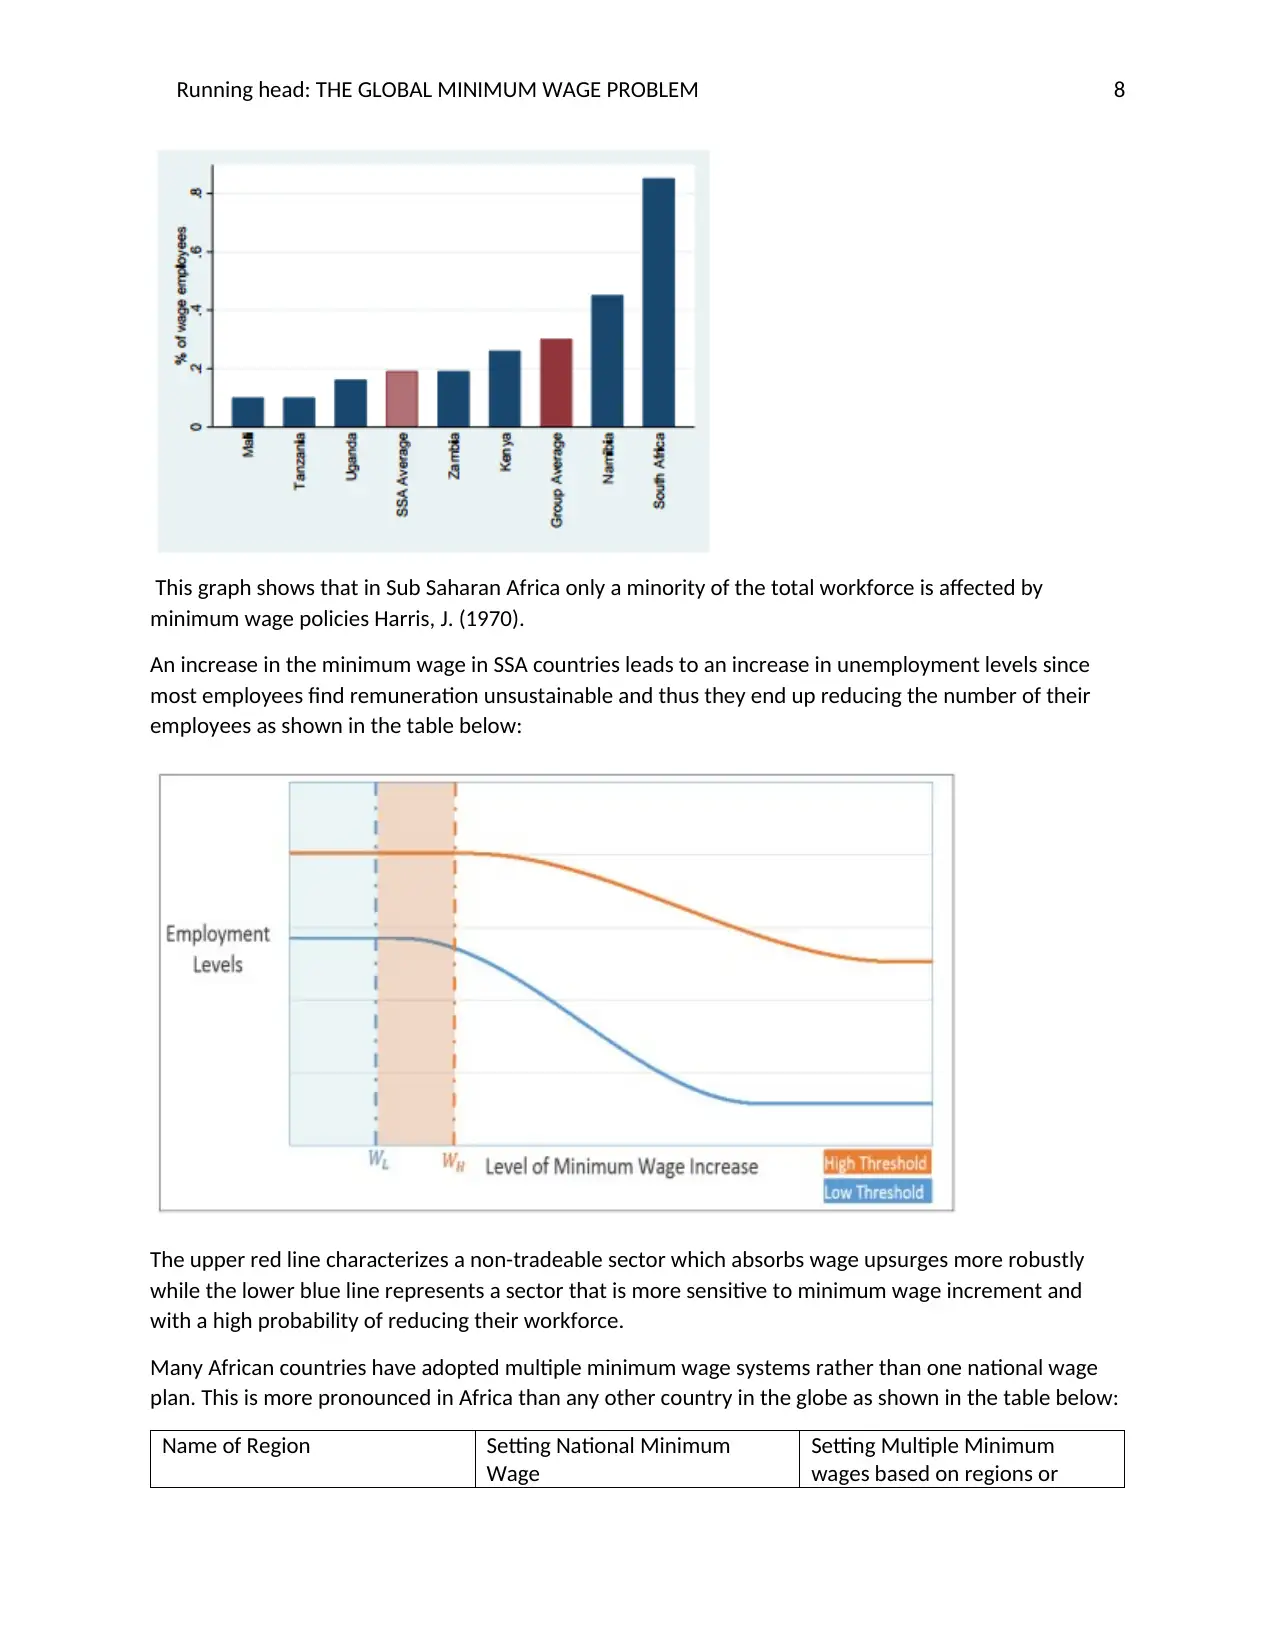
This graph shows that in Sub Saharan Africa only a minority of the total workforce is affected by
minimum wage policies Harris, J. (1970).
An increase in the minimum wage in SSA countries leads to an increase in unemployment levels since
most employees find remuneration unsustainable and thus they end up reducing the number of their
employees as shown in the table below:
The upper red line characterizes a non-tradeable sector which absorbs wage upsurges more robustly
while the lower blue line represents a sector that is more sensitive to minimum wage increment and
with a high probability of reducing their workforce.
Many African countries have adopted multiple minimum wage systems rather than one national wage
plan. This is more pronounced in Africa than any other country in the globe as shown in the table below:
Name of Region Setting National Minimum
Wage
Setting Multiple Minimum
wages based on regions or
Running head: THE GLOBAL MINIMUM WAGE PROBLEM 9
sectors
Caribbean and Americas 59 percent 38 percent
Asia and Pacific 48 percent 48 percent
Africa 30 percent 61 percent
Europe and CIS 64 percent 33 percent
Middle East 40 percent 20 percent
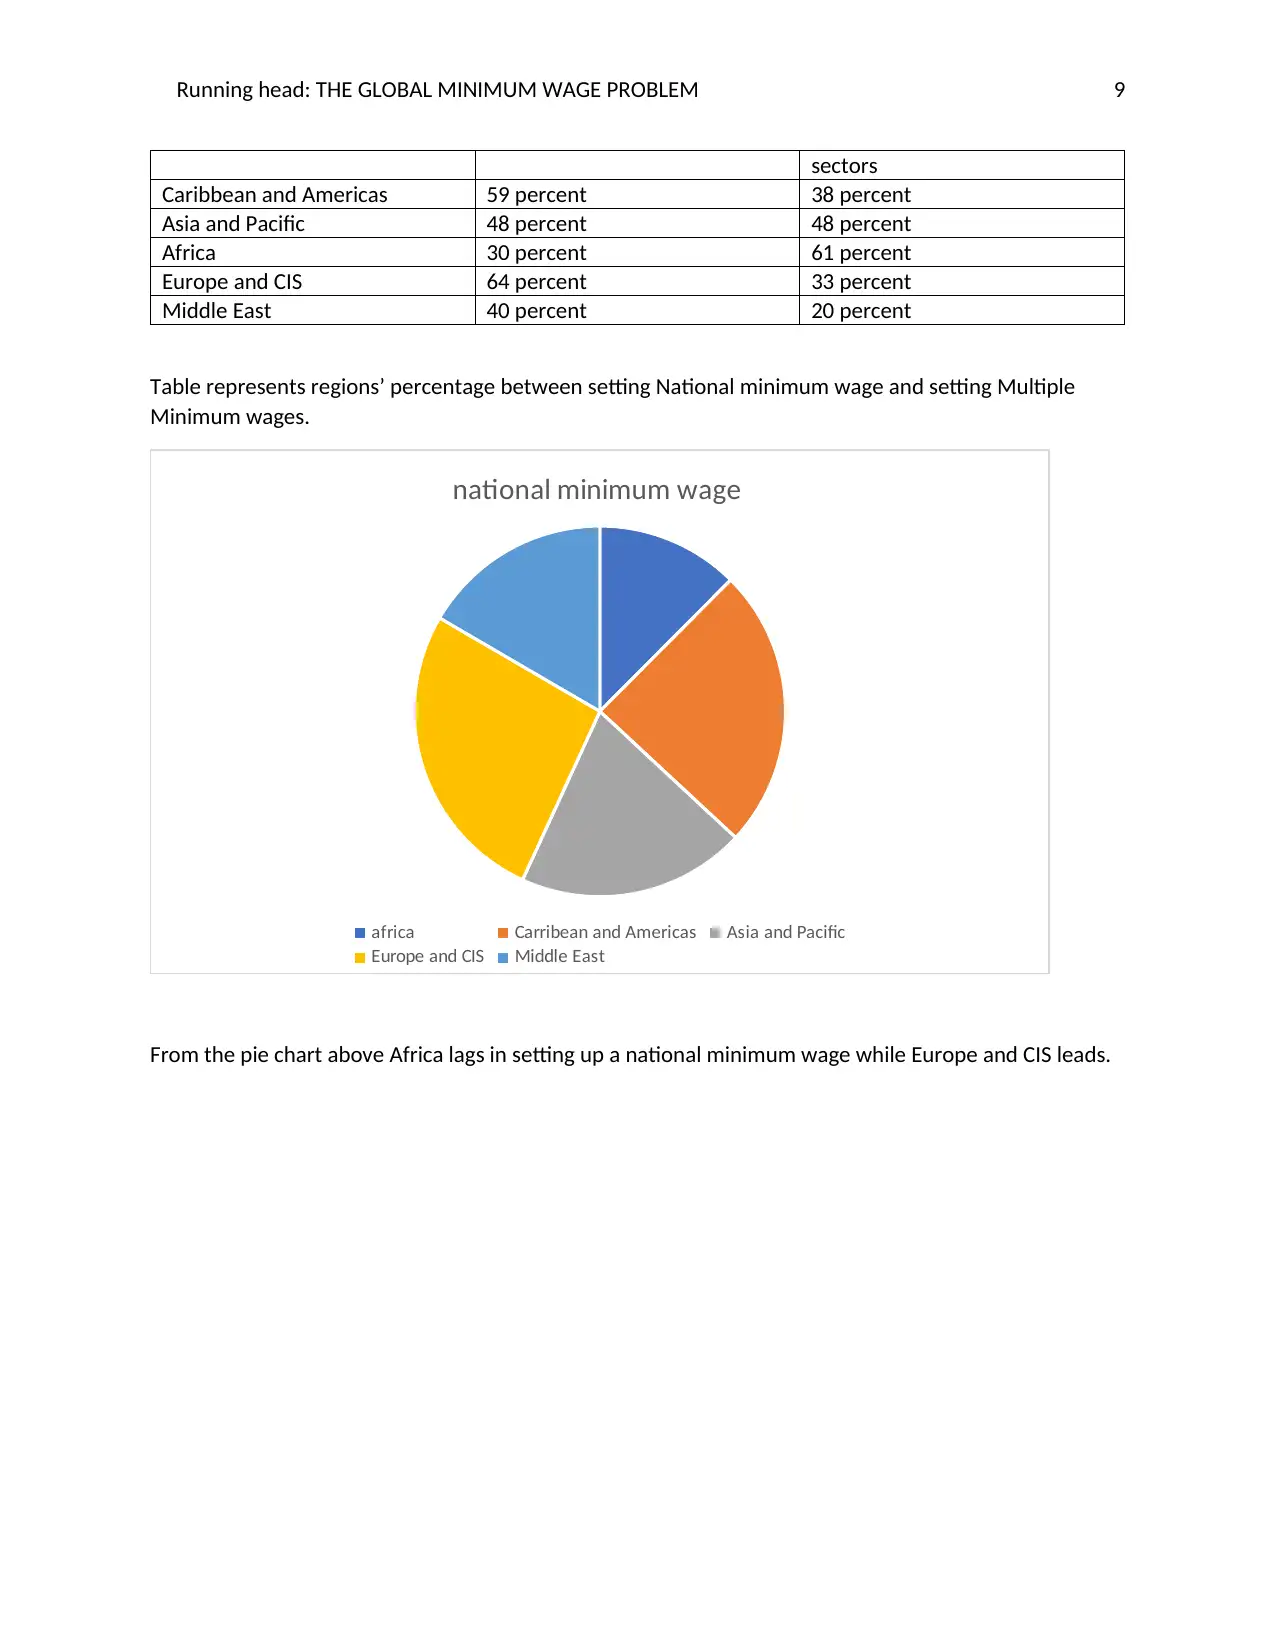
Table represents regions’ percentage between setting National minimum wage and setting Multiple
Minimum wages.
national minimum wage
africa Carribean and Americas Asia and Pacific
Europe and CIS Middle East
From the pie chart above Africa lags in setting up a national minimum wage while Europe and CIS leads.
sectors
Caribbean and Americas 59 percent 38 percent
Asia and Pacific 48 percent 48 percent
Africa 30 percent 61 percent
Europe and CIS 64 percent 33 percent
Middle East 40 percent 20 percent
Table represents regions’ percentage between setting National minimum wage and setting Multiple
Minimum wages.
national minimum wage
africa Carribean and Americas Asia and Pacific
Europe and CIS Middle East
From the pie chart above Africa lags in setting up a national minimum wage while Europe and CIS leads.
⊘ This is a preview!⊘
Do you want full access?
Subscribe today to unlock all pages.
Trusted by 1+ million students worldwide
Running head: THE GLOBAL MINIMUM WAGE PROBLEM 10
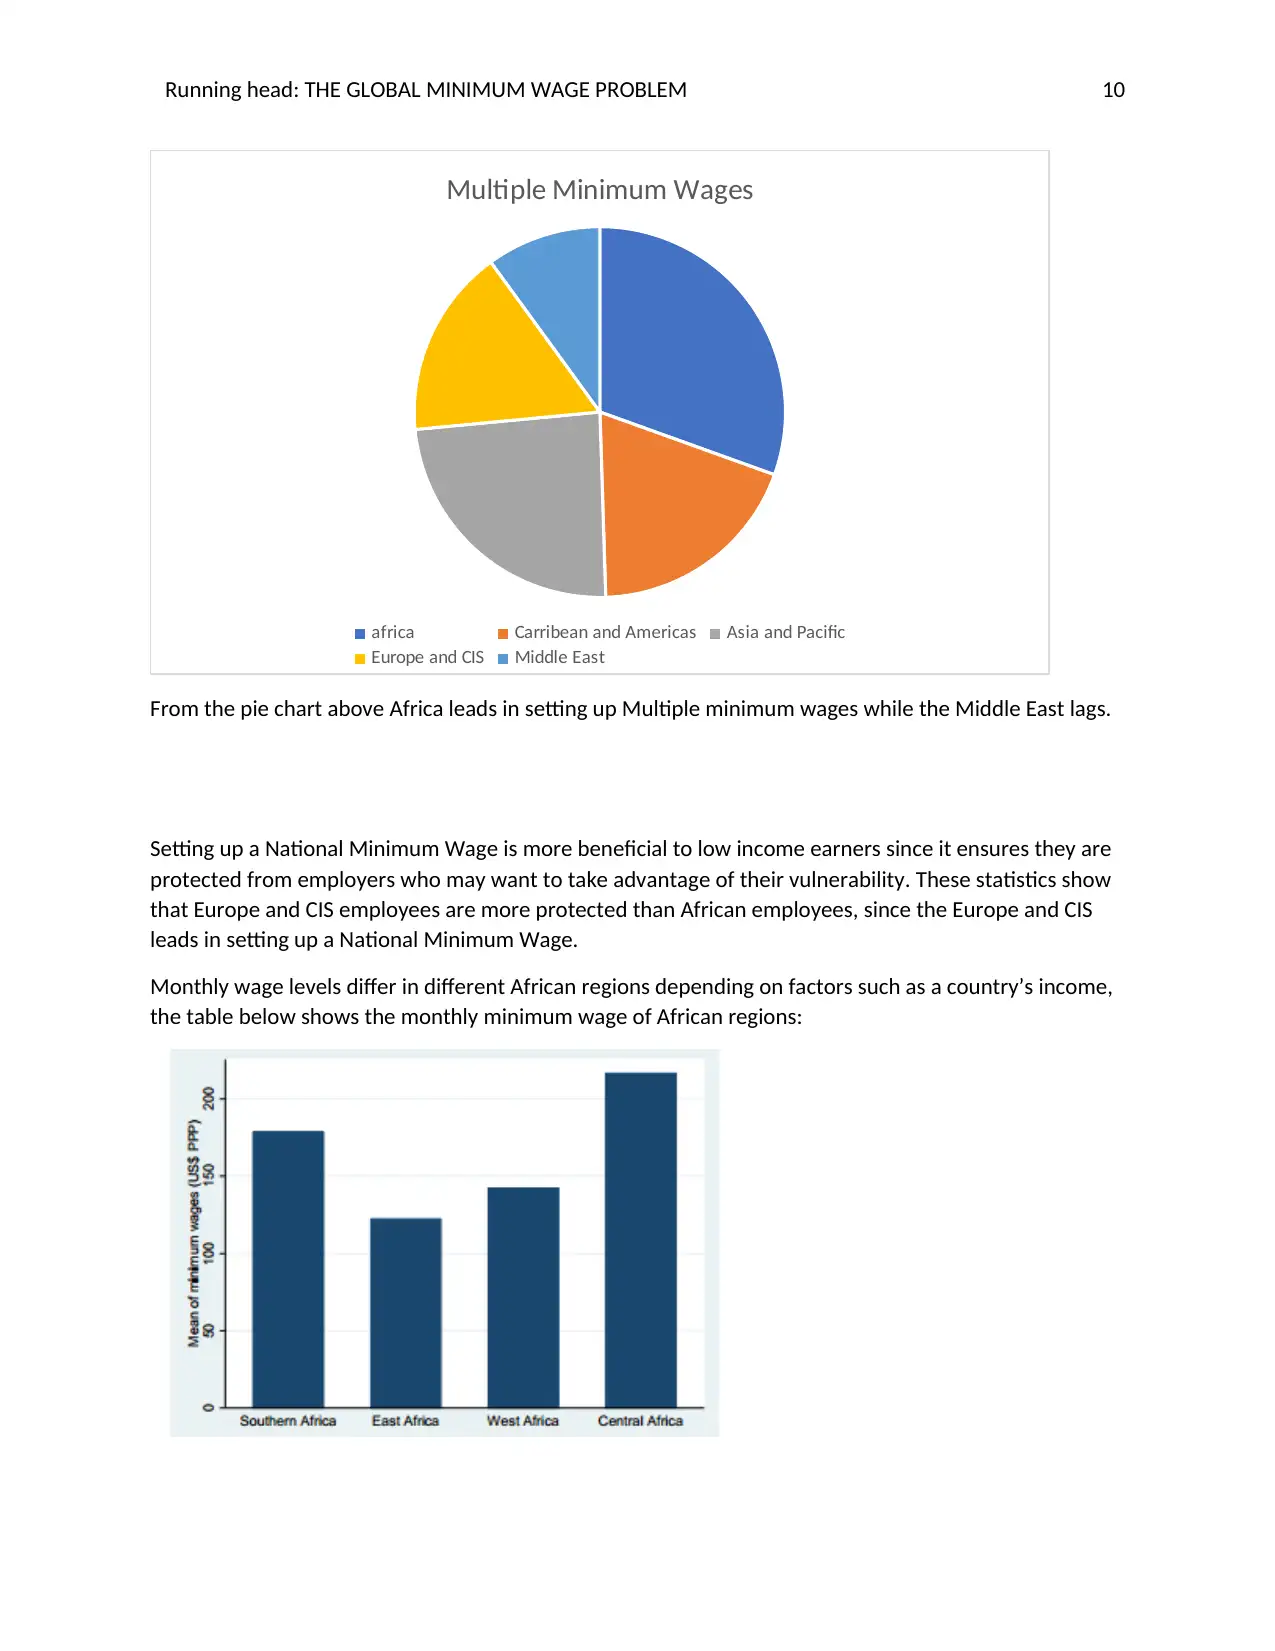
Multiple Minimum Wages
africa Carribean and Americas Asia and Pacific
Europe and CIS Middle East
From the pie chart above Africa leads in setting up Multiple minimum wages while the Middle East lags.
Setting up a National Minimum Wage is more beneficial to low income earners since it ensures they are
protected from employers who may want to take advantage of their vulnerability. These statistics show
that Europe and CIS employees are more protected than African employees, since the Europe and CIS
leads in setting up a National Minimum Wage.
Monthly wage levels differ in different African regions depending on factors such as a country’s income,
the table below shows the monthly minimum wage of African regions:
Paraphrase This Document
Need a fresh take? Get an instant paraphrase of this document with our AI Paraphraser
Running head: THE GLOBAL MINIMUM WAGE PROBLEM 11
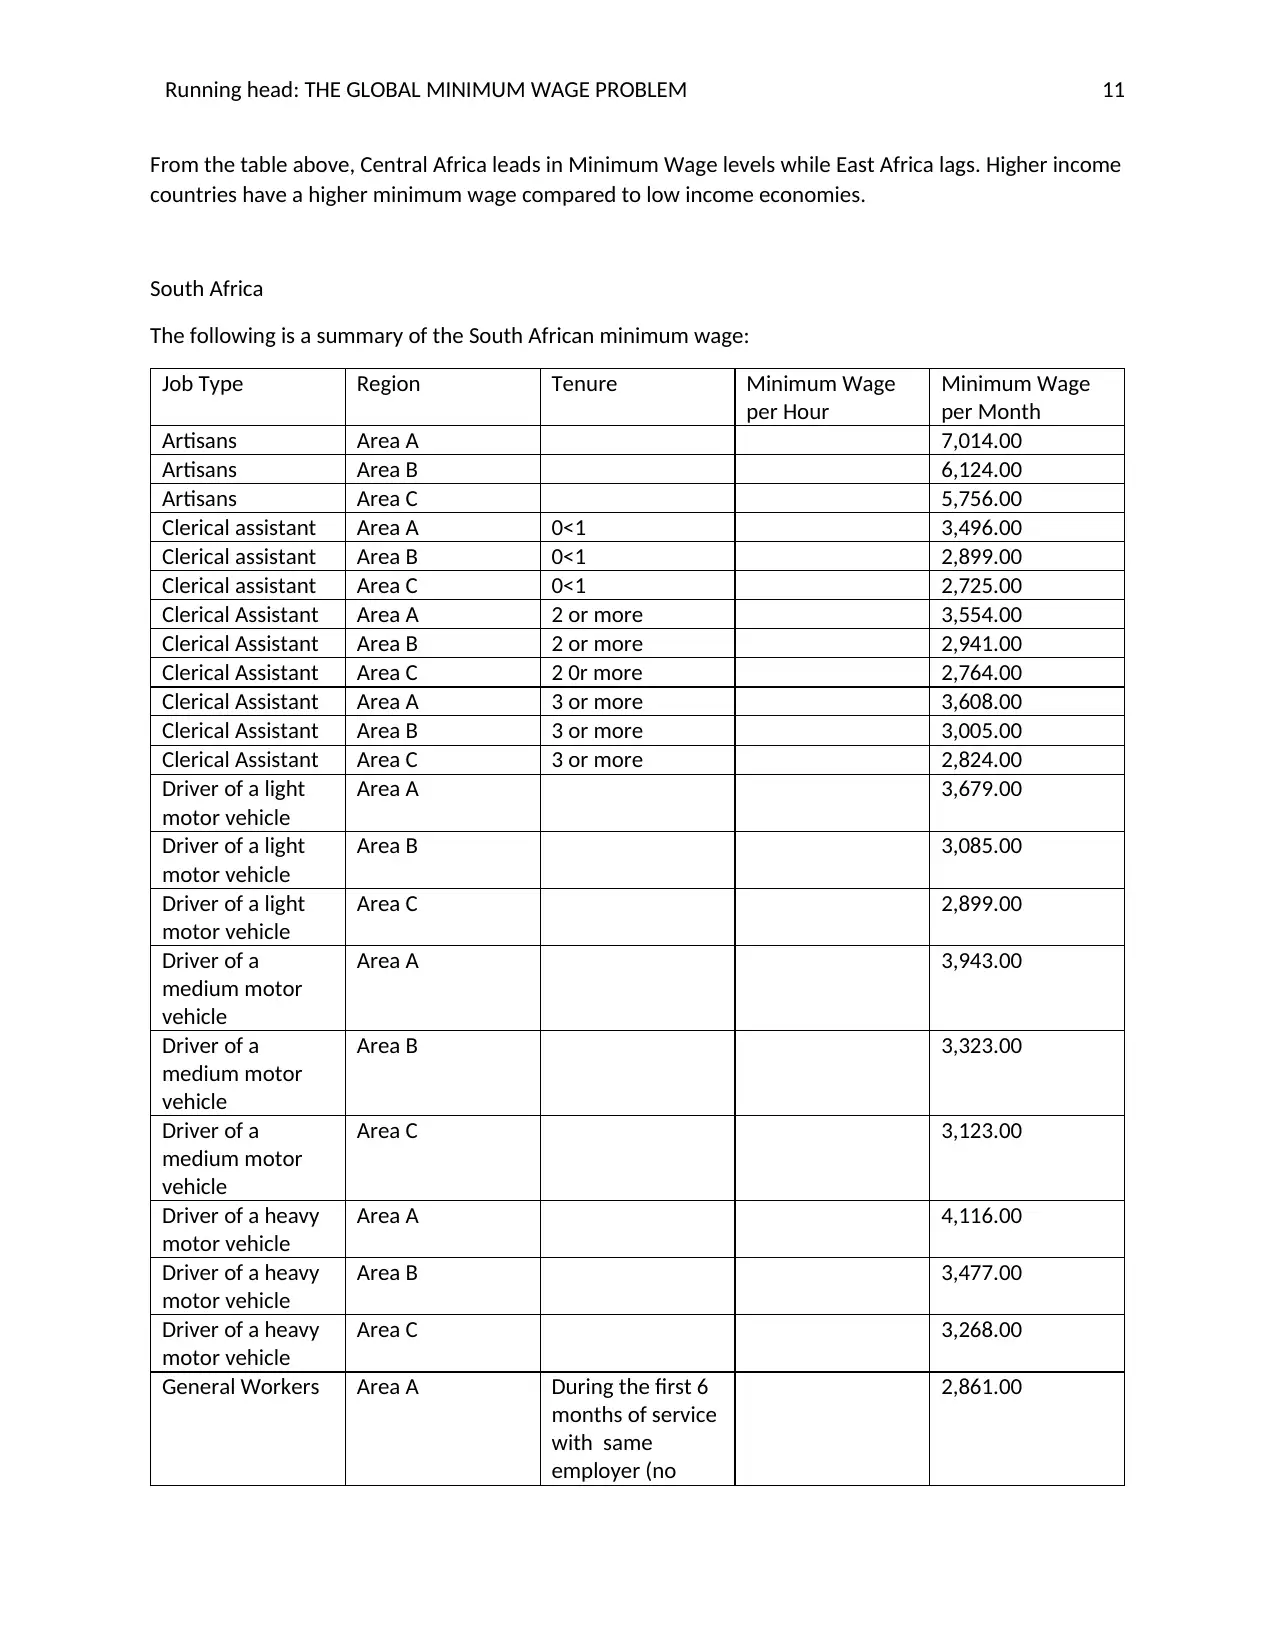
From the table above, Central Africa leads in Minimum Wage levels while East Africa lags. Higher income
countries have a higher minimum wage compared to low income economies.
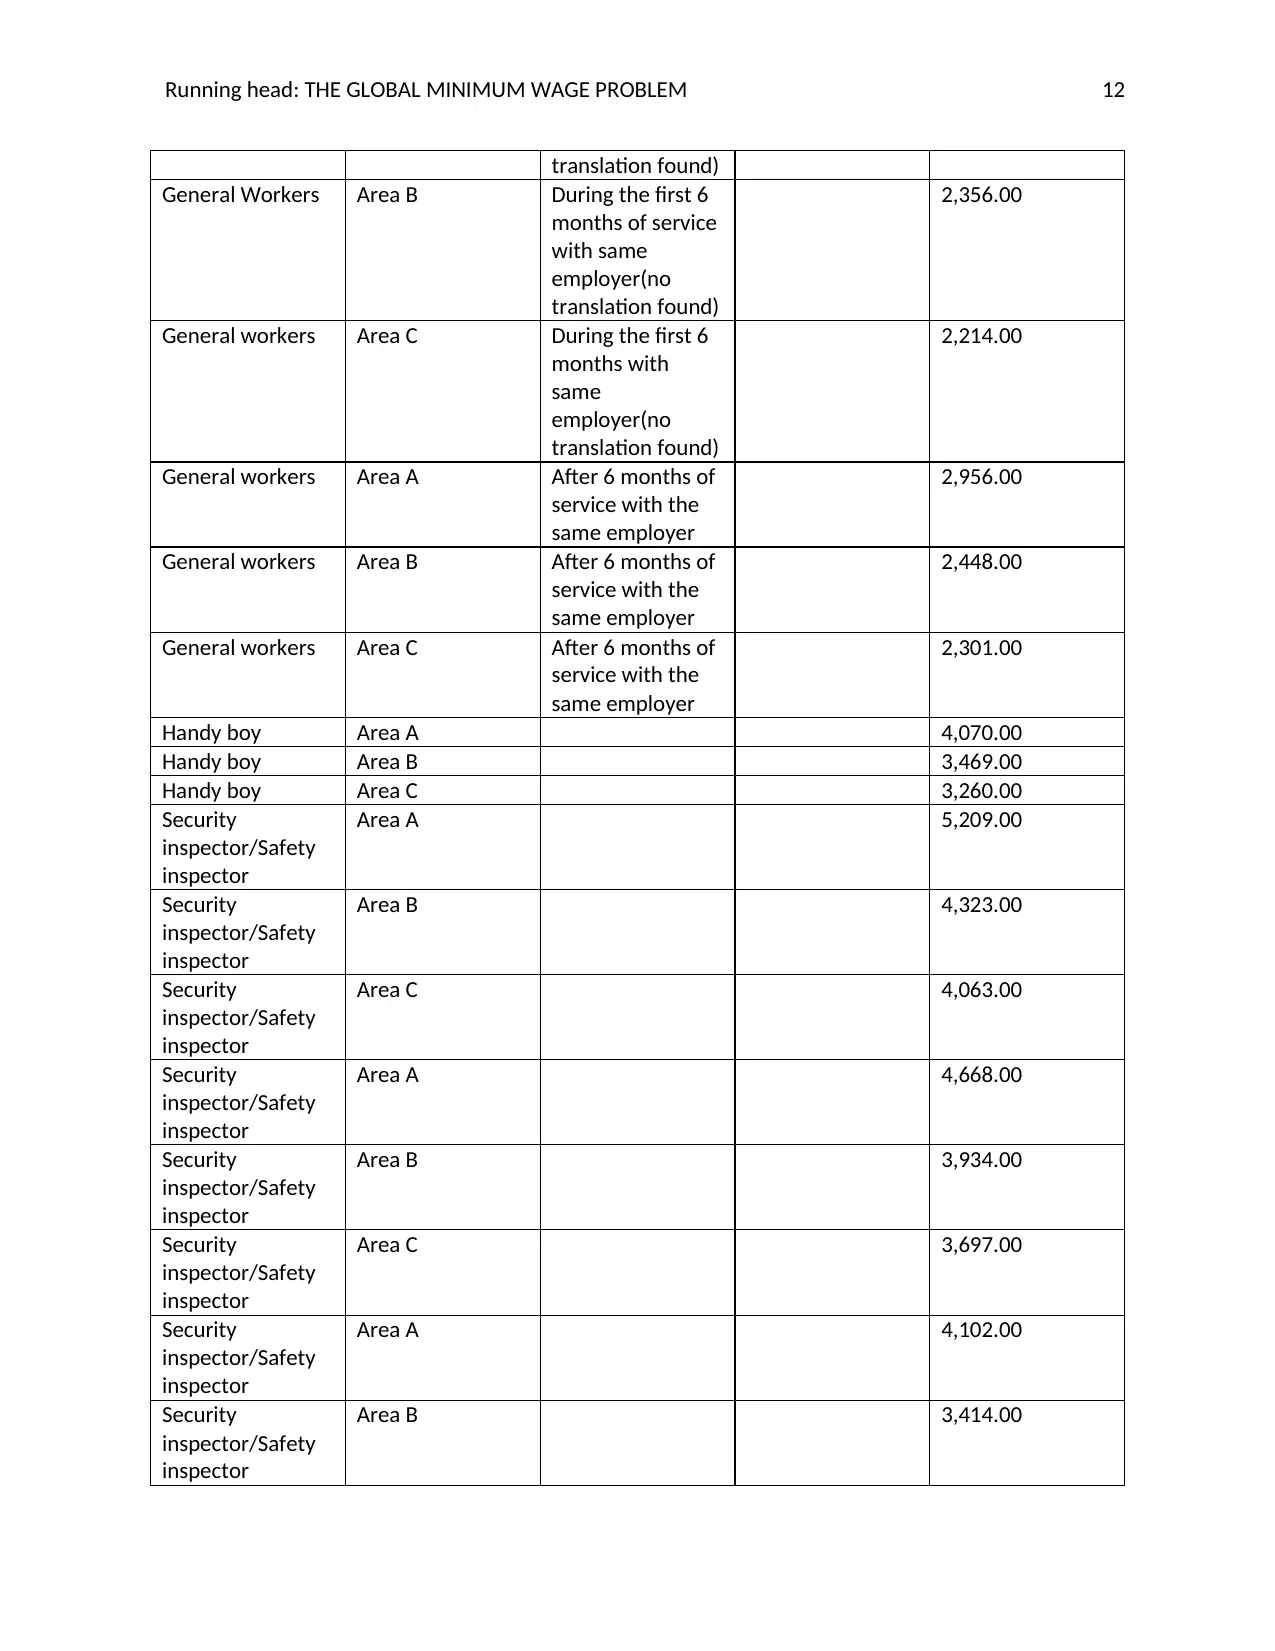
South Africa
The following is a summary of the South African minimum wage:
Job Type Region Tenure Minimum Wage
per Hour
Minimum Wage
per Month
Artisans Area A 7,014.00
Artisans Area B 6,124.00
Artisans Area C 5,756.00
Clerical assistant Area A 0<1 3,496.00
Clerical assistant Area B 0<1 2,899.00
Clerical assistant Area C 0<1 2,725.00
Clerical Assistant Area A 2 or more 3,554.00
Clerical Assistant Area B 2 or more 2,941.00
Clerical Assistant Area C 2 0r more 2,764.00
Clerical Assistant Area A 3 or more 3,608.00
Clerical Assistant Area B 3 or more 3,005.00
Clerical Assistant Area C 3 or more 2,824.00
Driver of a light
motor vehicle
Area A 3,679.00
Driver of a light
motor vehicle
Area B 3,085.00
Driver of a light
motor vehicle
Area C 2,899.00
Driver of a
medium motor
vehicle
Area A 3,943.00
Driver of a
medium motor
vehicle
Area B 3,323.00
Driver of a
medium motor
vehicle
Area C 3,123.00
Driver of a heavy
motor vehicle
Area A 4,116.00
Driver of a heavy
motor vehicle
Area B 3,477.00
Driver of a heavy
motor vehicle
Area C 3,268.00
General Workers Area A During the first 6
months of service
with same
employer (no
2,861.00
From the table above, Central Africa leads in Minimum Wage levels while East Africa lags. Higher income
countries have a higher minimum wage compared to low income economies.
South Africa
The following is a summary of the South African minimum wage:
Job Type Region Tenure Minimum Wage
per Hour
Minimum Wage
per Month
Artisans Area A 7,014.00
Artisans Area B 6,124.00
Artisans Area C 5,756.00
Clerical assistant Area A 0<1 3,496.00
Clerical assistant Area B 0<1 2,899.00
Clerical assistant Area C 0<1 2,725.00
Clerical Assistant Area A 2 or more 3,554.00
Clerical Assistant Area B 2 or more 2,941.00
Clerical Assistant Area C 2 0r more 2,764.00
Clerical Assistant Area A 3 or more 3,608.00
Clerical Assistant Area B 3 or more 3,005.00
Clerical Assistant Area C 3 or more 2,824.00
Driver of a light
motor vehicle
Area A 3,679.00
Driver of a light
motor vehicle
Area B 3,085.00
Driver of a light
motor vehicle
Area C 2,899.00
Driver of a
medium motor
vehicle
Area A 3,943.00
Driver of a
medium motor
vehicle
Area B 3,323.00
Driver of a
medium motor
vehicle
Area C 3,123.00
Driver of a heavy
motor vehicle
Area A 4,116.00
Driver of a heavy
motor vehicle
Area B 3,477.00
Driver of a heavy
motor vehicle
Area C 3,268.00
General Workers Area A During the first 6
months of service
with same
employer (no
2,861.00
Running head: THE GLOBAL MINIMUM WAGE PROBLEM 12
translation found)
General Workers Area B During the first 6
months of service
with same
employer(no
translation found)
2,356.00
General workers Area C During the first 6
months with
same
employer(no
translation found)
2,214.00
General workers Area A After 6 months of
service with the
same employer
2,956.00
General workers Area B After 6 months of
service with the
same employer
2,448.00
General workers Area C After 6 months of
service with the
same employer
2,301.00
Handy boy Area A 4,070.00
Handy boy Area B 3,469.00
Handy boy Area C 3,260.00
Security
inspector/Safety
inspector
Area A 5,209.00
Security
inspector/Safety
inspector
Area B 4,323.00
Security
inspector/Safety
inspector
Area C 4,063.00
Security
inspector/Safety
inspector
Area A 4,668.00
Security
inspector/Safety
inspector
Area B 3,934.00
Security
inspector/Safety
inspector
Area C 3,697.00
Security
inspector/Safety
inspector
Area A 4,102.00
Security
inspector/Safety
inspector
Area B 3,414.00
translation found)
General Workers Area B During the first 6
months of service
with same
employer(no
translation found)
2,356.00
General workers Area C During the first 6
months with
same
employer(no
translation found)
2,214.00
General workers Area A After 6 months of
service with the
same employer
2,956.00
General workers Area B After 6 months of
service with the
same employer
2,448.00
General workers Area C After 6 months of
service with the
same employer
2,301.00
Handy boy Area A 4,070.00
Handy boy Area B 3,469.00
Handy boy Area C 3,260.00
Security
inspector/Safety
inspector
Area A 5,209.00
Security
inspector/Safety
inspector
Area B 4,323.00
Security
inspector/Safety
inspector
Area C 4,063.00
Security
inspector/Safety
inspector
Area A 4,668.00
Security
inspector/Safety
inspector
Area B 3,934.00
Security
inspector/Safety
inspector
Area C 3,697.00
Security
inspector/Safety
inspector
Area A 4,102.00
Security
inspector/Safety
inspector
Area B 3,414.00
⊘ This is a preview!⊘
Do you want full access?
Subscribe today to unlock all pages.
Trusted by 1+ million students worldwide
1 out of 16
Related Documents


Your All-in-One AI-Powered Toolkit for Academic Success.
+13062052269
info@desklib.com
Available 24*7 on WhatsApp / Email
![[object Object]](/_next/static/media/star-bottom.7253800d.svg)
Unlock your academic potential
Copyright © 2020–2026 A2Z Services. All Rights Reserved. Developed and managed by ZUCOL.