Financial Analysis and Loan Recommendation for Mirvac Group Expansion
VerifiedAdded on 2020/07/23
|14
|3154
|279
Report
AI Summary
This report provides a comprehensive financial analysis of Mirvac Group's loan proposal to Westpac for a $250 million expansion project. It begins with an overview of Mirvac Group, an Australian publicly listed real estate company, and its integrated property business model. The analysis delves into profitability, liquidity, and solvency, comparing Mirvac's performance to competitors like Finbar Group and Lendlease Group. The report assesses Mirvac's financial health, including debt-to-equity ratio, borrowing costs, and cash flow management. It then examines Westpac's loan policy, pricing model, and security requirements, emphasizing the need for collateral. The report concludes with recommendations for Mirvac to secure the loan, focusing on improving its interest burden capacity, providing collateral, and implementing sound cash flow management strategies. The report highlights key financial metrics, lending policies, and potential risks associated with the loan.

Assessment Task
Paraphrase This Document
Need a fresh take? Get an instant paraphrase of this document with our AI Paraphraser
Table of Contents
Overview of the borrower............................................................................................................3
Financial analysis.........................................................................................................................3
Security........................................................................................................................................7
Loan Policy..................................................................................................................................7
Pricing Model...............................................................................................................................8
Recommendations........................................................................................................................8
REFERENCES..............................................................................................................................10
APPENDIX....................................................................................................................................12
Appendix: 1 Security analysis....................................................................................................12
Appendix: 2: Financial analysis.................................................................................................12
Appendix: 3: Projected statements.............................................................................................13
Overview of the borrower
Mirvac Group is Australian leading publicly listed company on ASX headquartered in
Sydney NSW, Australia. It was established in the year 1972 and operates in real estate industry.
It is an integrated property group which owns and manages number of assets across industrial,
retail and office sectors. Its key mission is to invest in vibrant cities considering well-connected
places for work, live and play. Along with the property development operations, it also invest in
hi-quality commercial assets and residential projects for their consumers so as to maximize long-
term value for security holders. Such integrated business approach of Mirvac provide it’s a
competitive benefit in creating and developing world class assets across project lifecycle from
planning to construction, leasing, development and property management (Mirvac Group Annual
report, 2017). Its integrated business model assures growth in its income through having a
balance of active & passive capital. with having an experience of 45 years, Mirvac is redefining
its presence in Australia through developing highly sustainable, well-connected and vibrant
urban environment for the society whether they can play, live, shop and work. It is extremely
committed towards innovation, sustainability, technological advancements and safety. In the year
2016, its urban strategy and well managed capital delivered successful results with $482m
operating profit (+6%, $455m in 2015) which got increased to $750m EBIT in FY 2017. Its
statutory profit increased from 1.03 bn to $1.16 bn and operating cash flow from $509m to
$513m. Currently, it employed more than 1,470 employees spreaded all around the world at a
sex ratio of 59:41. As per FY 2017, it has effectively managed its capital through lowering its
gearing (Pan, Wang and Weisbac, 2014). With the reduction in debt composition which will be
due in one year, its weight average debt maturity increased by 6.2 years, whilst, average
borrowing cost came down to 4.8% from 5%. Its 2017 year annual report presented revenue of
$2,275m at a total long-term borrowing of $2,765m. Currently, it is looking for expansion for
which it requires loan borrowing of AUD 250m.
Financial analysis
Profitability analysis
⊘ This is a preview!⊘
Do you want full access?
Subscribe today to unlock all pages.
Trusted by 1+ million students worldwide
2013 2014 2015 2016 2017
9.49%
24.37%
32.59% 35.53%
49.87%
22.46%
13.00%
27.66%
8.49%
4.03%4.45% 5.85% 4.58% 4.55% 4.51%
Net profit ratio
Mirvac Group Finbar Group LendLease Group
2013 2014 2015 2016 2017
14.33%
37.95% 41.35%
49.33%
44.34%
30.43%
20.94%
31.91%
9.43% 8.06%8.06% 5.08% 7.41% 6.41% 6.26%
Operating profit ratio
Mirvac Group Finbar Group LendLease Group
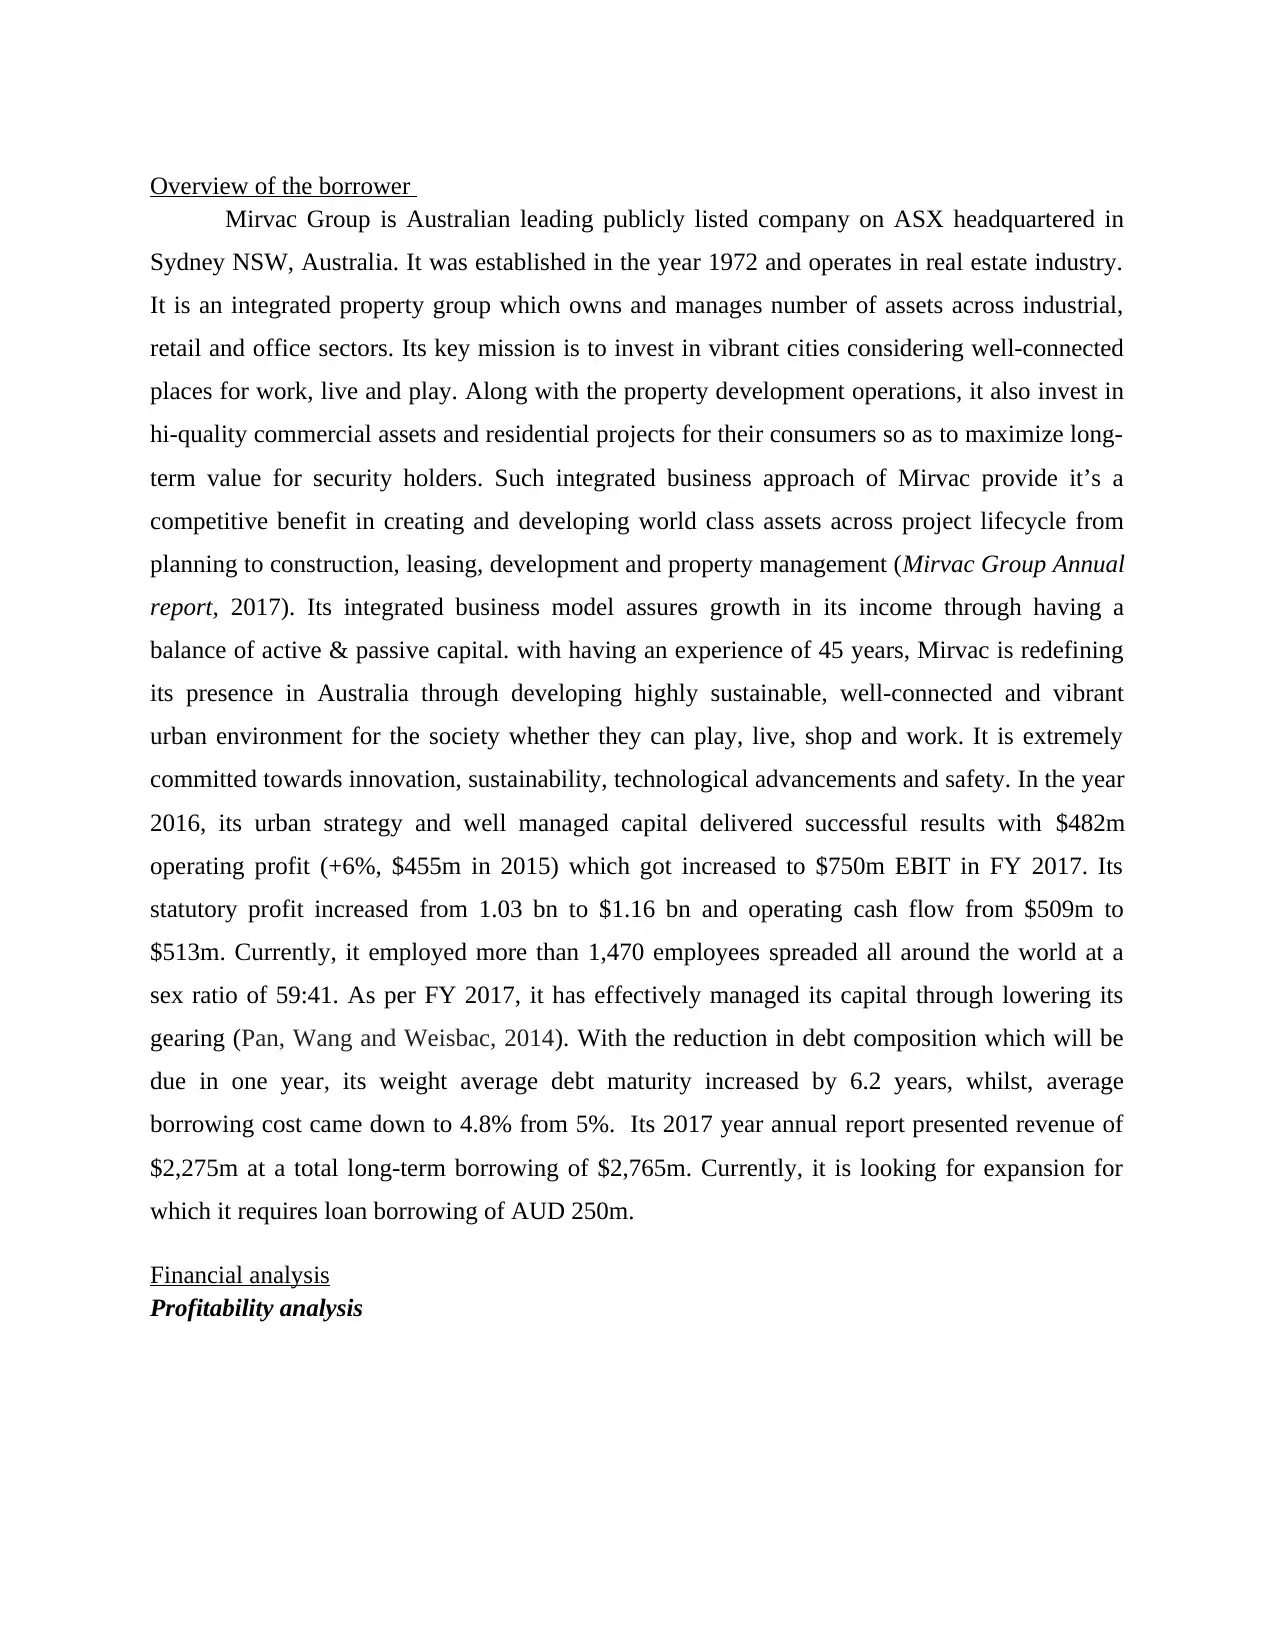
According to the results, it is clear that Mirvac Group has generated increased operating
return till the end of 2016, while in latest year, it dropped down to $1035m at a operating margin
of 44.34%, still, it is significantly higher than that of competitors operating return @ 8.06%
(Finbar Group ) and 6.10% (LendLease Group) (LendLease Group Ltd, 2017). Good increase in
the revenue from $1465m to $2907m by 2016 is the result behind higher operating return
whereas in FY 2017, it came down to $2,334m due to decline in revenue from development
operations from $1,654m to $1605m, still, it accounted major contribution.
9.49%
24.37%
32.59% 35.53%
49.87%
22.46%
13.00%
27.66%
8.49%
4.03%4.45% 5.85% 4.58% 4.55% 4.51%
Net profit ratio
Mirvac Group Finbar Group LendLease Group
2013 2014 2015 2016 2017
14.33%
37.95% 41.35%
49.33%
44.34%
30.43%
20.94%
31.91%
9.43% 8.06%8.06% 5.08% 7.41% 6.41% 6.26%
Operating profit ratio
Mirvac Group Finbar Group LendLease Group
According to the results, it is clear that Mirvac Group has generated increased operating
return till the end of 2016, while in latest year, it dropped down to $1035m at a operating margin
of 44.34%, still, it is significantly higher than that of competitors operating return @ 8.06%
(Finbar Group ) and 6.10% (LendLease Group) (LendLease Group Ltd, 2017). Good increase in
the revenue from $1465m to $2907m by 2016 is the result behind higher operating return
whereas in FY 2017, it came down to $2,334m due to decline in revenue from development
operations from $1,654m to $1605m, still, it accounted major contribution.
Paraphrase This Document
Need a fresh take? Get an instant paraphrase of this document with our AI Paraphraser
Although decline in sales lower down its operational return, still, good control of the
mangers over their indirect overheads resultant good net return worth $1,164m at a net margin of
49.87% which was 35.53% in FY 2016. The result of net profit shows a sudden increase from
9.49% to 49.87% in FY 2017 and also it is extremely higher in comparison to the rivalry
organizations, Finbar and LendLease Group who are earning a net return of 4.03% and 4.51%.
Firm has maintained strong control over its variable costs i.e. through using direct seeding
planting technique rather than tube stock planting; firm became able to manage cost efficiency
and generated greater return. As per FY 2017, it had achieved saving worth $2.8m and thereby
meet budgetary targets to 85%. It reduced its borrowing costs to 4.8% and minimized occupancy
cost from 15.3% to 15% (Tumwine and et.al., 2015). Besides this, recycling strategy for waste
management and efficient use of resources with optimum allocation helped it to maximize its net
return. However, increasing cost of house and living created pressure upon firm.
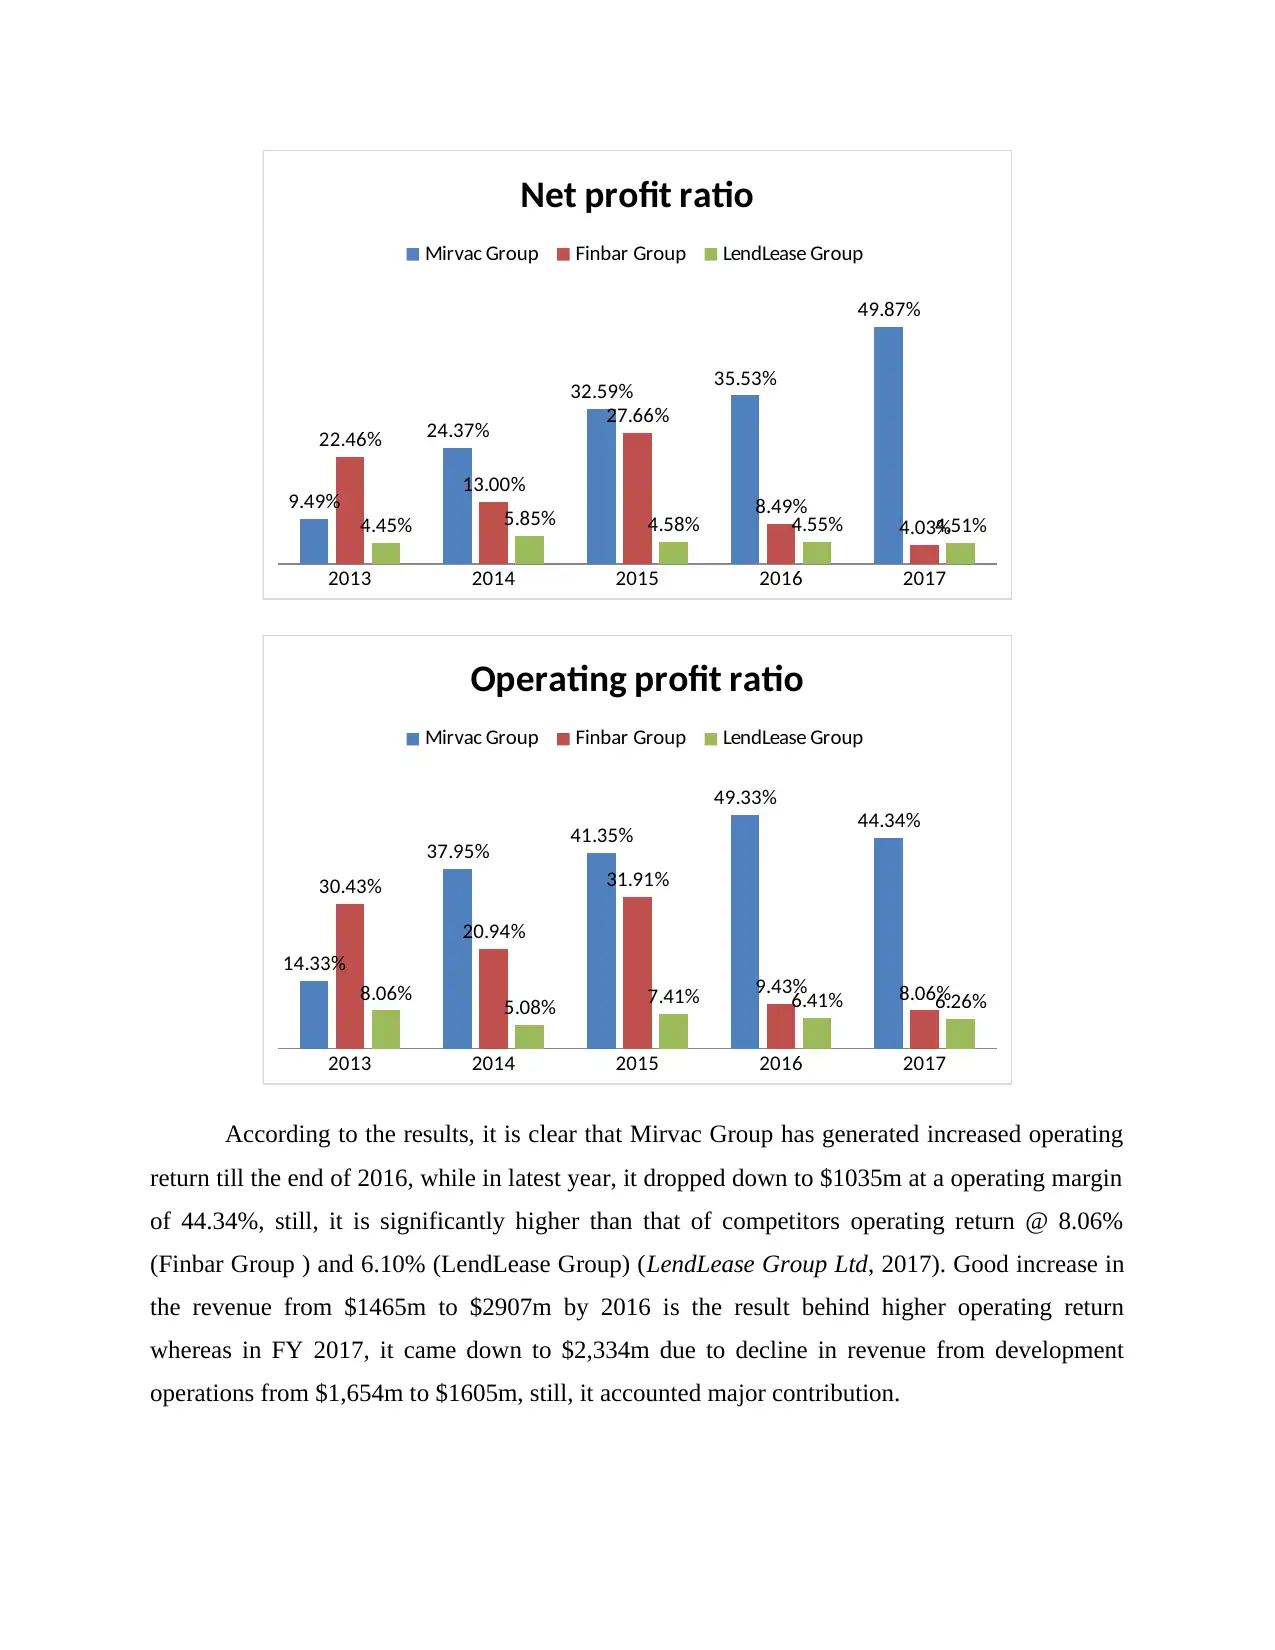
Liquidity Analysis
It is necessary for the Mirvac group to retain strong liquidity position otherwise; suppliers
will not be ready to supply required goods and services on favorable conditions.
2013 2014 2015 2016 2017
0.00
1.00
2.00
3.00
4.00
5.00
6.00
Current ratio
Mirvac Group’s CR improved from 0.98:1 to 1.09:1 which indicates good liquidity in the
business and comparatively, it is more than Finbar and Lendlease CR to 1.07 and 0.58. However,
firm still needs to improve its liquid sources to achieve idle ratio of 2:1. Similarly, its QR is also
mangers over their indirect overheads resultant good net return worth $1,164m at a net margin of
49.87% which was 35.53% in FY 2016. The result of net profit shows a sudden increase from
9.49% to 49.87% in FY 2017 and also it is extremely higher in comparison to the rivalry
organizations, Finbar and LendLease Group who are earning a net return of 4.03% and 4.51%.
Firm has maintained strong control over its variable costs i.e. through using direct seeding
planting technique rather than tube stock planting; firm became able to manage cost efficiency
and generated greater return. As per FY 2017, it had achieved saving worth $2.8m and thereby
meet budgetary targets to 85%. It reduced its borrowing costs to 4.8% and minimized occupancy
cost from 15.3% to 15% (Tumwine and et.al., 2015). Besides this, recycling strategy for waste
management and efficient use of resources with optimum allocation helped it to maximize its net
return. However, increasing cost of house and living created pressure upon firm.
Liquidity Analysis
It is necessary for the Mirvac group to retain strong liquidity position otherwise; suppliers
will not be ready to supply required goods and services on favorable conditions.
2013 2014 2015 2016 2017
0.00
1.00
2.00
3.00
4.00
5.00
6.00
Current ratio
Mirvac Group’s CR improved from 0.98:1 to 1.09:1 which indicates good liquidity in the
business and comparatively, it is more than Finbar and Lendlease CR to 1.07 and 0.58. However,
firm still needs to improve its liquid sources to achieve idle ratio of 2:1. Similarly, its QR is also
0.39:1 very less than standard ratio of 1:1 indicates ineffective liquidity management. In FY
2017, in order to minimize credit risk, it uses credit limit policy, obtain collateral from customers
and regularly monitor counterparty credit rating and payments (Mirvac Group Annual report,
2017). It regularly examine its cash availability, marketable securities and its ability to raise
funds through issuance of new securities.
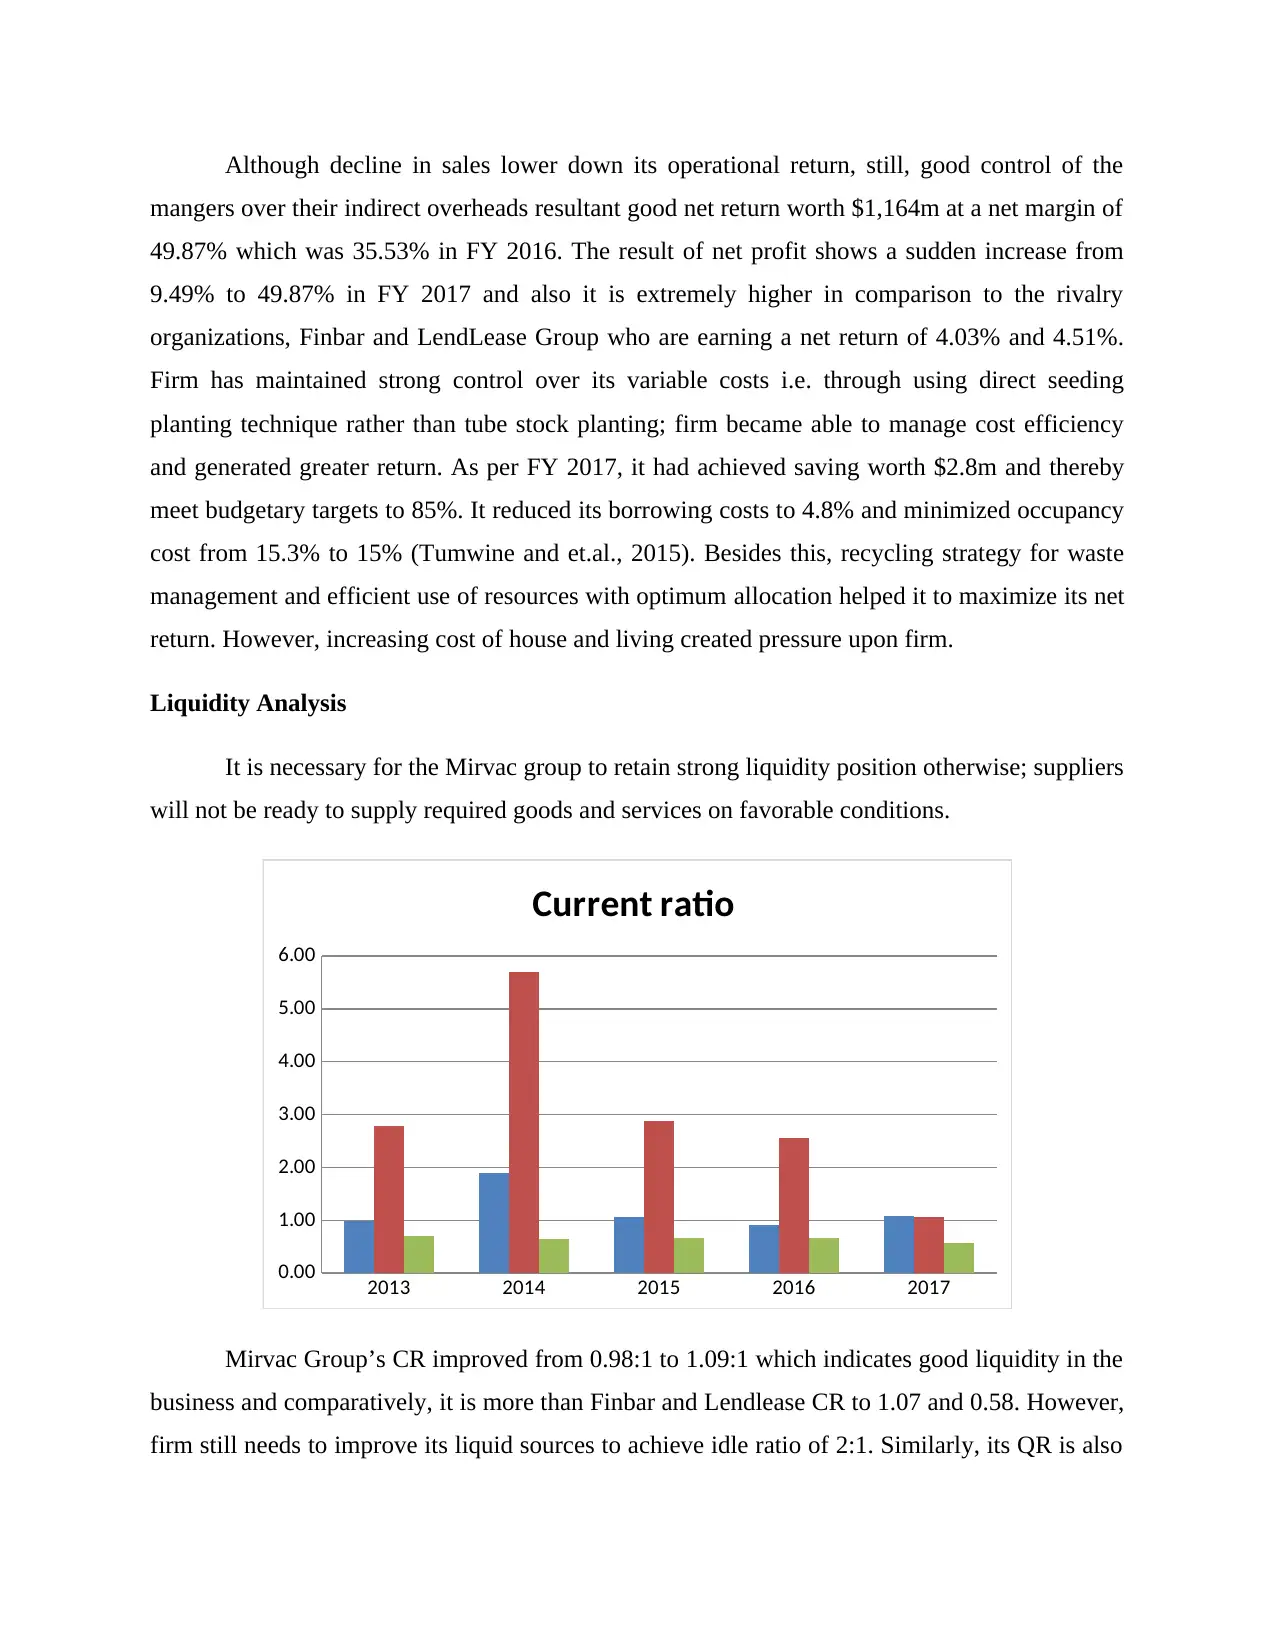
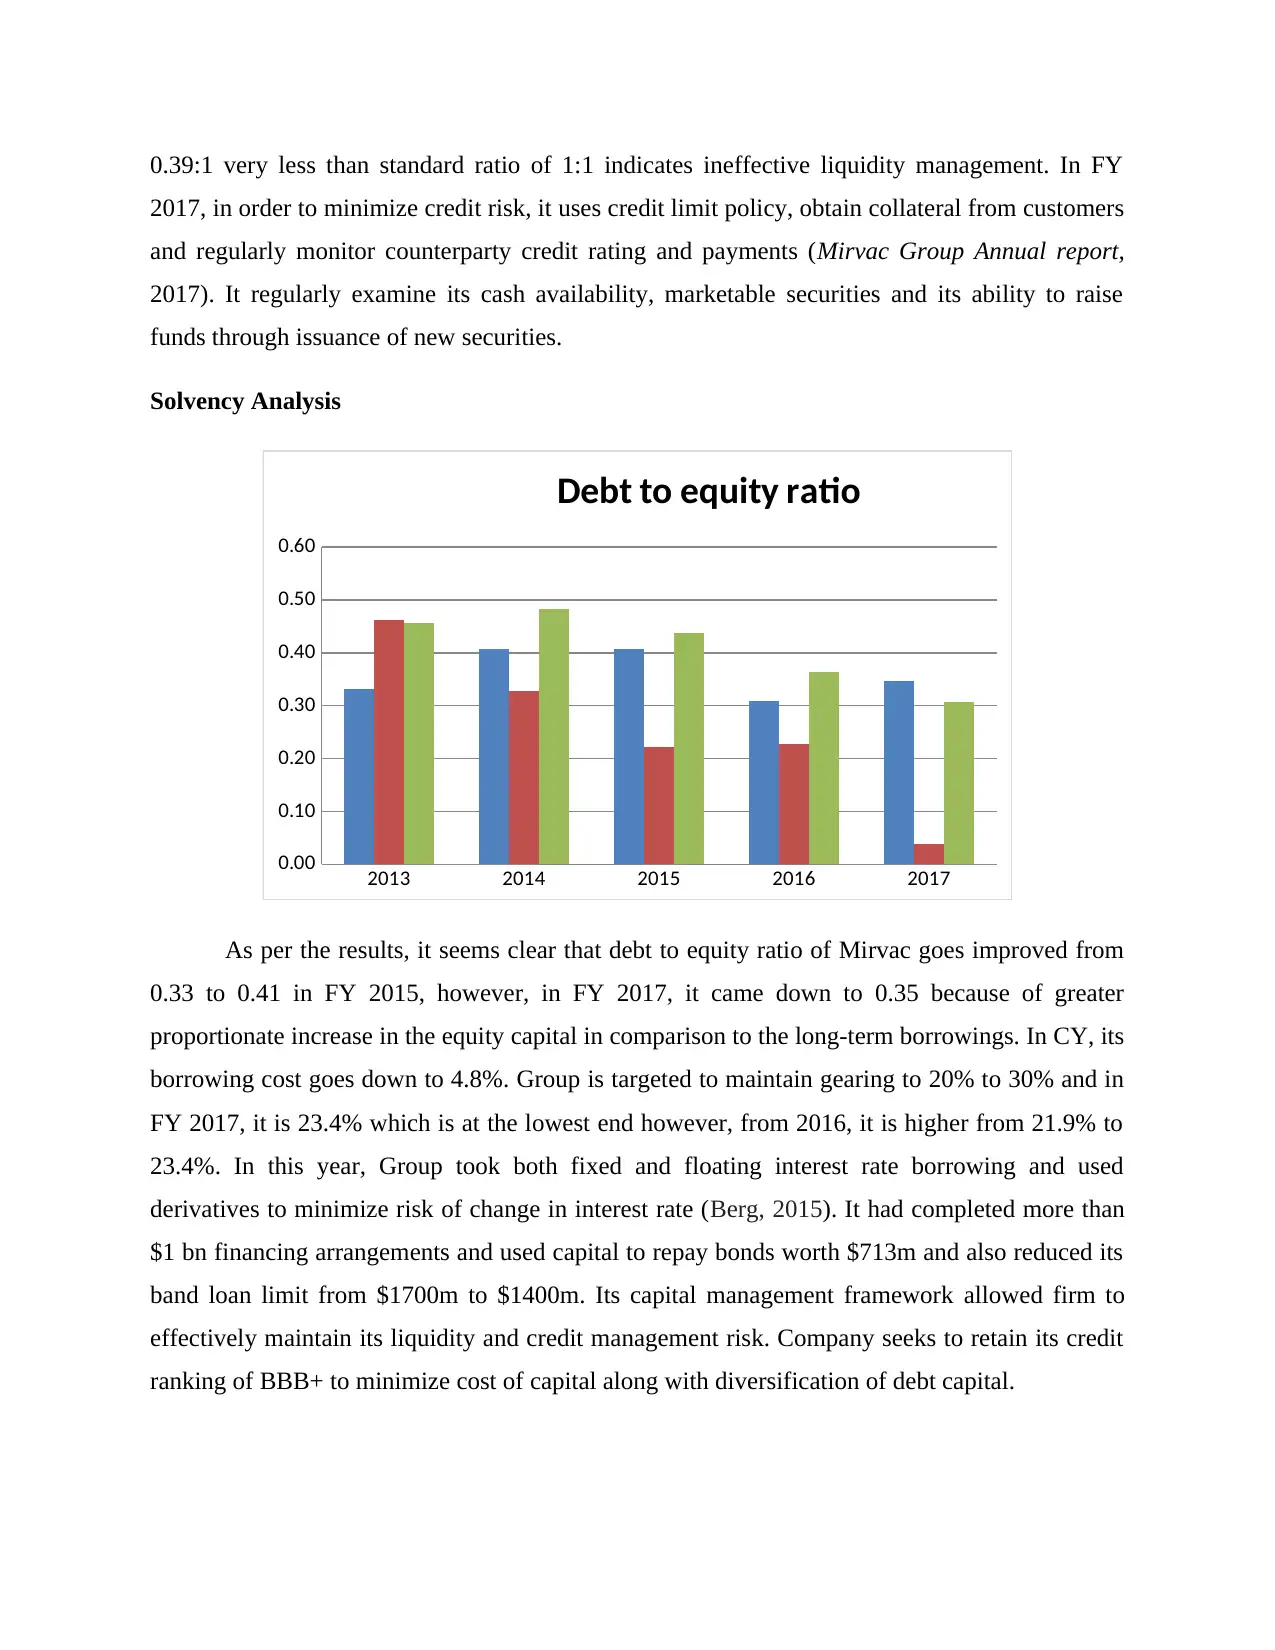
Solvency Analysis
2013 2014 2015 2016 2017
0.00
0.10
0.20
0.30
0.40
0.50
0.60
Debt to equity ratio
As per the results, it seems clear that debt to equity ratio of Mirvac goes improved from
0.33 to 0.41 in FY 2015, however, in FY 2017, it came down to 0.35 because of greater
proportionate increase in the equity capital in comparison to the long-term borrowings. In CY, its
borrowing cost goes down to 4.8%. Group is targeted to maintain gearing to 20% to 30% and in
FY 2017, it is 23.4% which is at the lowest end however, from 2016, it is higher from 21.9% to
23.4%. In this year, Group took both fixed and floating interest rate borrowing and used
derivatives to minimize risk of change in interest rate (Berg, 2015). It had completed more than
$1 bn financing arrangements and used capital to repay bonds worth $713m and also reduced its
band loan limit from $1700m to $1400m. Its capital management framework allowed firm to
effectively maintain its liquidity and credit management risk. Company seeks to retain its credit
ranking of BBB+ to minimize cost of capital along with diversification of debt capital.
2017, in order to minimize credit risk, it uses credit limit policy, obtain collateral from customers
and regularly monitor counterparty credit rating and payments (Mirvac Group Annual report,
2017). It regularly examine its cash availability, marketable securities and its ability to raise
funds through issuance of new securities.
Solvency Analysis
2013 2014 2015 2016 2017
0.00
0.10
0.20
0.30
0.40
0.50
0.60
Debt to equity ratio
As per the results, it seems clear that debt to equity ratio of Mirvac goes improved from
0.33 to 0.41 in FY 2015, however, in FY 2017, it came down to 0.35 because of greater
proportionate increase in the equity capital in comparison to the long-term borrowings. In CY, its
borrowing cost goes down to 4.8%. Group is targeted to maintain gearing to 20% to 30% and in
FY 2017, it is 23.4% which is at the lowest end however, from 2016, it is higher from 21.9% to
23.4%. In this year, Group took both fixed and floating interest rate borrowing and used
derivatives to minimize risk of change in interest rate (Berg, 2015). It had completed more than
$1 bn financing arrangements and used capital to repay bonds worth $713m and also reduced its
band loan limit from $1700m to $1400m. Its capital management framework allowed firm to
effectively maintain its liquidity and credit management risk. Company seeks to retain its credit
ranking of BBB+ to minimize cost of capital along with diversification of debt capital.
⊘ This is a preview!⊘
Do you want full access?
Subscribe today to unlock all pages.
Trusted by 1+ million students worldwide
In contrast to this, Finbar’s debt to equity ratio shows a consistent decline from 0.46 to
0.04 times due to regular decline in debt capital and use of owners equity in the capital
composition (Finbar group Ltd, 2017). Although, it shows less financial burden, but, firm has no
tax benefits and also diluted control to the shareholders (Butler, Cornaggia and Gurun, 2016).
Similarly, Lendlease ratio decreased from 0.46 to 0.31 due to minimal debt use and higher equity
capital. Although in comparison to the rival firms, Mirvac’s Debt to equity ratio is more closer to
idle ratio of 0.50:1, still, decreased interest burden ratio from 5.23 to 3.19 resulted stated that
firm should not use more borrowing otherwise, it might face financial burden. In this year,
Mirbac complied all debt covenants requirement and committed to sell property or issue more
equity shares in order to repay its long-term borrowings.
Security
Mirvac Group reports its borrowing initially at fair value while subsequent reporting is
made using effective interest rate method and the difference between initial amount and
redemption is reported in SOCI. In FY 2017, firm’s balance sheet reported non-current
borrowing worth $2965m at a fair value of $2939m which all are unsecured (Halldórsson, Hsuan
and Kotzab, 2015). Thus, as per current security structure, none of the loan borrowing has been
secured by collateral. However, as company is looking for expanding its business and need to
borrow loan of $250m from Westapc, it will definitely need collateral security that needs to be
provided to the bank (Mirvac Group Ltd, 2017). Thus, it will be a main issue that firm needs to
arrange collateral. Besides this, more use of debt will help it to reach idle, still, declined interest
bearing ratio may have an adverse impact on receiving loan facilities from Westpac.
Loan Policy
Westpac Banking Corporation is an Australian Financial institution that is one of leading
commercial bank in Australia and engaged in financial, consumer banking, investment banking,
wealth management, mortgage, private equity and credit card operations. It imposed tougher
lending rules for the property developers to raise required capital through borrowings. In this
regards, initially, Westpac examine borrower’s payment ability, credit rating and others aspect to
assure that whether he or she is able or not to cope up with the high interest rate (Yeates, 2015).
It takes all the necessary actions and put regulatory efforts to prevent against possible risk of
overheating housing market. Before just two years, it had made changes in its lending policy and
maximize standard of 180 basis points to 210 basis points in order to respond Australian
Paraphrase This Document
Need a fresh take? Get an instant paraphrase of this document with our AI Paraphraser
Prudential Regulation Authority’s warning (Yeates, 2015). As per the policy, it is essential for
Mirvac Group to convince Westpac that it is able to pay loan at an interest rate floor of 7.1%
(earlier 5%), even if Reserve Bank of Australia cuts their official rate. Moreover, slow rate of
growth in credit rating also influence its lending decisions. Currently, its lending policy does not
grant any loan to the foreigners who are interesting in applying loan for purchase of residential
properties. Westpac take into account loan to value ratio as an indicator of financial risk while
granting loan. After a sharp slowdown in bank lending to the property investors, Westpac
maximized LVRs (Loan-to-valuation-ratio) from 80% to 90%. It clearly means that property
borrowers need to deposit 10% of property’s value which was earlier 20% indicates some
relaxation in lending decisions which assists borrowers to lend more money. However, at the
same time, in order to mitigate the risk of borrowers default in loan payment, it had tightened its
loan granting criteria. In March, its interest rate on loans has been grew to 7.2% (Yeates, 2016).
Under the lending policy, bank examine security, verification of income, borrowing history and
credit check to ensure that loan is granted to the party who is able to make payment on time.
As per the case study, Mirvac need $250m for prospective expansion project. According
to current lending rules, Westpac grant flexible loans to the businesses that are looking for
expansion and growth. Under this, minimum loan amount is $250,000 and grant loan facilities at
flexible conditions at loan amount above $1m (Westpac Commercial loans. n.d.). Considering
the lending policy, it becomes clear that Mirvac’s must follow such requirements and debt
covenant conditions to obtain loan worth $250m.
Pricing Model
Mirvac require borrowing of $250m for investing, thus, it will need to take loan for
longer-period above 5 year on which, WestPac charges fixed interest rate (base rate) @ 5.74%
and variable rate (base rate) of 6.43% per annum (WestPac Busines Loans Rates, 2017). In order
to manage risk due to floating interest rate, Mirvac must use interest rate derivatives which
protect the firm against sudden increase in the loan interest. Besides this, firm needs to put
tighten control over the expenditures that will derive maximum yield so that it will have
sufficient liquid in the form of cash available to meet its debt covenant obligations. In addition,
cash flow management strategies need to be prepared for having enough cash to meet out debt
interest obligation as per scheduled requirement and on time.
Recommendations
On the basis of the discussion, it becomes clear that in order to take more borrowing from
the loan, company is advised to maximize its interest burden capacity by maximizing its
revenues and control direct cost so that it will have higher operational profit. By providing
collateral and improving its interest bearing ratio, it will be able to satisfy Westpac lending
conditions and could borrow the capital. In addition to that, sound cash flow management plan
through strict monitoring and control will maintain higher cash resources and manage solvency
position.
⊘ This is a preview!⊘
Do you want full access?
Subscribe today to unlock all pages.
Trusted by 1+ million students worldwide
REFERENCES
Books and Journals
Berg, T., 2015. Playing the devil's advocate: The causal effect of risk management on loan
quality. The Review of Financial Studies.28(12). pp.3367-3406.
Butler, A. W., Cornaggia, J. and Gurun, U. G., 2016. Do Local Capital Market Conditions Affect
Consumers’ Borrowing Decisions?. Management Science.
Halldórsson, Á., Hsuan, J. and Kotzab, H., 2015. Complementary theories to supply chain
management revisited–from borrowing theories to theorizing. Supply Chain
Management: An International Journal. 20(6). pp.574-586.
Pan, Y., Wang, T. Y. and Weisbach, M. S., 2014. Does Uncertainty about Management Affect
Firms’ Costs of Borrowing? (No. w20674). National Bureau of Economic Research.
Tumwine, S. and et.al., 2015. A borrowing cost model for effective performance of SMEs in
Uganda. World Journal of Entrepreneurship, Management and Sustainable Development.
11(2). pp.74-89.
Online
Finbar group Ltd. 2017. [Online]. Available through:
https://markets.ft.com/data/equities/tearsheet/financials?
s=FRI:ASX&subview=BalanceSheet. [Accessed on 2nd October 2017].
LendLease Group Ltd. 2017. [Online]. Available through:
https://markets.ft.com/data/equities/tearsheet/financials?
s=LLC:ASX&subview=BalanceSheet>. [Accessed on 2nd October 2017].
Mirvac Group Annual report. 2017. [PDF]. Available through: <
http://groupir.mirvac.com/icms_docs/272505_MGR_-_FY17_Annual_Report.pdf>.
[Accessed on 2nd October 2017].
Mirvac Group Ltd. 2017. [Online]. Available through:
https://markets.ft.com/data/equities/tearsheet/financials?
s=MGR:ASX&subview=BalanceSheet. [Accessed on 2nd October 2017].
Paraphrase This Document
Need a fresh take? Get an instant paraphrase of this document with our AI Paraphraser
WestPac Busines Loans Rates. 2017. [Online]. Available through:
https://www.westpac.com.au/business-banking/business-loans/business-loans-interest-
rate/. [Accessed on 2nd October 2017].
Westpac Commercial loans. n.d. [Online]. Available through:
https://www.westpac.com.au/business-banking/business-loans/commercial-loans/.
[Accessed on 3rd October 2017].
Yeates, C., 2015. Westpac imposes tougher borrowing rules on property investors.
[Online]. Available through: < http://www.smh.com.au/business/banking-and-
finance/westpac-imposes-tougher-borrowing-rules-on-property-investors-
20150504-ggtq3e.html>. [Accessed on 2nd October 2017].
Yeates, C., 2016. WestPac Lower hurdle for property investors. [Online]. Available
through: <http://www.smh.com.au/business/banking-and-finance/westpac-lowers-
deposit-hurdle-for-property-investors-20160523-gp1i2c.html>. [Accessed on 3rd
October 2017].
APPENDIX
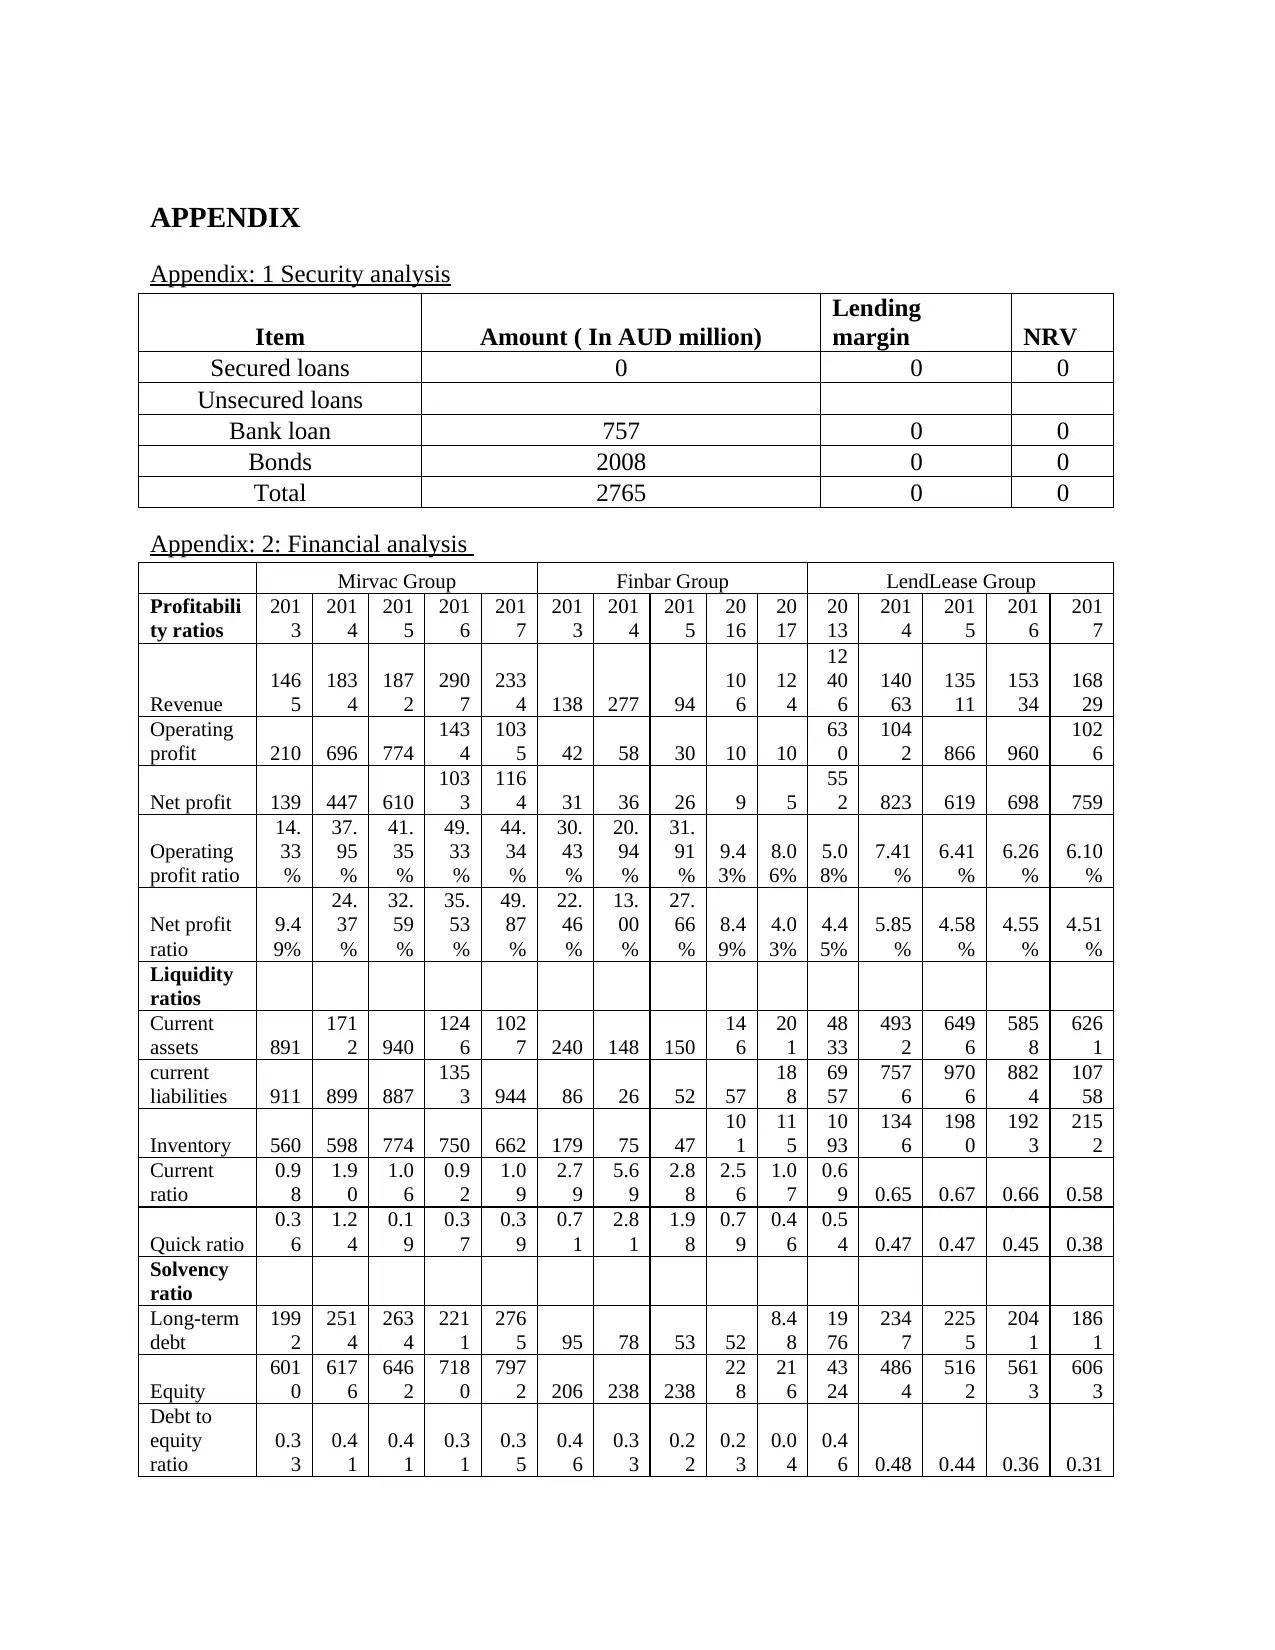
Appendix: 1 Security analysis
Item Amount ( In AUD million)
Lending
margin NRV
Secured loans 0 0 0
Unsecured loans
Bank loan 757 0 0
Bonds 2008 0 0
Total 2765 0 0
Appendix: 2: Financial analysis
Mirvac Group Finbar Group LendLease Group
Profitabili
ty ratios
201
3
201
4
201
5
201
6
201
7
201
3
201
4
201
5
20
16
20
17
20
13
201
4
201
5
201
6
201
7
Revenue
146
5
183
4
187
2
290
7
233
4 138 277 94
10
6
12
4
12
40
6
140
63
135
11
153
34
168
29
Operating
profit 210 696 774
143
4
103
5 42 58 30 10 10
63
0
104
2 866 960
102
6
Net profit 139 447 610
103
3
116
4 31 36 26 9 5
55
2 823 619 698 759
Operating
profit ratio
14.
33
%
37.
95
%
41.
35
%
49.
33
%
44.
34
%
30.
43
%
20.
94
%
31.
91
%
9.4
3%
8.0
6%
5.0
8%
7.41
%
6.41
%
6.26
%
6.10
%
Net profit
ratio
9.4
9%
24.
37
%
32.
59
%
35.
53
%
49.
87
%
22.
46
%
13.
00
%
27.
66
%
8.4
9%
4.0
3%
4.4
5%
5.85
%
4.58
%
4.55
%
4.51
%
Liquidity
ratios
Current
assets 891
171
2 940
124
6
102
7 240 148 150
14
6
20
1
48
33
493
2
649
6
585
8
626
1
current
liabilities 911 899 887
135
3 944 86 26 52 57
18
8
69
57
757
6
970
6
882
4
107
58
Inventory 560 598 774 750 662 179 75 47
10
1
11
5
10
93
134
6
198
0
192
3
215
2
Current
ratio
0.9
8
1.9
0
1.0
6
0.9
2
1.0
9
2.7
9
5.6
9
2.8
8
2.5
6
1.0
7
0.6
9 0.65 0.67 0.66 0.58
Quick ratio
0.3
6
1.2
4
0.1
9
0.3
7
0.3
9
0.7
1
2.8
1
1.9
8
0.7
9
0.4
6
0.5
4 0.47 0.47 0.45 0.38
Solvency
ratio
Long-term
debt
199
2
251
4
263
4
221
1
276
5 95 78 53 52
8.4
8
19
76
234
7
225
5
204
1
186
1
Equity
601
0
617
6
646
2
718
0
797
2 206 238 238
22
8
21
6
43
24
486
4
516
2
561
3
606
3
Debt to
equity
ratio
0.3
3
0.4
1
0.4
1
0.3
1
0.3
5
0.4
6
0.3
3
0.2
2
0.2
3
0.0
4
0.4
6 0.48 0.44 0.36 0.31
⊘ This is a preview!⊘
Do you want full access?
Subscribe today to unlock all pages.
Trusted by 1+ million students worldwide
1 out of 14
Related Documents


Your All-in-One AI-Powered Toolkit for Academic Success.
+13062052269
info@desklib.com
Available 24*7 on WhatsApp / Email
![[object Object]](/_next/static/media/star-bottom.7253800d.svg)
Unlock your academic potential
Copyright © 2020–2026 A2Z Services. All Rights Reserved. Developed and managed by ZUCOL.