University Data Analysis: MIS771 Descriptive Analytics Report, 2019
VerifiedAdded on 2023/01/11
|13
|2387
|34
Report
AI Summary
This report presents an analysis of smartphone user data, focusing on a dataset of 150 users. The study begins with an overview of monthly bill amounts, calculating the average, median, and confidence intervals. It then builds a profile of a typical smartphone user, examining the percentage of smartphone use for work-related activities and the distribution of users across different geo tribes. The report further explores specific questions through hypothesis testing, including whether the average monthly bill has dropped below a certain threshold, the validity of satisfaction claims, and the existence of gender-based differences in service provider perceptions. Additionally, the analysis investigates the relationship between payment device usage, online purchase behavior, and social media engagement with monthly bill amounts. The findings reveal insights into user behavior and validate or refute previous industry assumptions, offering a comprehensive understanding of smartphone usage patterns.
MIS771 Descriptive Analytics and Visualisation
Name of the Student
Name of the University
Author note
Name of the Student
Name of the University
Author note
Paraphrase This Document
Need a fresh take? Get an instant paraphrase of this document with our AI Paraphraser
Table of Contents
1.0 Introduction..........................................................................................................................3
2.0 Discussion............................................................................................................................3
Question 1:.............................................................................................................................3
Question 2:.............................................................................................................................3
Question 3:.............................................................................................................................3
Part a:.................................................................................................................................3
Part b:.................................................................................................................................3
Part c:.................................................................................................................................4
Part d:.................................................................................................................................4
Part e:.................................................................................................................................4
Question 4:.............................................................................................................................4
Part a:.................................................................................................................................4
Part b:.................................................................................................................................4
3.0 Conclusion............................................................................................................................4
Bibliography...............................................................................................................................5
Appendices.................................................................................................................................6
1.0 Introduction
Considering the steady incremental rate of number of smartphone users across globe,
business entities have started concentrating on the business opportunity generates from this
large pool of smartphone users. Evaluation of specific information like how the users are
utilizing their smartphone can give significant mileage not only to reach maximum customer
base but also to enhance their marketing strategy and the overall operation at the end. There
are several researches have already been conducted and a number of conclusions have
already been concluded basis which business entities are making changes at their tactical
level.
This specific study is performed to replicate the similar study by analysing a given set of
information. As per given information, 150 users information have been utilised to perform a
series of tests which have been discussed throughout the next section of this report.
2.0 Discussion
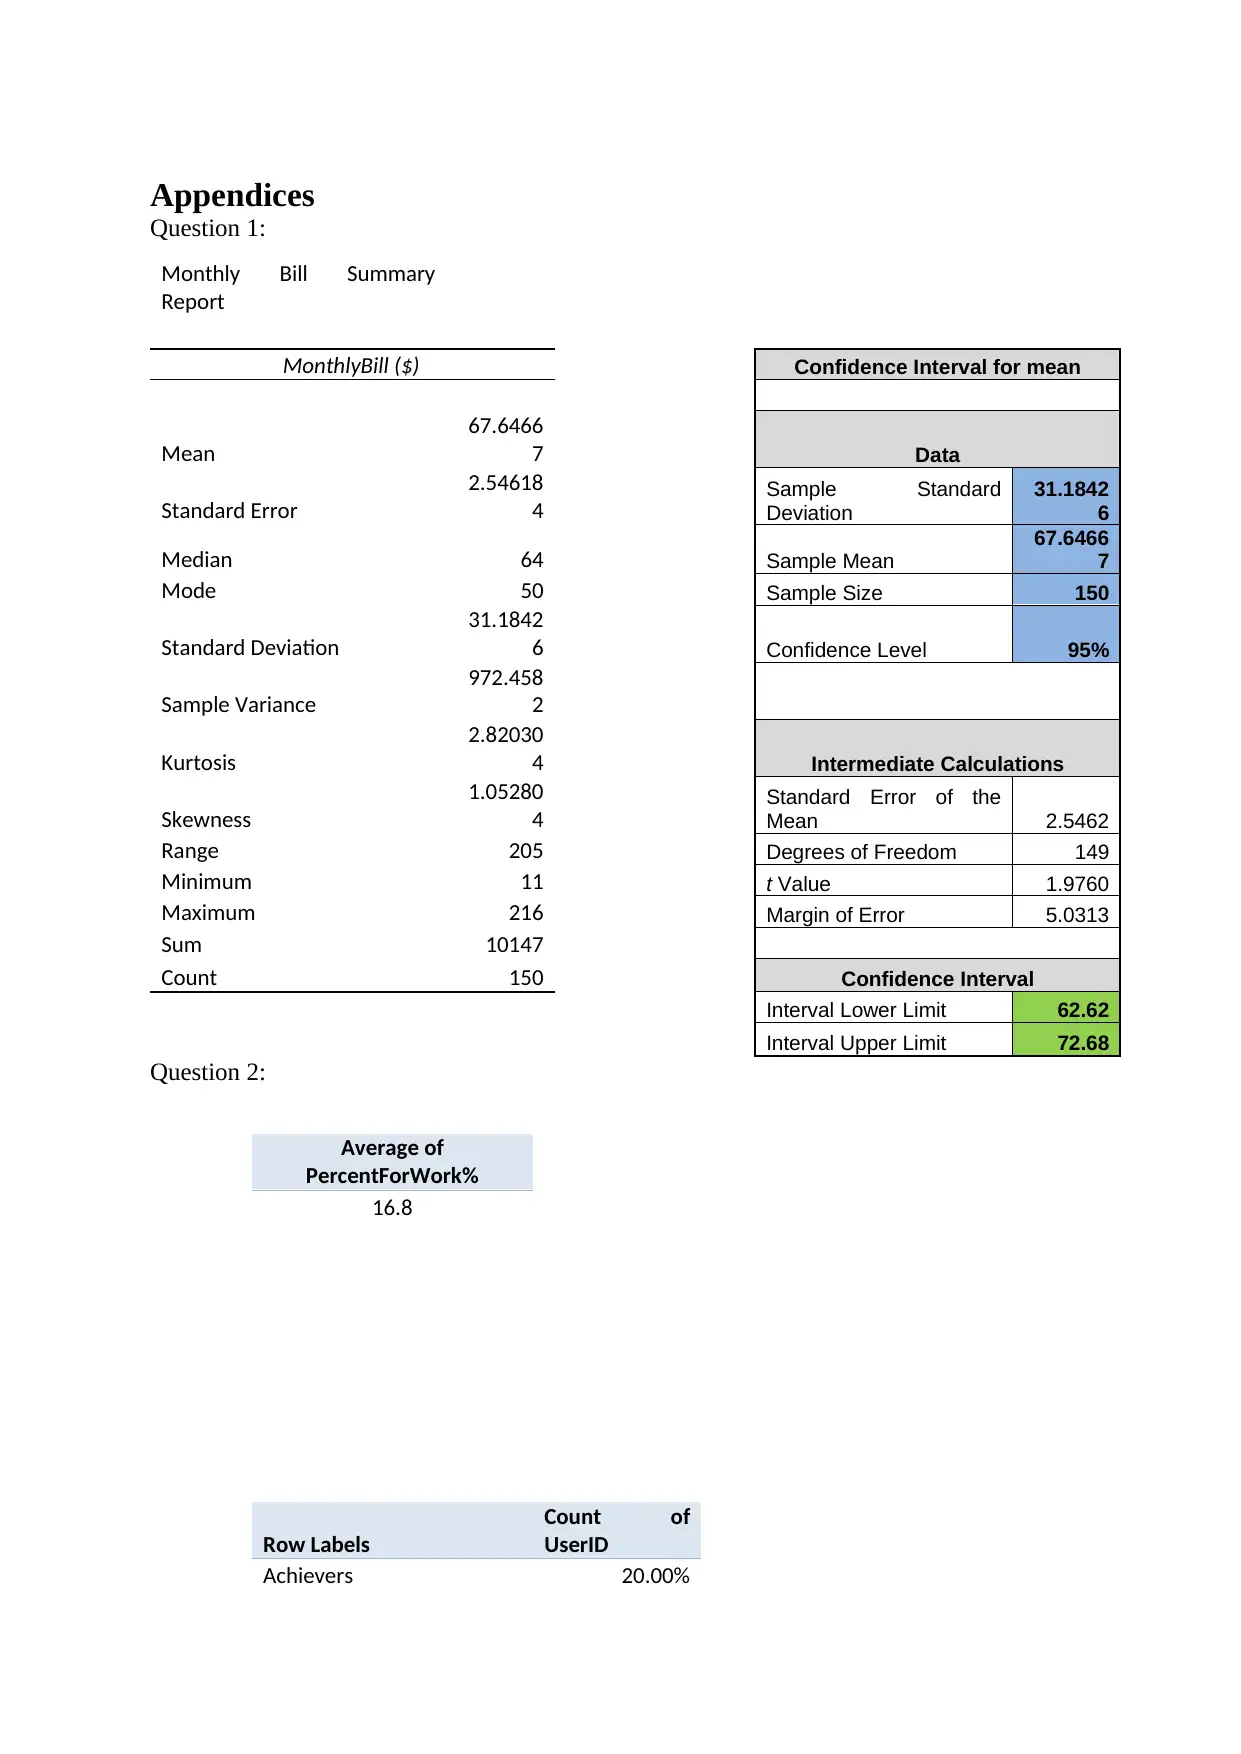
Question 1:
The first question was all about overall summary of monthly bill amount of 150 smart phone
users. With reference to the appendix [question 1], it can be said that on an average, the
chosen users have spent $67.65 per month. Not only has that, the study also reveals that half
of the users have spent above $64 per month. Again, the analysis further explains there is a
95% chance that the average monthly bill amount of the selected users remains in between
$62.62 and $72.78. Finally, the data can show that one the users have spent $216 per month,
which is the highest monthly bill amount and one of the users have spent $11, which is the
lowest monthly bill amount.
Question 2:
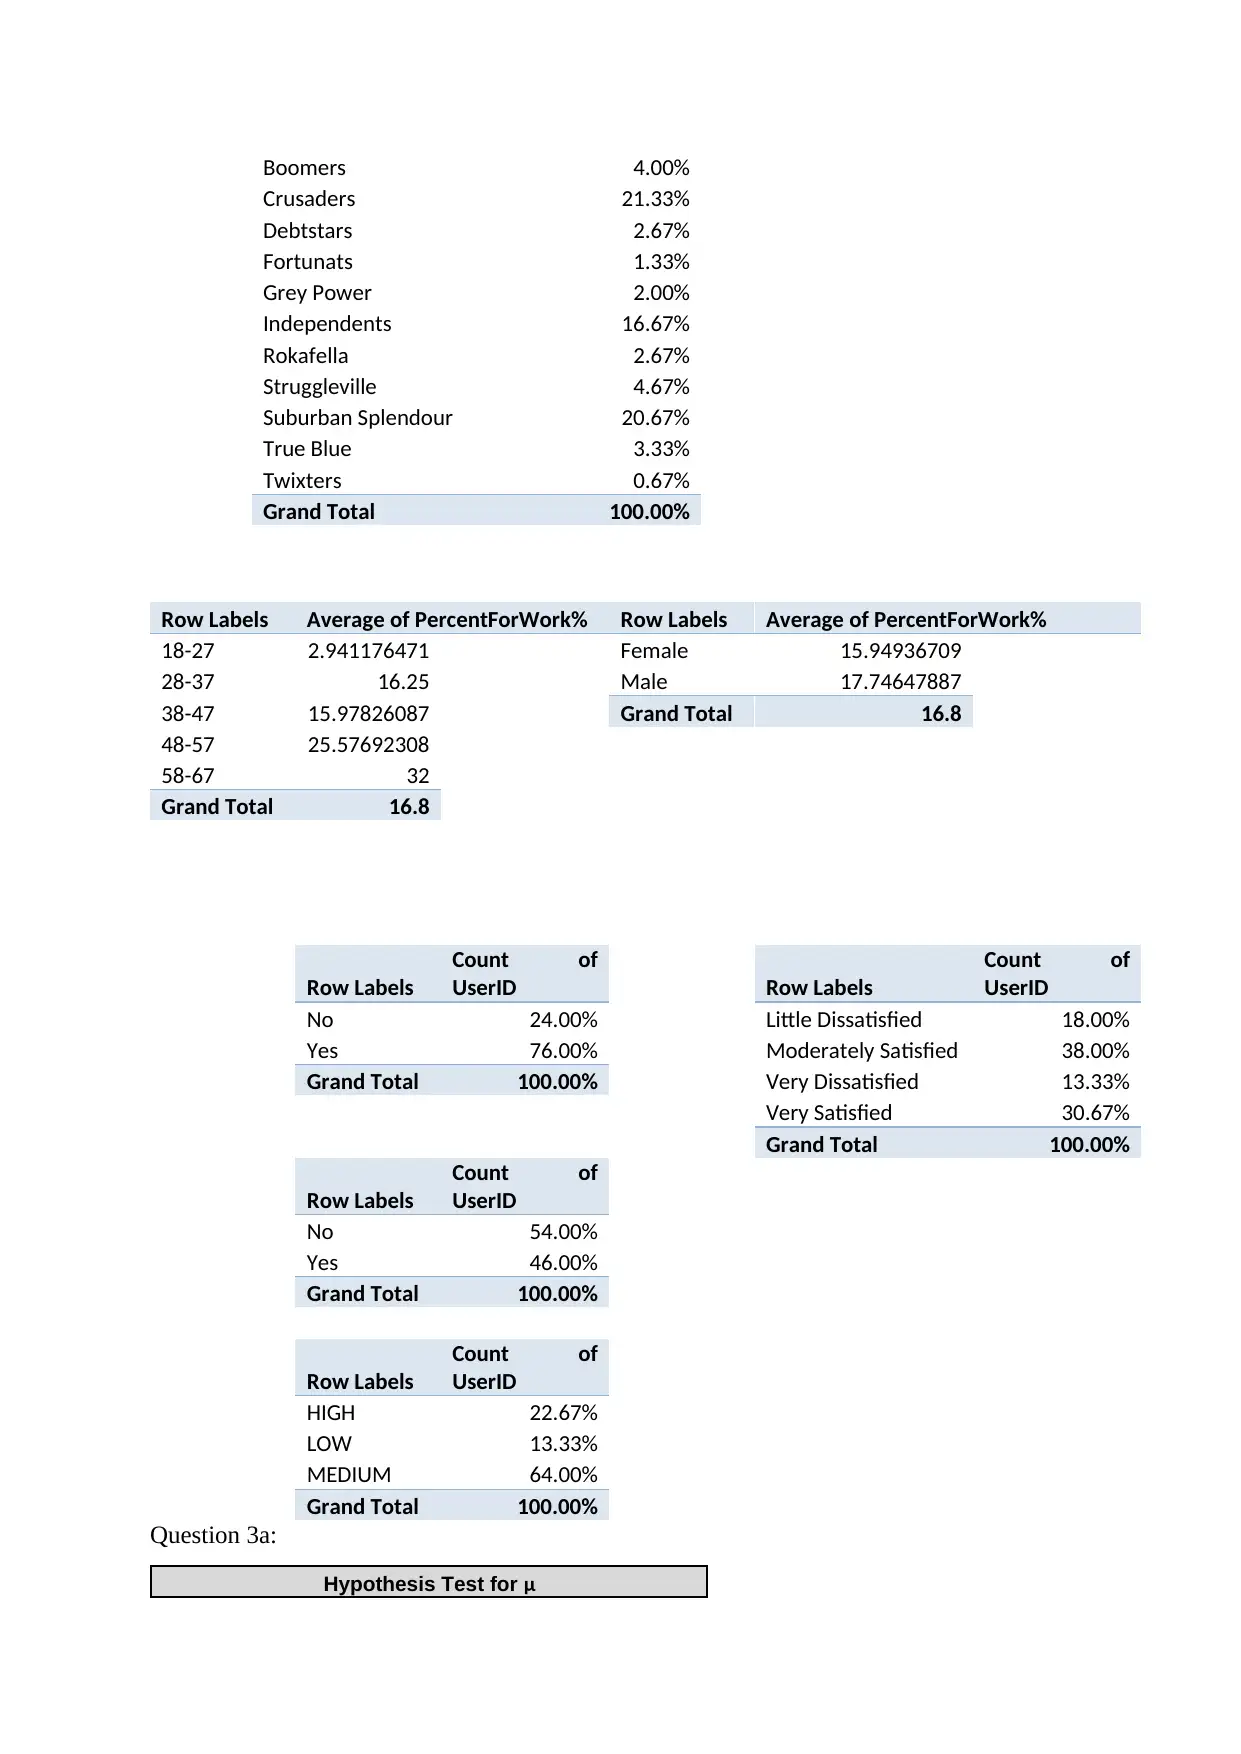
In order to build a profile of a typical smartphone user, two specific aspects were enquired
here. First of all, it was asked to find out the average percentage use of Smartphones for
work-related activities. With reference to the appendix [question 2], it can be concluded that
on an average 16.8% users have used smartphone for work related activities. At the same
time, it was also asked to find out the proportion of Smartphone users classified as geo tribe
‘Crusaders’. The answer is 21.33% of the selected users.
However, these two are not the only information which should be incorporated while building
smartphone user’s profile. From the given data, there are several important information can
be included here, which can give a better insight. For example, with reference to the
appendix, the foremost information which can be included is age wise distribution of
smartphone users who are using this smart phone for work related activities. This will help to
gauge the trend related to use of smartphone across different age group. Similarly, across
gender, proportion of uses for payment purpose, proportion of uses for online purchase
purpose and whether users are engaged in social media activities or not can also be added in
the user profile.
Question 3:
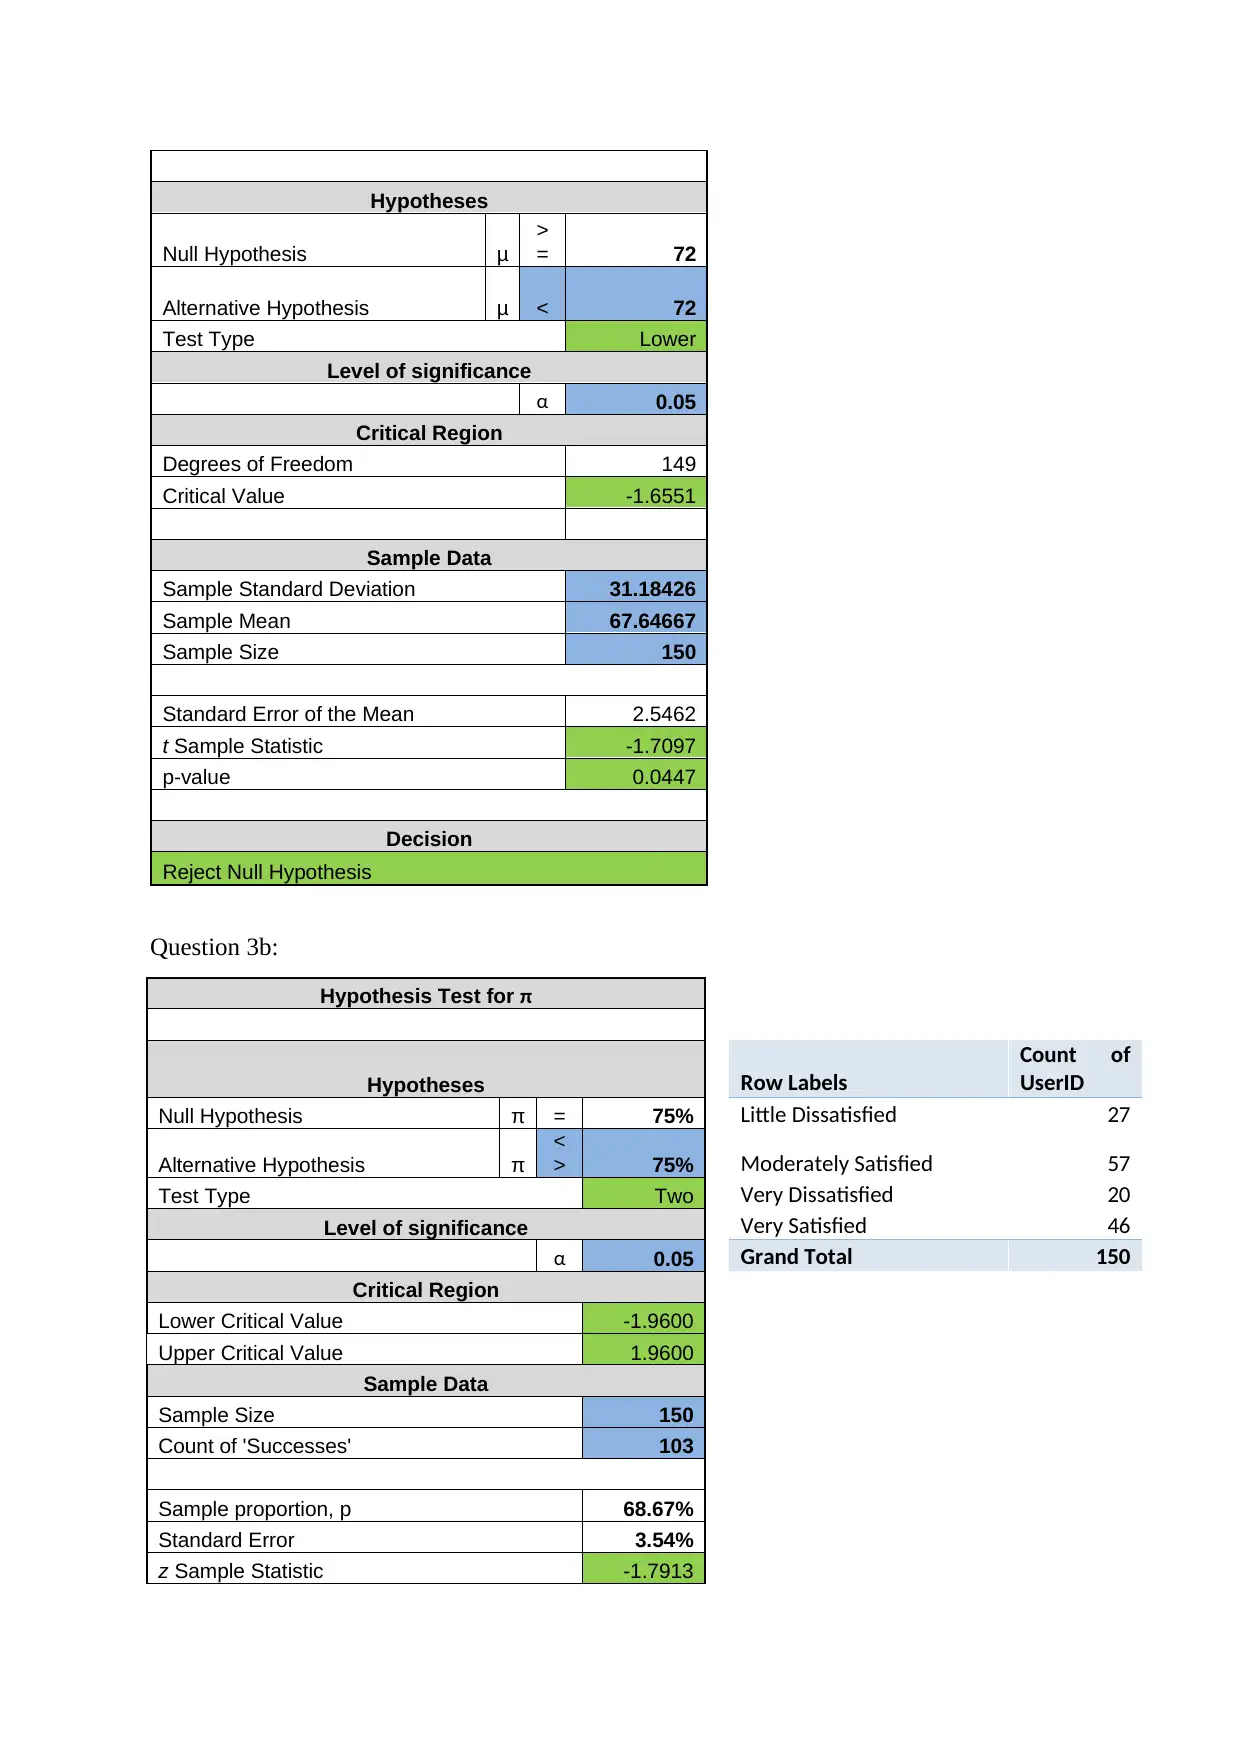
Part a:
The aim of this question was to validate whether the average monthly bill has dropped below
$72 or not. The analyst has performed a specific test and with reference to the details
provided in the appendix section [question 3a], it can be inferred that there is enough
evidence that the average monthly bill has dropped below $72.
Considering the steady incremental rate of number of smartphone users across globe,
business entities have started concentrating on the business opportunity generates from this
large pool of smartphone users. Evaluation of specific information like how the users are
utilizing their smartphone can give significant mileage not only to reach maximum customer
base but also to enhance their marketing strategy and the overall operation at the end. There
are several researches have already been conducted and a number of conclusions have
already been concluded basis which business entities are making changes at their tactical
level.
This specific study is performed to replicate the similar study by analysing a given set of
information. As per given information, 150 users information have been utilised to perform a
series of tests which have been discussed throughout the next section of this report.
2.0 Discussion
Question 1:
The first question was all about overall summary of monthly bill amount of 150 smart phone
users. With reference to the appendix [question 1], it can be said that on an average, the
chosen users have spent $67.65 per month. Not only has that, the study also reveals that half
of the users have spent above $64 per month. Again, the analysis further explains there is a
95% chance that the average monthly bill amount of the selected users remains in between
$62.62 and $72.78. Finally, the data can show that one the users have spent $216 per month,
which is the highest monthly bill amount and one of the users have spent $11, which is the
lowest monthly bill amount.
Question 2:
In order to build a profile of a typical smartphone user, two specific aspects were enquired
here. First of all, it was asked to find out the average percentage use of Smartphones for
work-related activities. With reference to the appendix [question 2], it can be concluded that
on an average 16.8% users have used smartphone for work related activities. At the same
time, it was also asked to find out the proportion of Smartphone users classified as geo tribe
‘Crusaders’. The answer is 21.33% of the selected users.
However, these two are not the only information which should be incorporated while building
smartphone user’s profile. From the given data, there are several important information can
be included here, which can give a better insight. For example, with reference to the
appendix, the foremost information which can be included is age wise distribution of
smartphone users who are using this smart phone for work related activities. This will help to
gauge the trend related to use of smartphone across different age group. Similarly, across
gender, proportion of uses for payment purpose, proportion of uses for online purchase
purpose and whether users are engaged in social media activities or not can also be added in
the user profile.
Question 3:
Part a:
The aim of this question was to validate whether the average monthly bill has dropped below
$72 or not. The analyst has performed a specific test and with reference to the details
provided in the appendix section [question 3a], it can be inferred that there is enough
evidence that the average monthly bill has dropped below $72.
⊘ This is a preview!⊘
Do you want full access?
Subscribe today to unlock all pages.
Trusted by 1+ million students worldwide
Part b:
It was noted that there was a report which concluded 3 out of 4 users are either very satisfied
or moderately satisfied with the service provided by the service provider. The aim was to find
out whether such claim is still valid or not. Considering the details mentioned in appendix
[question 3b], there is enough evidence to conclude that the study still remains valid.
Part c:
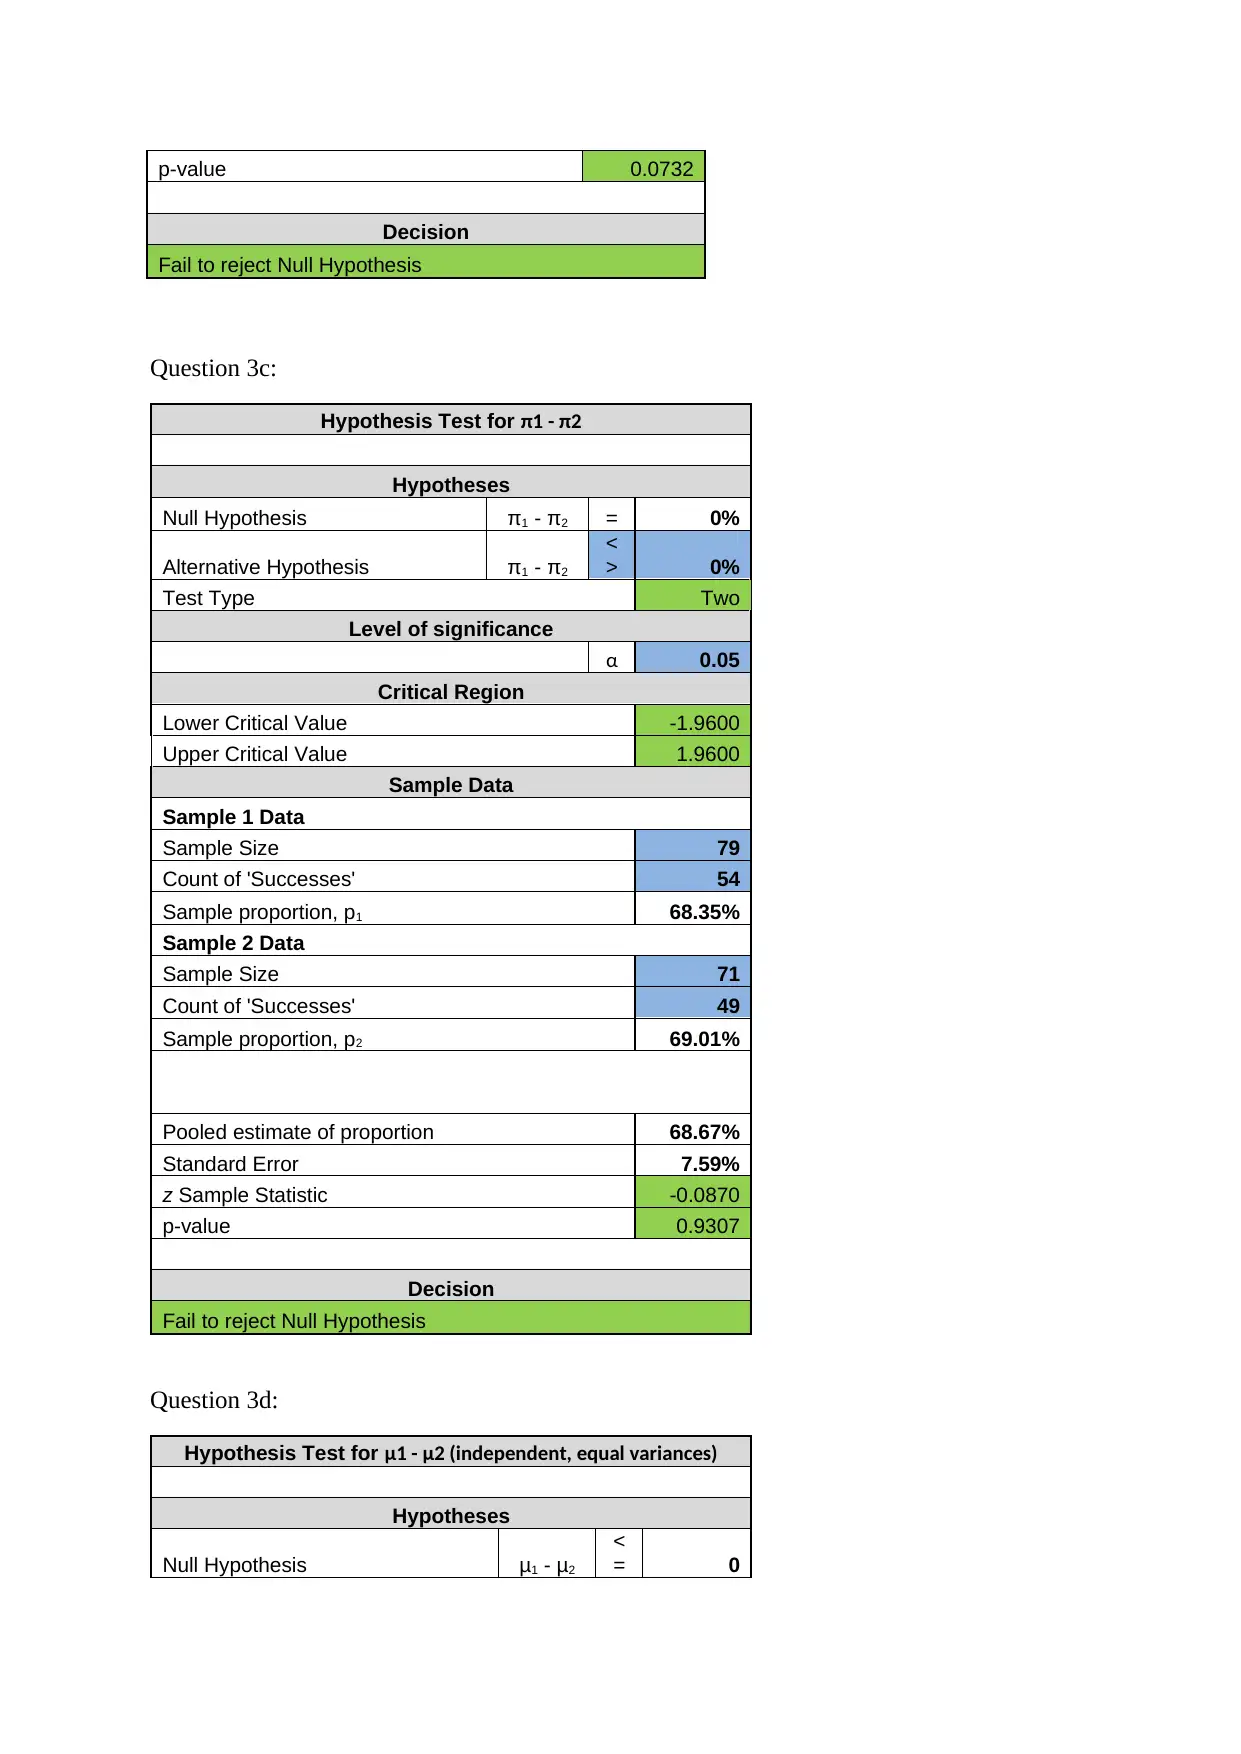
The information given in this section has shown that there is a significant difference exists
between how males and females users feel about their service provider. A further study has
been conducted to verify this claim. Now, the information mentioned again in the appendix
section has shown that the claim is wrong. In other words, there is no such significant
difference exists.
Part d:
It is believed that the monthly bill amounts are related to the use of the Smartphone as a
payment device. In particular, the average monthly bill is higher when using the smartphone
as a payment device. Now to conclude whether this proposition holds true or not, the analyst
has identified the average monthly bill of individual users who uses smartphone as payment
devices. Number of individual users have also been identified. A further analysis reveals it is
true that the average monthly bill is higher when using the smartphone as a payment device.
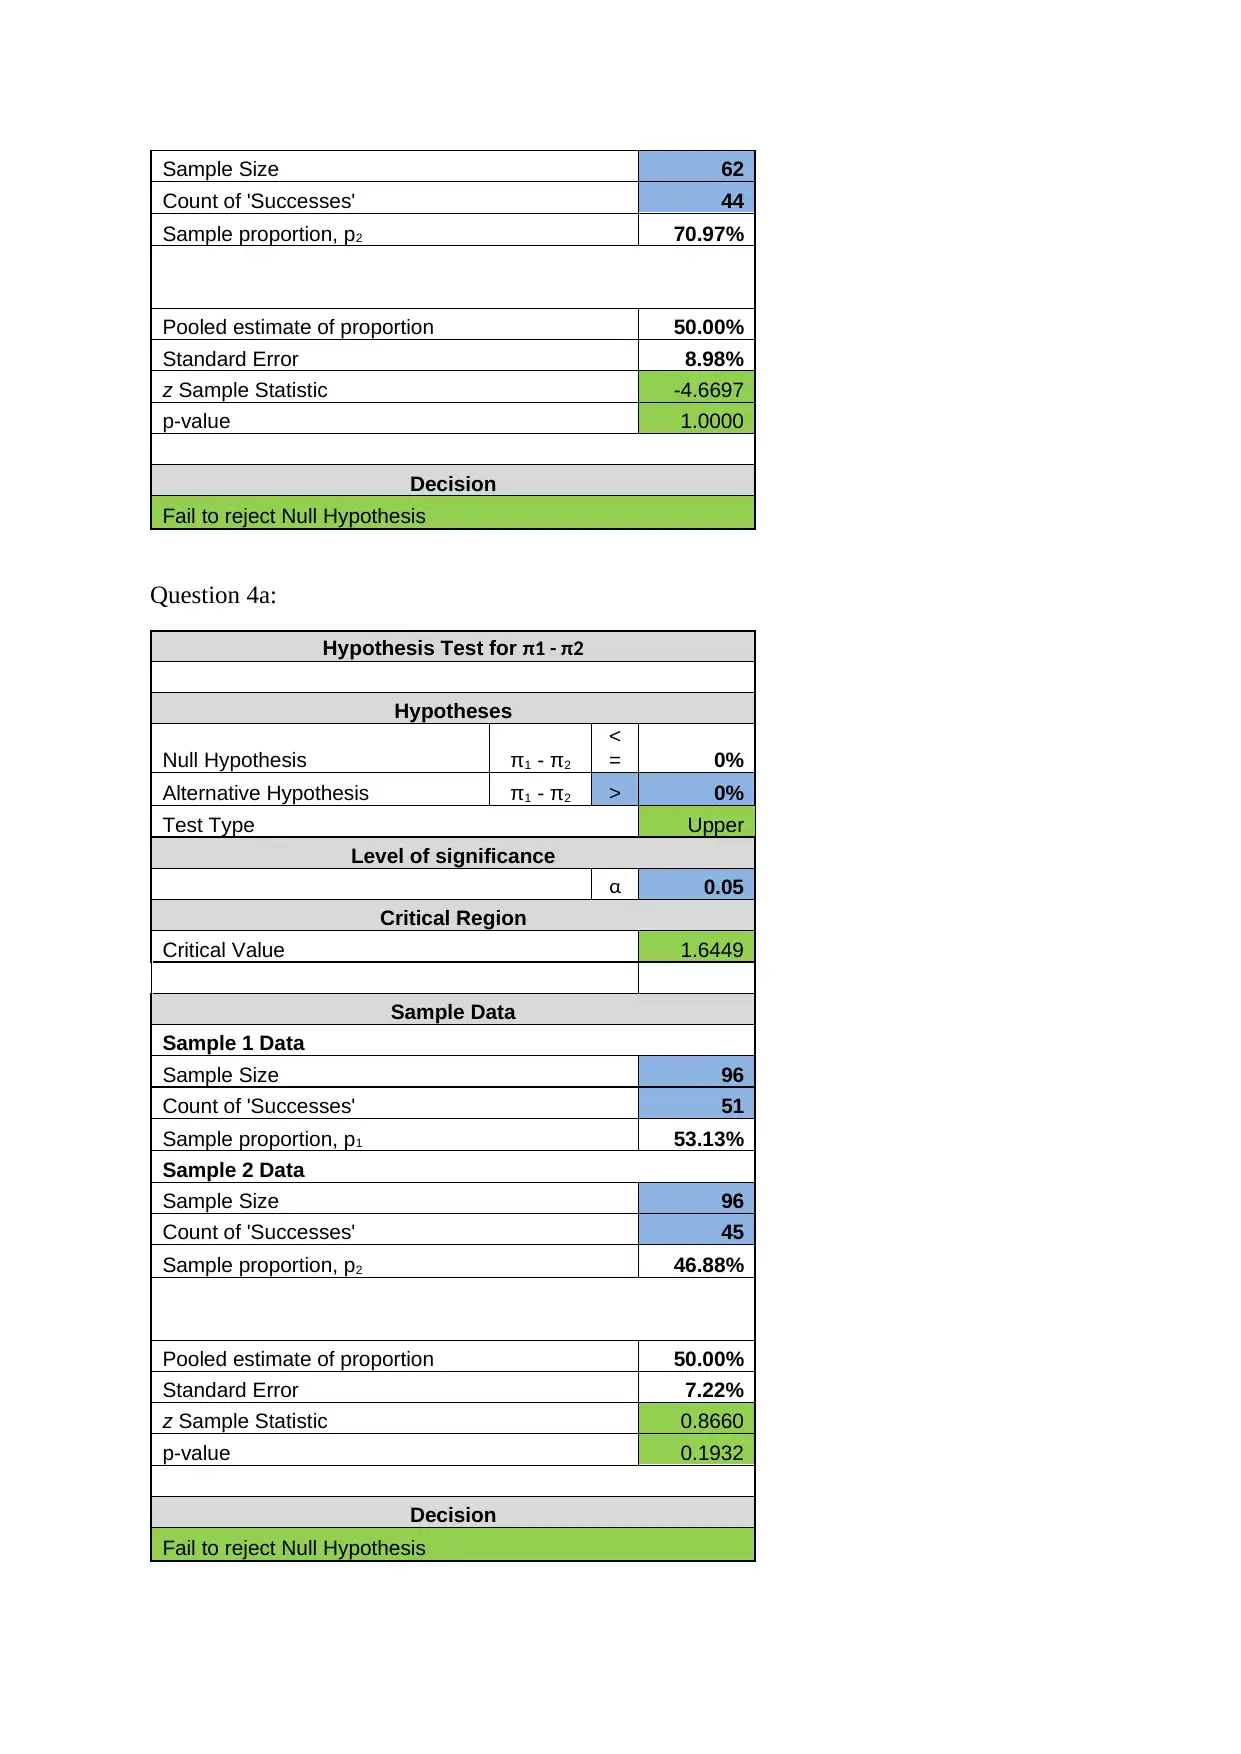
Part e:
At the end of this section, it was given that the industry experts believe that the use of
Smartphones for online purchases is higher for users who are highly active in social media
than for those users who are moderately active in social media. The aim was to validate this
statement. To find out whether this statement is valid or not, the analyst has performed a
series of analysis mentioned in the appendix section [question 3e]. According to this
information it can be concluded that this statement does not hold true always.
Question 4:
Part a:
In the final section of this study, the aim was to find out the association among the level of
social media engagement, gender and the average monthly bill amount. As a first step, it was
checked whether the proportion of female users who are moderately active in social media is
higher than that of male users who are moderately active in social media or not. The details
study which has been performed is shown in appendix section [question 4a]. According to the
given information the analyst can conclude that there is no such significant evidence which
can infer as the proportion of female users who are moderately active in social media is
higher than that of male users who are moderately active in social media.
Part b:
In the end, the study performed one last analysis to validate whether the average monthly bill
amount for users who are moderately active in social media is higher when the Smartphone
user is female. The results has shown that the reality is quite opposite. It means there is no
such evidence basis which the analyst can conclude that the average monthly bill amount for
users who are moderately active in social media is higher when the Smartphone user is
female.
3.0 Conclusion
Thus, to conclude it can be said that the analyst has successfully deduced specific set of
answers as instructed and inferred the next course of action. To add, it can also be said that
this study also supported most of the previously drawn conclusion but in some specific cases,
It was noted that there was a report which concluded 3 out of 4 users are either very satisfied
or moderately satisfied with the service provided by the service provider. The aim was to find
out whether such claim is still valid or not. Considering the details mentioned in appendix
[question 3b], there is enough evidence to conclude that the study still remains valid.
Part c:
The information given in this section has shown that there is a significant difference exists
between how males and females users feel about their service provider. A further study has
been conducted to verify this claim. Now, the information mentioned again in the appendix
section has shown that the claim is wrong. In other words, there is no such significant
difference exists.
Part d:
It is believed that the monthly bill amounts are related to the use of the Smartphone as a
payment device. In particular, the average monthly bill is higher when using the smartphone
as a payment device. Now to conclude whether this proposition holds true or not, the analyst
has identified the average monthly bill of individual users who uses smartphone as payment
devices. Number of individual users have also been identified. A further analysis reveals it is
true that the average monthly bill is higher when using the smartphone as a payment device.
Part e:
At the end of this section, it was given that the industry experts believe that the use of
Smartphones for online purchases is higher for users who are highly active in social media
than for those users who are moderately active in social media. The aim was to validate this
statement. To find out whether this statement is valid or not, the analyst has performed a
series of analysis mentioned in the appendix section [question 3e]. According to this
information it can be concluded that this statement does not hold true always.
Question 4:
Part a:
In the final section of this study, the aim was to find out the association among the level of
social media engagement, gender and the average monthly bill amount. As a first step, it was
checked whether the proportion of female users who are moderately active in social media is
higher than that of male users who are moderately active in social media or not. The details
study which has been performed is shown in appendix section [question 4a]. According to the
given information the analyst can conclude that there is no such significant evidence which
can infer as the proportion of female users who are moderately active in social media is
higher than that of male users who are moderately active in social media.
Part b:
In the end, the study performed one last analysis to validate whether the average monthly bill
amount for users who are moderately active in social media is higher when the Smartphone
user is female. The results has shown that the reality is quite opposite. It means there is no
such evidence basis which the analyst can conclude that the average monthly bill amount for
users who are moderately active in social media is higher when the Smartphone user is
female.
3.0 Conclusion
Thus, to conclude it can be said that the analyst has successfully deduced specific set of
answers as instructed and inferred the next course of action. To add, it can also be said that
this study also supported most of the previously drawn conclusion but in some specific cases,
Paraphrase This Document
Need a fresh take? Get an instant paraphrase of this document with our AI Paraphraser

the results opposed the earlier beliefs. Nevertheless, it can be said that such data is not the
only parameter to deduce next course of actions but certainly a building blocks for overall
operation strategies.
only parameter to deduce next course of actions but certainly a building blocks for overall
operation strategies.
Bibliography
Anderson, D.R., Sweeney, D.J., Williams, T.A., Camm, J.D. and Cochran, J.J.,
2016. Statistics for business & economics. Nelson Education.
Gupta, K.R. and Gupta, M.P., 2017. Business statistics. Atlantic Publishers & Distributors.
Rhodes, C., 2015. Business statistics. Briefing paper, 6152.
Rivera, J. and Groleau, T., 2018. UNDERGRADUATE RESEARCH AND APPLIED
BUSINESS STATISTICS. Course-Based Undergraduate Research: Educational Equity and
High-Impact Practice.
Siegel, A., 2016. Practical business statistics. Academic Press.
Storey, D.J., 2016. Understanding the small business sector. Routledge.
⊘ This is a preview!⊘
Do you want full access?
Subscribe today to unlock all pages.
Trusted by 1+ million students worldwide
Appendices
Question 1:
Monthly Bill Summary
Report
MonthlyBill ($) Confidence Interval for mean
Mean
67.6466
7 Data
Standard Error
2.54618
4 Sample Standard
Deviation
31.1842
6
Median 64 Sample Mean
67.6466
7
Mode 50 Sample Size 150
Standard Deviation
31.1842
6 Confidence Level 95%
Sample Variance
972.458
2
Kurtosis
2.82030
4 Intermediate Calculations
Skewness
1.05280
4 Standard Error of the
Mean 2.5462
Range 205 Degrees of Freedom 149
Minimum 11 t Value 1.9760
Maximum 216 Margin of Error 5.0313
Sum 10147
Count 150 Confidence Interval
Interval Lower Limit 62.62
Interval Upper Limit 72.68
Question 2:
Average of
PercentForWork%
16.8
Row Labels
Count of
UserID
Achievers 20.00%
Paraphrase This Document
Need a fresh take? Get an instant paraphrase of this document with our AI Paraphraser
Boomers 4.00%
Crusaders 21.33%
Debtstars 2.67%
Fortunats 1.33%
Grey Power 2.00%
Independents 16.67%
Rokafella 2.67%
Struggleville 4.67%
Suburban Splendour 20.67%
True Blue 3.33%
Twixters 0.67%
Grand Total 100.00%
Row Labels Average of PercentForWork% Row Labels Average of PercentForWork%
18-27 2.941176471 Female 15.94936709
28-37 16.25 Male 17.74647887
38-47 15.97826087 Grand Total 16.8
48-57 25.57692308
58-67 32
Grand Total 16.8
Row Labels
Count of
UserID Row Labels
Count of
UserID
No 24.00% Little Dissatisfied 18.00%
Yes 76.00% Moderately Satisfied 38.00%
Grand Total 100.00% Very Dissatisfied 13.33%
Very Satisfied 30.67%
Grand Total 100.00%
Row Labels
Count of
UserID
No 54.00%
Yes 46.00%
Grand Total 100.00%
Row Labels
Count of
UserID
HIGH 22.67%
LOW 13.33%
MEDIUM 64.00%
Grand Total 100.00%
Question 3a:
Hypothesis Test for μ
Hypotheses
Null Hypothesis μ
>
= 72
Alternative Hypothesis μ < 72
Test Type Lower
Level of significance
α 0.05
Critical Region
Degrees of Freedom 149
Critical Value -1.6551
Sample Data
Sample Standard Deviation 31.18426
Sample Mean 67.64667
Sample Size 150
Standard Error of the Mean 2.5462
t Sample Statistic -1.7097
p-value 0.0447
Decision
Reject Null Hypothesis
Question 3b:
Hypothesis Test for π
Hypotheses Row Labels
Count of
UserID
Null Hypothesis π = 75% Little Dissatisfied 27
Alternative Hypothesis π
<
> 75% Moderately Satisfied 57
Test Type Two Very Dissatisfied 20
Level of significance Very Satisfied 46
α 0.05 Grand Total 150
Critical Region
Lower Critical Value -1.9600
Upper Critical Value 1.9600
Sample Data
Sample Size 150
Count of 'Successes' 103
Sample proportion, p 68.67%
Standard Error 3.54%
z Sample Statistic -1.7913
⊘ This is a preview!⊘
Do you want full access?
Subscribe today to unlock all pages.
Trusted by 1+ million students worldwide
p-value 0.0732
Decision
Fail to reject Null Hypothesis
Question 3c:
Hypothesis Test for π1 - π2
Hypotheses
Null Hypothesis π1 - π2 = 0%
Alternative Hypothesis π1 - π2
<
> 0%
Test Type Two
Level of significance
α 0.05
Critical Region
Lower Critical Value -1.9600
Upper Critical Value 1.9600
Sample Data
Sample 1 Data
Sample Size 79
Count of 'Successes' 54
Sample proportion, p1 68.35%
Sample 2 Data
Sample Size 71
Count of 'Successes' 49
Sample proportion, p2 69.01%
Pooled estimate of proportion 68.67%
Standard Error 7.59%
z Sample Statistic -0.0870
p-value 0.9307
Decision
Fail to reject Null Hypothesis
Question 3d:
Hypothesis Test for μ1 - μ2 (independent, equal variances)
Hypotheses
Null Hypothesis μ1 - μ2
<
= 0
Decision
Fail to reject Null Hypothesis
Question 3c:
Hypothesis Test for π1 - π2
Hypotheses
Null Hypothesis π1 - π2 = 0%
Alternative Hypothesis π1 - π2
<
> 0%
Test Type Two
Level of significance
α 0.05
Critical Region
Lower Critical Value -1.9600
Upper Critical Value 1.9600
Sample Data
Sample 1 Data
Sample Size 79
Count of 'Successes' 54
Sample proportion, p1 68.35%
Sample 2 Data
Sample Size 71
Count of 'Successes' 49
Sample proportion, p2 69.01%
Pooled estimate of proportion 68.67%
Standard Error 7.59%
z Sample Statistic -0.0870
p-value 0.9307
Decision
Fail to reject Null Hypothesis
Question 3d:
Hypothesis Test for μ1 - μ2 (independent, equal variances)
Hypotheses
Null Hypothesis μ1 - μ2
<
= 0
Paraphrase This Document
Need a fresh take? Get an instant paraphrase of this document with our AI Paraphraser
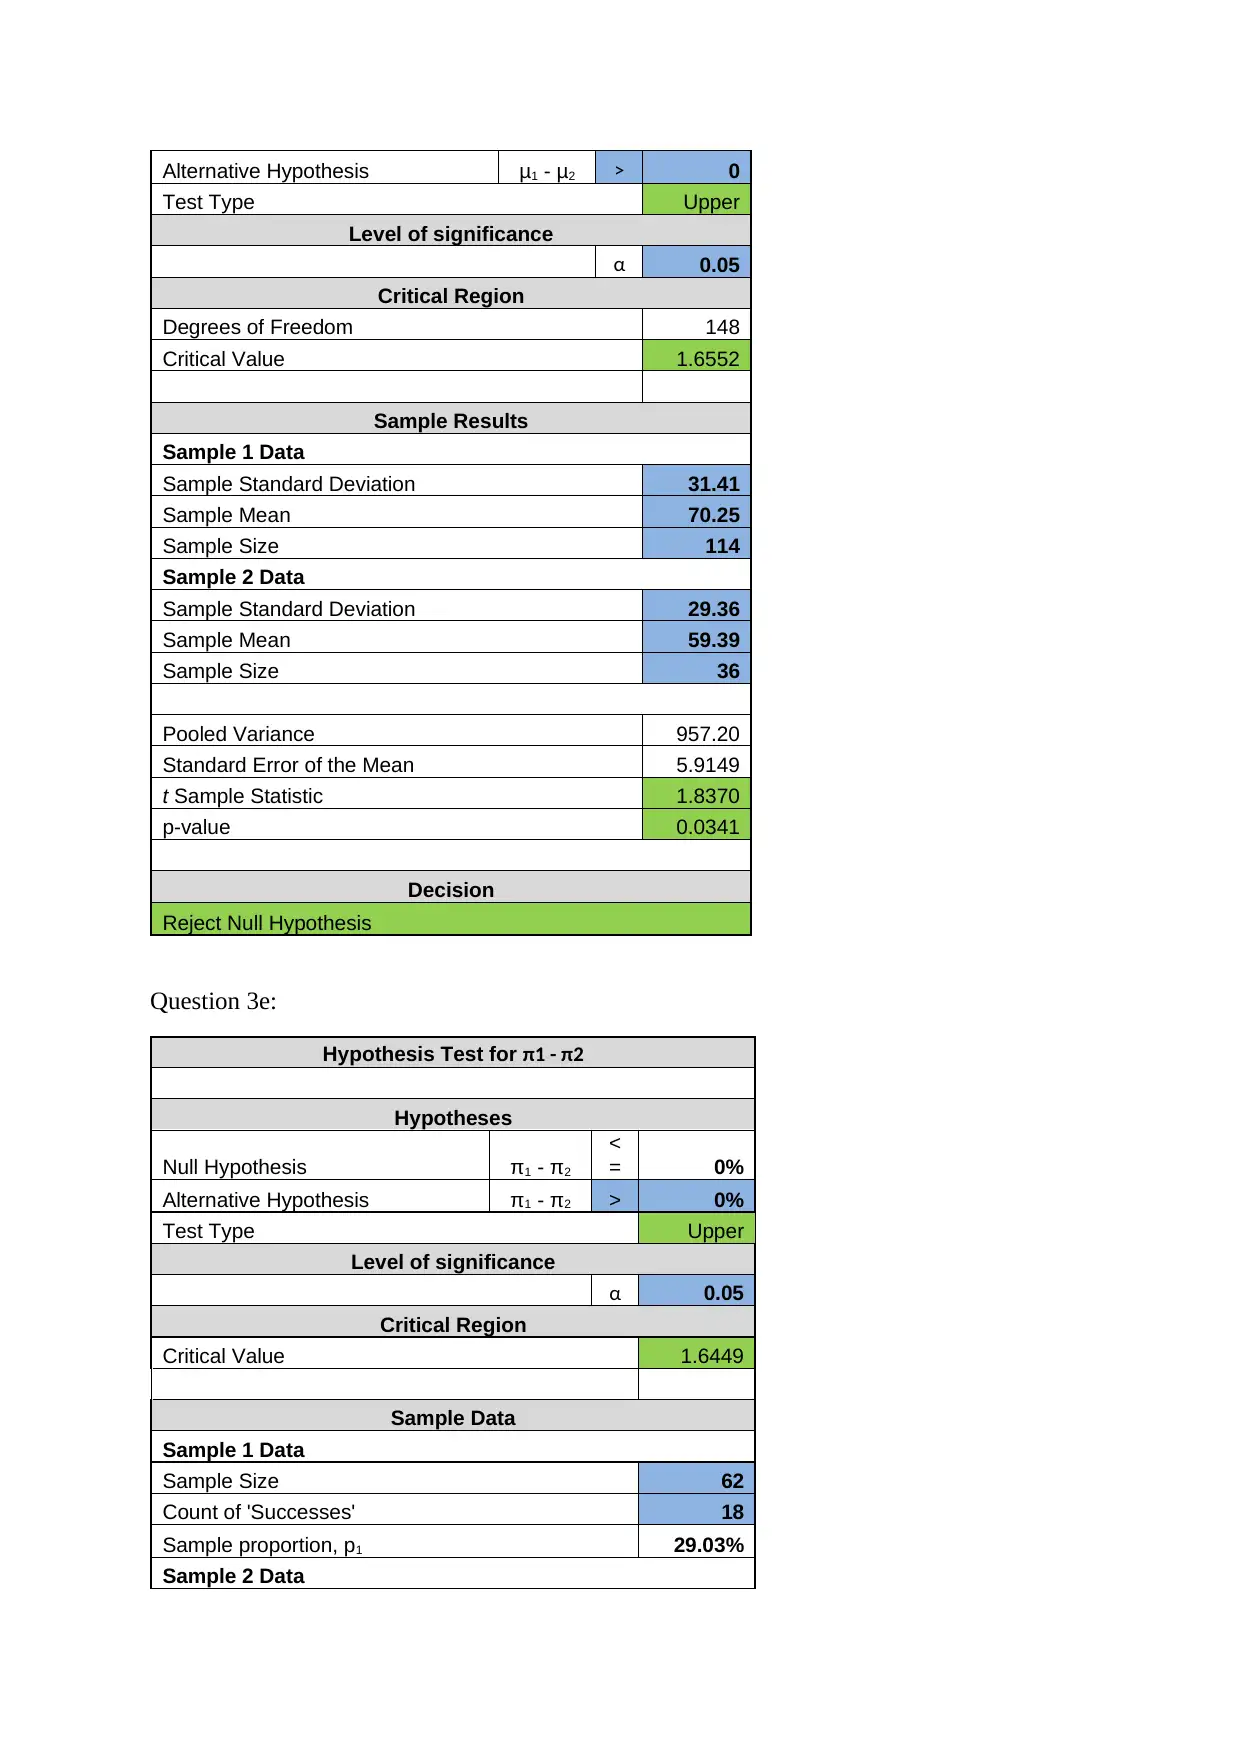
Alternative Hypothesis μ1 - μ2 > 0
Test Type Upper
Level of significance
α 0.05
Critical Region
Degrees of Freedom 148
Critical Value 1.6552
Sample Results
Sample 1 Data
Sample Standard Deviation 31.41
Sample Mean 70.25
Sample Size 114
Sample 2 Data
Sample Standard Deviation 29.36
Sample Mean 59.39
Sample Size 36
Pooled Variance 957.20
Standard Error of the Mean 5.9149
t Sample Statistic 1.8370
p-value 0.0341
Decision
Reject Null Hypothesis
Question 3e:
Hypothesis Test for π1 - π2
Hypotheses
Null Hypothesis π1 - π2
<
= 0%
Alternative Hypothesis π1 - π2 > 0%
Test Type Upper
Level of significance
α 0.05
Critical Region
Critical Value 1.6449
Sample Data
Sample 1 Data
Sample Size 62
Count of 'Successes' 18
Sample proportion, p1 29.03%
Sample 2 Data
Test Type Upper
Level of significance
α 0.05
Critical Region
Degrees of Freedom 148
Critical Value 1.6552
Sample Results
Sample 1 Data
Sample Standard Deviation 31.41
Sample Mean 70.25
Sample Size 114
Sample 2 Data
Sample Standard Deviation 29.36
Sample Mean 59.39
Sample Size 36
Pooled Variance 957.20
Standard Error of the Mean 5.9149
t Sample Statistic 1.8370
p-value 0.0341
Decision
Reject Null Hypothesis
Question 3e:
Hypothesis Test for π1 - π2
Hypotheses
Null Hypothesis π1 - π2
<
= 0%
Alternative Hypothesis π1 - π2 > 0%
Test Type Upper
Level of significance
α 0.05
Critical Region
Critical Value 1.6449
Sample Data
Sample 1 Data
Sample Size 62
Count of 'Successes' 18
Sample proportion, p1 29.03%
Sample 2 Data
Sample Size 62
Count of 'Successes' 44
Sample proportion, p2 70.97%
Pooled estimate of proportion 50.00%
Standard Error 8.98%
z Sample Statistic -4.6697
p-value 1.0000
Decision
Fail to reject Null Hypothesis
Question 4a:
Hypothesis Test for π1 - π2
Hypotheses
Null Hypothesis π1 - π2
<
= 0%
Alternative Hypothesis π1 - π2 > 0%
Test Type Upper
Level of significance
α 0.05
Critical Region
Critical Value 1.6449
Sample Data
Sample 1 Data
Sample Size 96
Count of 'Successes' 51
Sample proportion, p1 53.13%
Sample 2 Data
Sample Size 96
Count of 'Successes' 45
Sample proportion, p2 46.88%
Pooled estimate of proportion 50.00%
Standard Error 7.22%
z Sample Statistic 0.8660
p-value 0.1932
Decision
Fail to reject Null Hypothesis
⊘ This is a preview!⊘
Do you want full access?
Subscribe today to unlock all pages.
Trusted by 1+ million students worldwide
1 out of 13
Related Documents


Your All-in-One AI-Powered Toolkit for Academic Success.
+13062052269
info@desklib.com
Available 24*7 on WhatsApp / Email
![[object Object]](/_next/static/media/star-bottom.7253800d.svg)
Unlock your academic potential
Copyright © 2020–2026 A2Z Services. All Rights Reserved. Developed and managed by ZUCOL.