MIS772 Predictive Analytics (2019 T1) A1-LP2: Classification Report

Verified

Added on  2023/01/10

|8
|2069
|100
Report
AI Summary
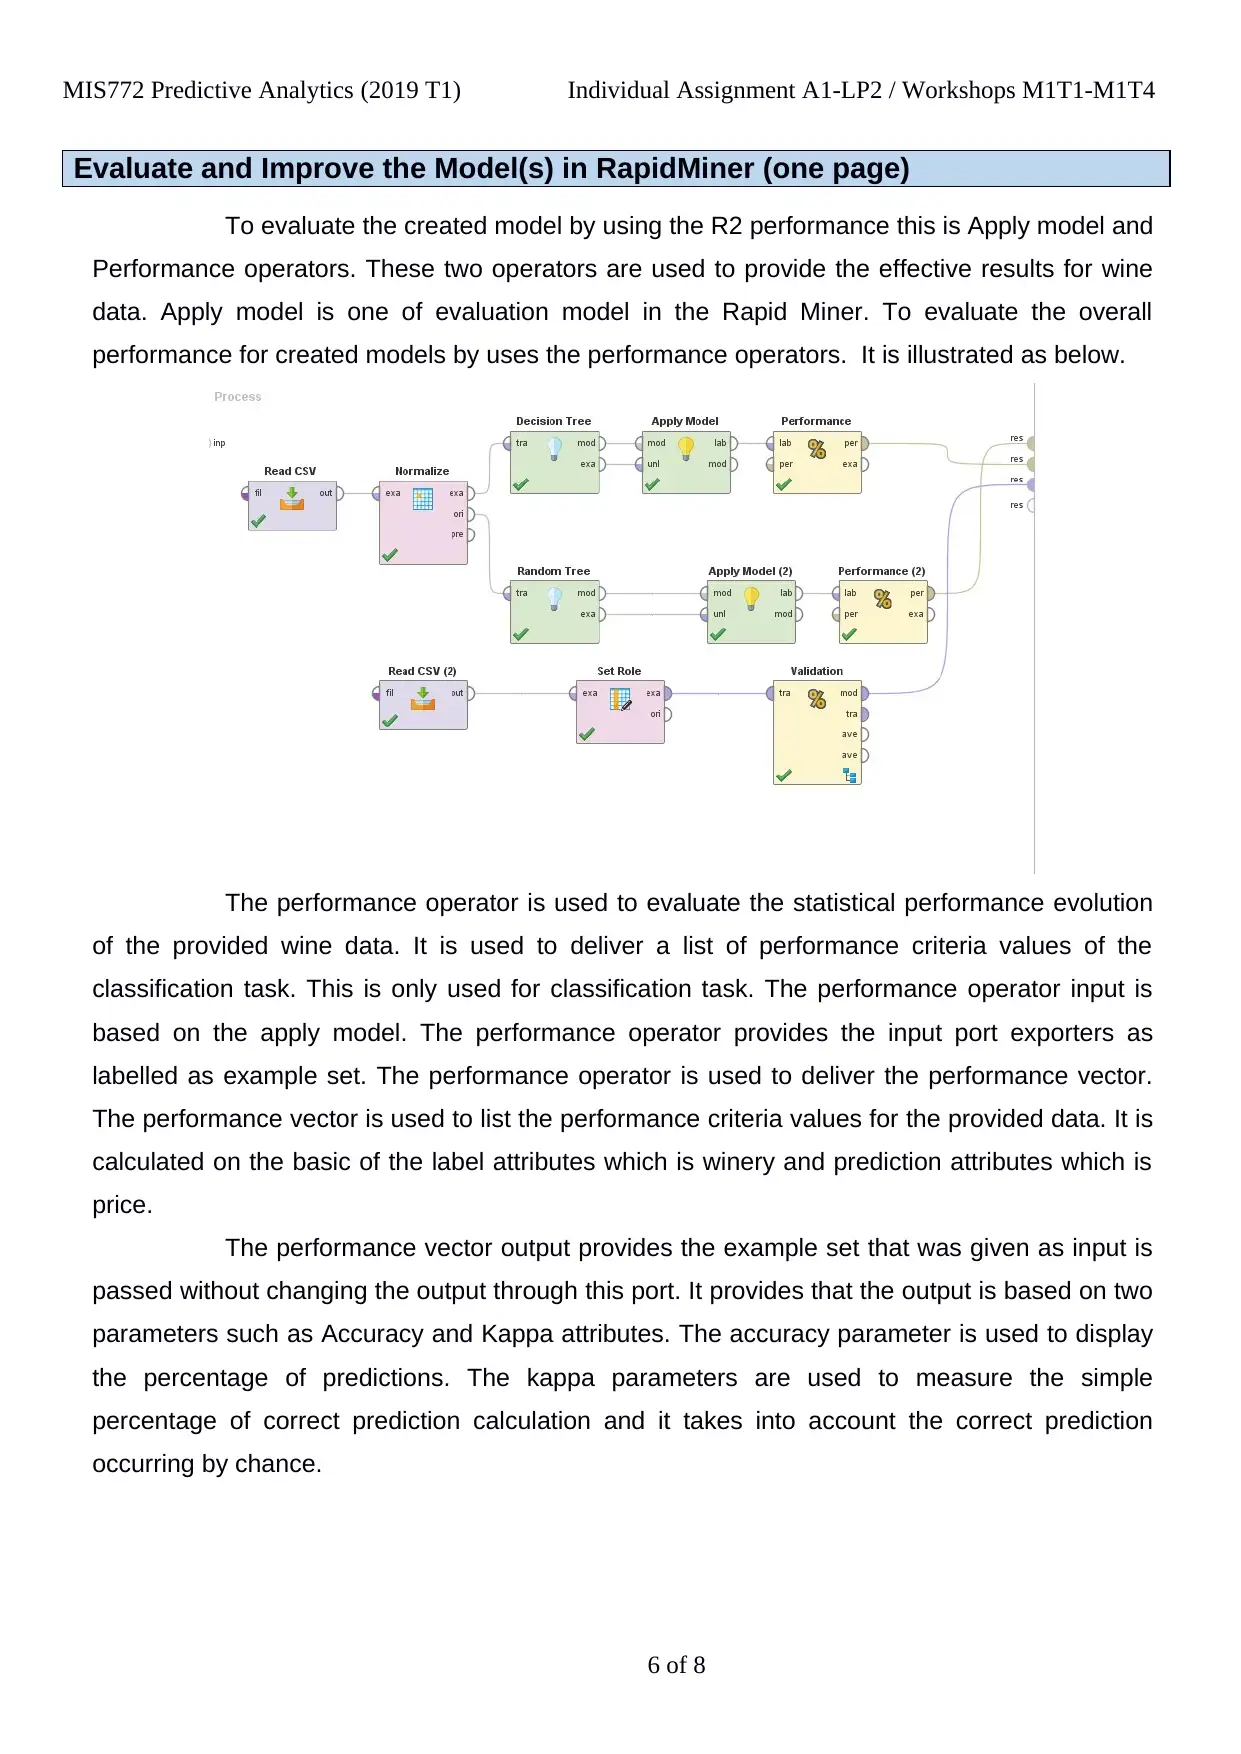
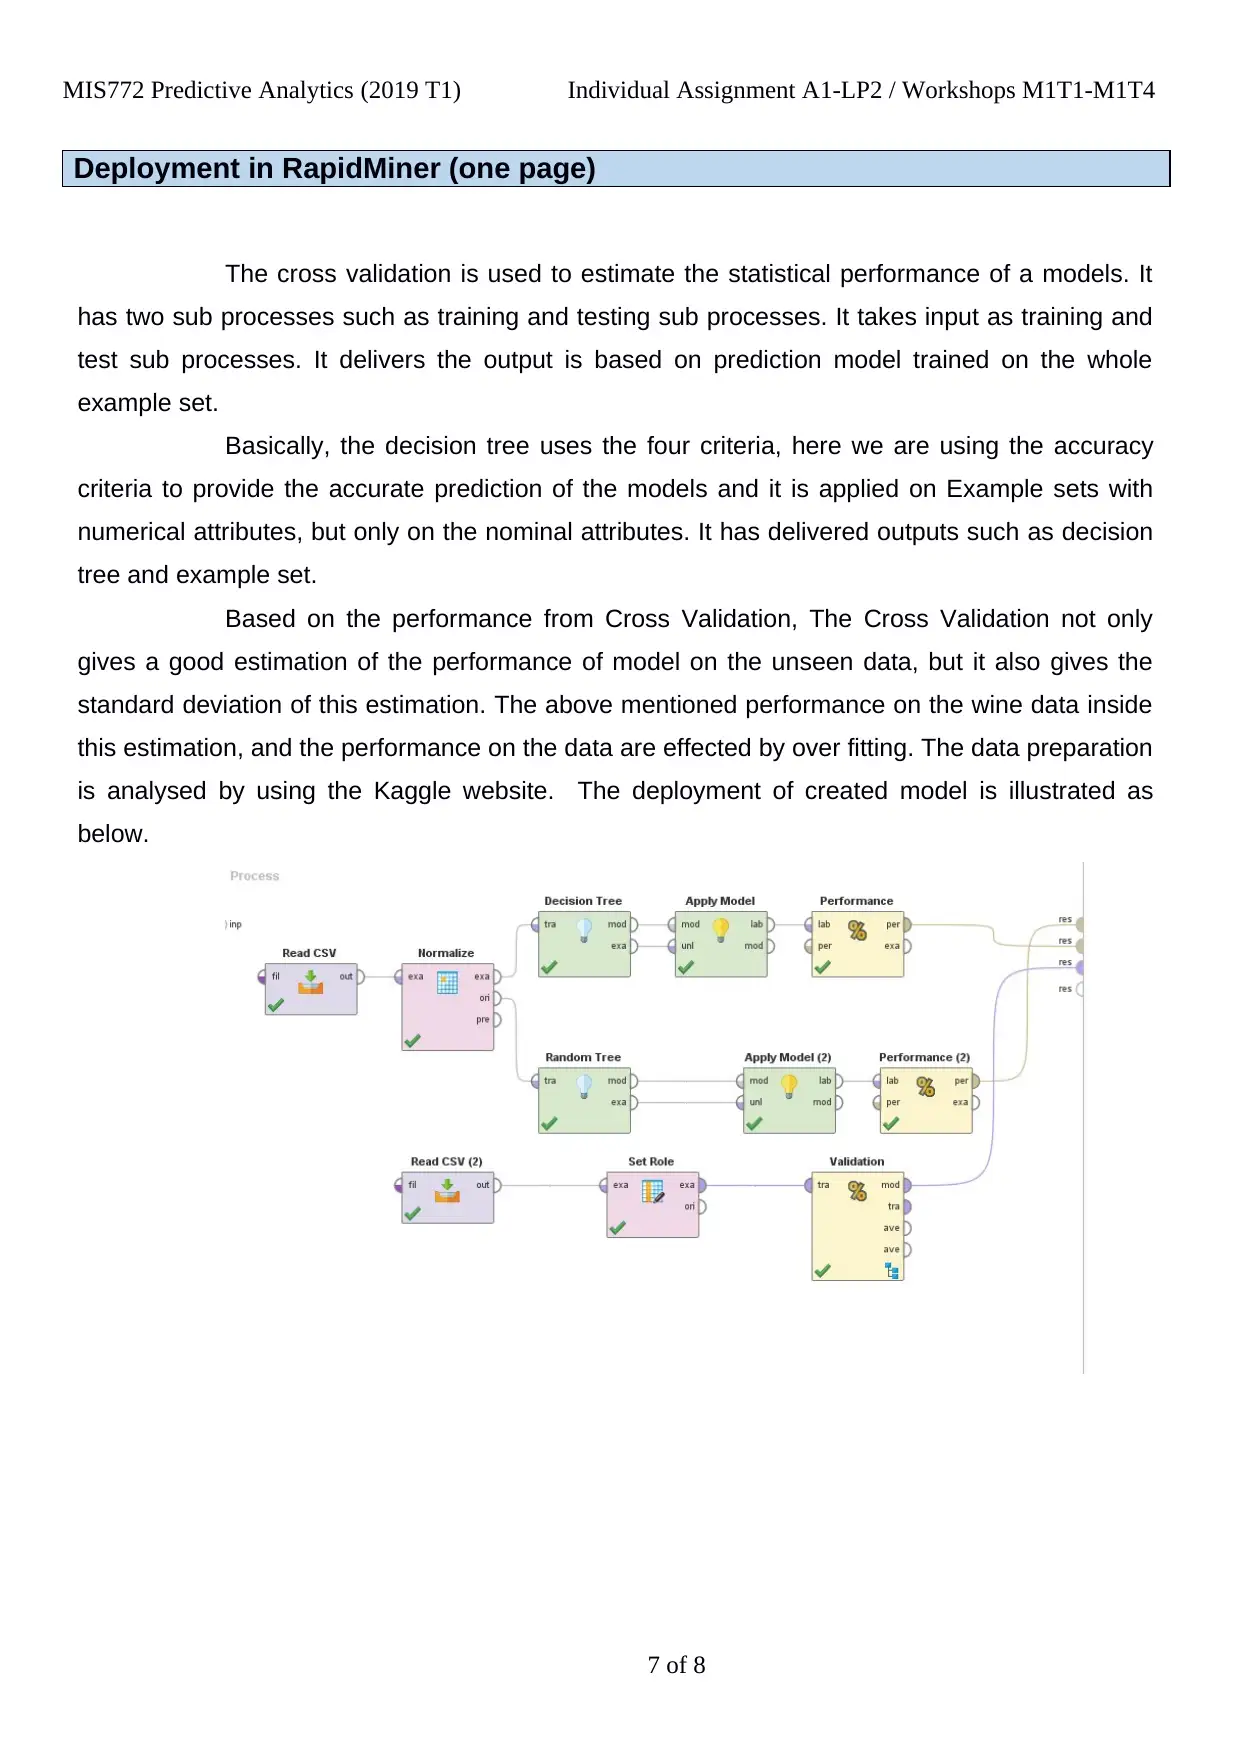
This report details the analysis of a predictive analytics assignment (MIS772) focused on classifying wine data using RapidMiner. The student begins with an executive summary, outlining the project's objectives, which include exploring wine data to derive insights for Australian Wine Importers (AWI). The project involves data preparation, including handling missing values and attribute selection. The core of the report involves discovering relationships within the data through correlation matrices, and creating predictive models using Decision Tree and Random Tree algorithms within RapidMiner. The models are then evaluated using performance operators (Accuracy and Kappa), and further refined through cross-validation to estimate statistical performance. The student also discusses the deployment of the models. The report concludes with a discussion of further research and extensions, highlighting the potential of the created models to predict wine price ranges based on winery attributes and taste results. The student also mentions the lack of independent research to confirm the predictions and the overall effectiveness of the models.
Document Page
MIS772 Predictive Analytics (2019 T1) Individual Assignment A1-LP2 / Workshops M1T1-M1T4
Assignment A1-LP2: Classification
Student
Name
(as per record) Student No Student number
My other group members A1
Group No
As per CloudDeakin group
number
Team
Names
(as per record) Student Nos Student number
(as per record) Student number
Exceptional Meets expectations Issues noted Improve Unacceptable
Exec
Report
Discover
Relationships
Create
Models
Evaluate &
Improve
Provide
Solution
Research &
Extend
Brief
Comments Read these notes as we are really trying to help you out!
Remember: If it is not in this report, it does not exist and does not get marked!
You can use the above form to estimate the expected mark against the rubric (see the assignment “info”
document). Be realistic and note that we will find many problems you may not be aware of.
Assume that markers may be tired when assessing your work and they may miss some important aspects of
your submission when not presented clearly, or when you deviate from the structure of this template, or if you
do not include them in your report. So be clear, number all tables, charts and screen shots used as evidence,
describe all visuals, cross-reference your analysis with evidence.
Submit this report in PDF format to avoid accidental reformatting of the content.
Submit all RapidMiner processes (.RMP files) in a separate ZIP archive, so that if there is any doubt we could
load your work and replicate your results (we will not do this to find missing report parts).
Ensure that the report is readable and the font is no smaller than Arial 10 points. In the report include only the
most significant results for your analysis and recommendations.
You will be able to submit your work once only so make sure you get it right – check these before posting on
CloudDeakin: Is this your document? Is this the correct unit, assignment, year and trimester? Is your name
entered above? Is the group number included and is it correct? Are names of your group members entered as
well? Are all pages included? Does it all fit into the required page limit? Have you zipped all RapidMiner files
(.RMP files)? Is the report contents yours alone?
Then after the submission – check these: Has the PDF report been submitted? Has the Zip archive of RMP files
been submitted? Can you retrieve and reopen both back from your submission folder?
Note that the late penalty will be calculated on the date and time of the last submitted file.
Finally, as all reports will be inspected for plagiarism, ensure that your analysis, your evidence, your way of
thinking, your report and its presentation are unique and demonstrate your ability to create it all independently.
So if you work in a team compare your submission to those of your team members and make it quite distinct in
both contents and form. Any part of this report that bears any resemblance to another students’ report or any
information source written by others or by you for another unit (e.g. on the web) will be treated as plagiarism.
Total
1 of 8
tabler-icon-diamond-filled.svg

Secure Best Marks with AI Grader

Need help grading? Try our AI Grader for instant feedback on your assignments.
Document Page
MIS772 Predictive Analytics (2019 T1) Individual Assignment A1-LP2 / Workshops M1T1-M1T4
Executive summary (one page)
Expectation
Australian Wine Importers (AWI) wants to gather knowledge about the different
wines imported in Australia. Some of these facts include the origin and marketability of the wine.
They also want to know about the best wine from a specific source and a specific price range,
and finally the want to know if the wine tasters that were used to establish the wine ratings can
actually be trusted with the tasting results. We have to visualize, explore and report the observed
patterns in the given data set to come up with insights that will help AWI make decisions about
the future.
Solution to business problem
We prepared the data by removing useless attributes and replacing the missing
values, and we selected the attributes we would require for the analysis, since we are only
required to use the non-text attributes for the analysis we are only left with two columns that we
can actually use, which are price and points. Price is the cost of wine is USD whereas the points
are the rating given to each wine by the wine tasters.
The goal of this of this project is to develop a data mining method for the provided
wine data. The American wine importers asked the user to develop a data mining method for
classifying the imported wines. And, the American wine exporters is needs to clean-up and
explore the wine tasting data, then evaluate and develop a classifier to determine the price range
for the new wines and also wishes to minimize the classification problems.
In wine export, the most common problems is funding growth and many wine
businesses need support to enable them to fulfil their export and export-related contracts. So,
each province is introducing new measures all favouring their domestic producers and they differ
between provinces. By developing data mining method for the provided wine data with detailed
funding projections, it is possible to ensure that the user is able to plan and manage your funding
accordingly, to avoid problems. Therefore, classifier is being developed to determine the price
range for new wines by using the Rapid Miner data mining tool. To develop the classifier, a new
model is created for the provided wine data, by using the two main methods of data mining
namely- Random tree and decision tree. And, also it evaluates and validates the created model.
2 of 8
Document Page
MIS772 Predictive Analytics (2019 T1) Individual Assignment A1-LP2 / Workshops M1T1-M1T4
3 of 8
Document Page
MIS772 Predictive Analytics (2019 T1) Individual Assignment A1-LP2 / Workshops M1T1-M1T4
Discovering Relationships and Data Transformation in RapidMiner (one page)
By analyzing the data, the relationship between the data attributes will be discovered. To discover the
relationship and data transformation for provided data by create correlation matrix. It is illustrated as
below.
To create the correlation matrix by choose the label attribute and it was mentioned in the case study that we need to
evaluate recommendations. The correlation matrix is illustrated as below.
The below bar chart is used to display the all the attribute arranged according to their correlation.
4 of 8
tabler-icon-diamond-filled.svg

Secure Best Marks with AI Grader

Need help grading? Try our AI Grader for instant feedback on your assignments.
Document Page
MIS772 Predictive Analytics (2019 T1) Individual Assignment A1-LP2 / Workshops M1T1-M1T4
Create a Model(s) in RapidMiner (one page limit)
Here, we are creating the Model for wines data by using the Rapid Miner data
mining tool. It uses the Decision tree and random tree modelling techniques. The creation model
is illustrated below.
To create the model, first read the data. Then, filter all the missing values so that
our data that might interfere with our model results. After, we are use set role operator to define
our label attribute which we want to predict. Next we select the attributes we want to include as
predict that we mentioned previously. The decision tree is illustrated as below.
While creating the decision, we are using the accuracy parameters because we
want to measure the accuracy of the predictors and how good they perform. Depth and all the
other parameters are kept as default. Decision tree is used to provide an effective model for the
Australian wine exporters because it has effectively predicted the price ranges based on the
Provinces and points. This model is used to determine the wine exporters’ funding growth based
on the wine data price and winery attributes.
5 of 8
Document Page
MIS772 Predictive Analytics (2019 T1) Individual Assignment A1-LP2 / Workshops M1T1-M1T4
Evaluate and Improve the Model(s) in RapidMiner (one page)
To evaluate the created model by using the R2 performance this is Apply model and
Performance operators. These two operators are used to provide the effective results for wine
data. Apply model is one of evaluation model in the Rapid Miner. To evaluate the overall
performance for created models by uses the performance operators. It is illustrated as below.
The performance operator is used to evaluate the statistical performance evolution
of the provided wine data. It is used to deliver a list of performance criteria values of the
classification task. This is only used for classification task. The performance operator input is
based on the apply model. The performance operator provides the input port exporters as
labelled as example set. The performance operator is used to deliver the performance vector.
The performance vector is used to list the performance criteria values for the provided data. It is
calculated on the basic of the label attributes which is winery and prediction attributes which is
price.
The performance vector output provides the example set that was given as input is
passed without changing the output through this port. It provides that the output is based on two
parameters such as Accuracy and Kappa attributes. The accuracy parameter is used to display
the percentage of predictions. The kappa parameters are used to measure the simple
percentage of correct prediction calculation and it takes into account the correct prediction
occurring by chance.
6 of 8
Document Page
MIS772 Predictive Analytics (2019 T1) Individual Assignment A1-LP2 / Workshops M1T1-M1T4
Deployment in RapidMiner (one page)
The cross validation is used to estimate the statistical performance of a models. It
has two sub processes such as training and testing sub processes. It takes input as training and
test sub processes. It delivers the output is based on prediction model trained on the whole
example set.
Basically, the decision tree uses the four criteria, here we are using the accuracy
criteria to provide the accurate prediction of the models and it is applied on Example sets with
numerical attributes, but only on the nominal attributes. It has delivered outputs such as decision
tree and example set.
Based on the performance from Cross Validation, The Cross Validation not only
gives a good estimation of the performance of model on the unseen data, but it also gives the
standard deviation of this estimation. The above mentioned performance on the wine data inside
this estimation, and the performance on the data are effected by over fitting. The data preparation
is analysed by using the Kaggle website. The deployment of created model is illustrated as
below.
7 of 8
tabler-icon-diamond-filled.svg

Paraphrase This Document

Need a fresh take? Get an instant paraphrase of this document with our AI Paraphraser
Document Page
MIS772 Predictive Analytics (2019 T1) Individual Assignment A1-LP2 / Workshops M1T1-M1T4
Further Research and Extensions in RM (one page)
Based on the overall created classification models, it is used to provide the effective
outcomes are provided for the wine data and also it delivers the expected price range category
of the wine which is newly introduced to the Australia market, and it is identified by the decision
tree model. The decision tree model is clearly shows the price ranges based on winery. And, all
the wine tasters in the data set trust their tasting results based on the created models. These
created models are evaluated and validated the tasting results and price ranges. To see the
overall visualization of our model by using the performance and cross validation models. User
did not conducted independent research in the area related to the analysed data set to
determine if your predictions are able to confirm or extend previously published results.
8 of 8
chevron_up_icon
1 out of 8
circle_padding
hide_on_mobile
zoom_out_icon
logo.png

Your All-in-One AI-Powered Toolkit for Academic Success.

Available 24*7 on WhatsApp / Email

[object Object]