MIS772 Predictive Analytics Assignment A1: Classification Report

Verified

Added on  2022/10/04

|8
|2364
|19
Report
AI Summary
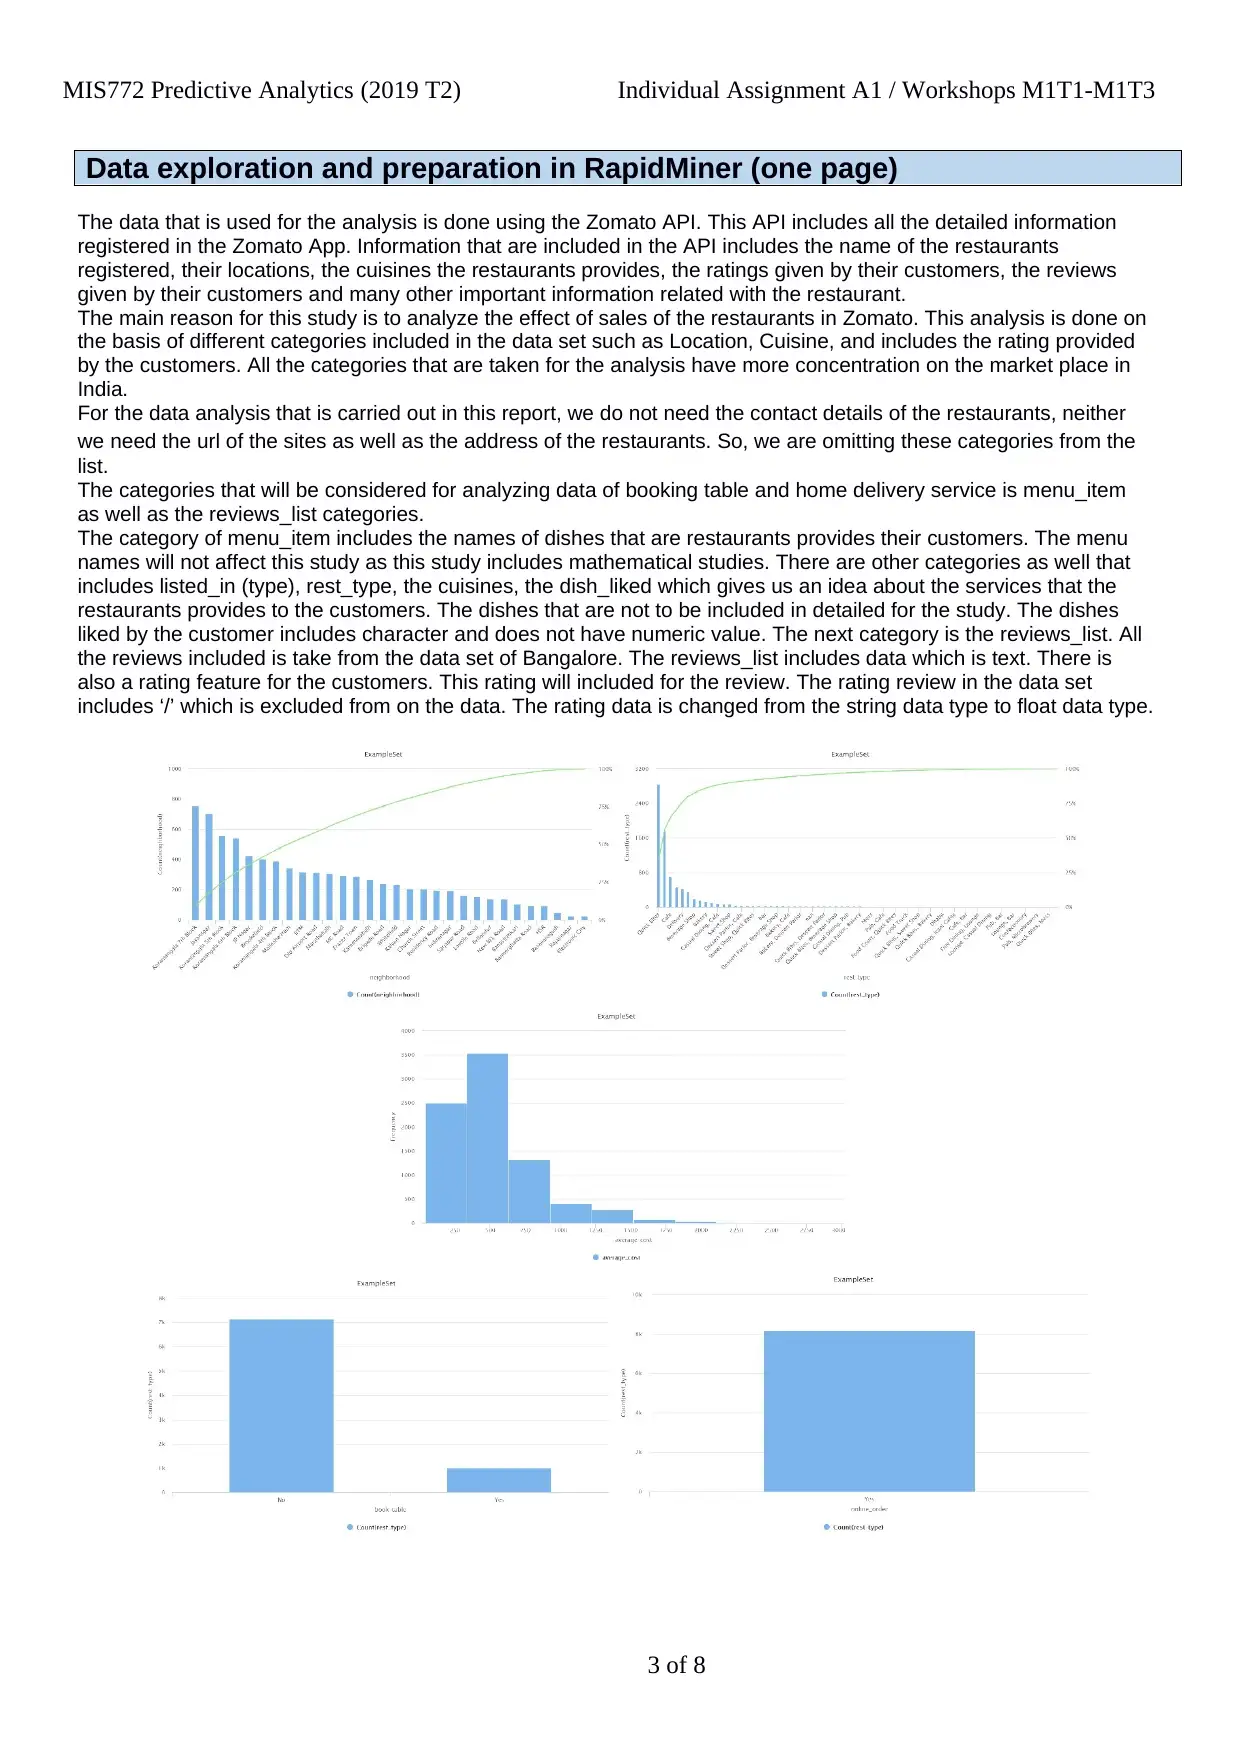
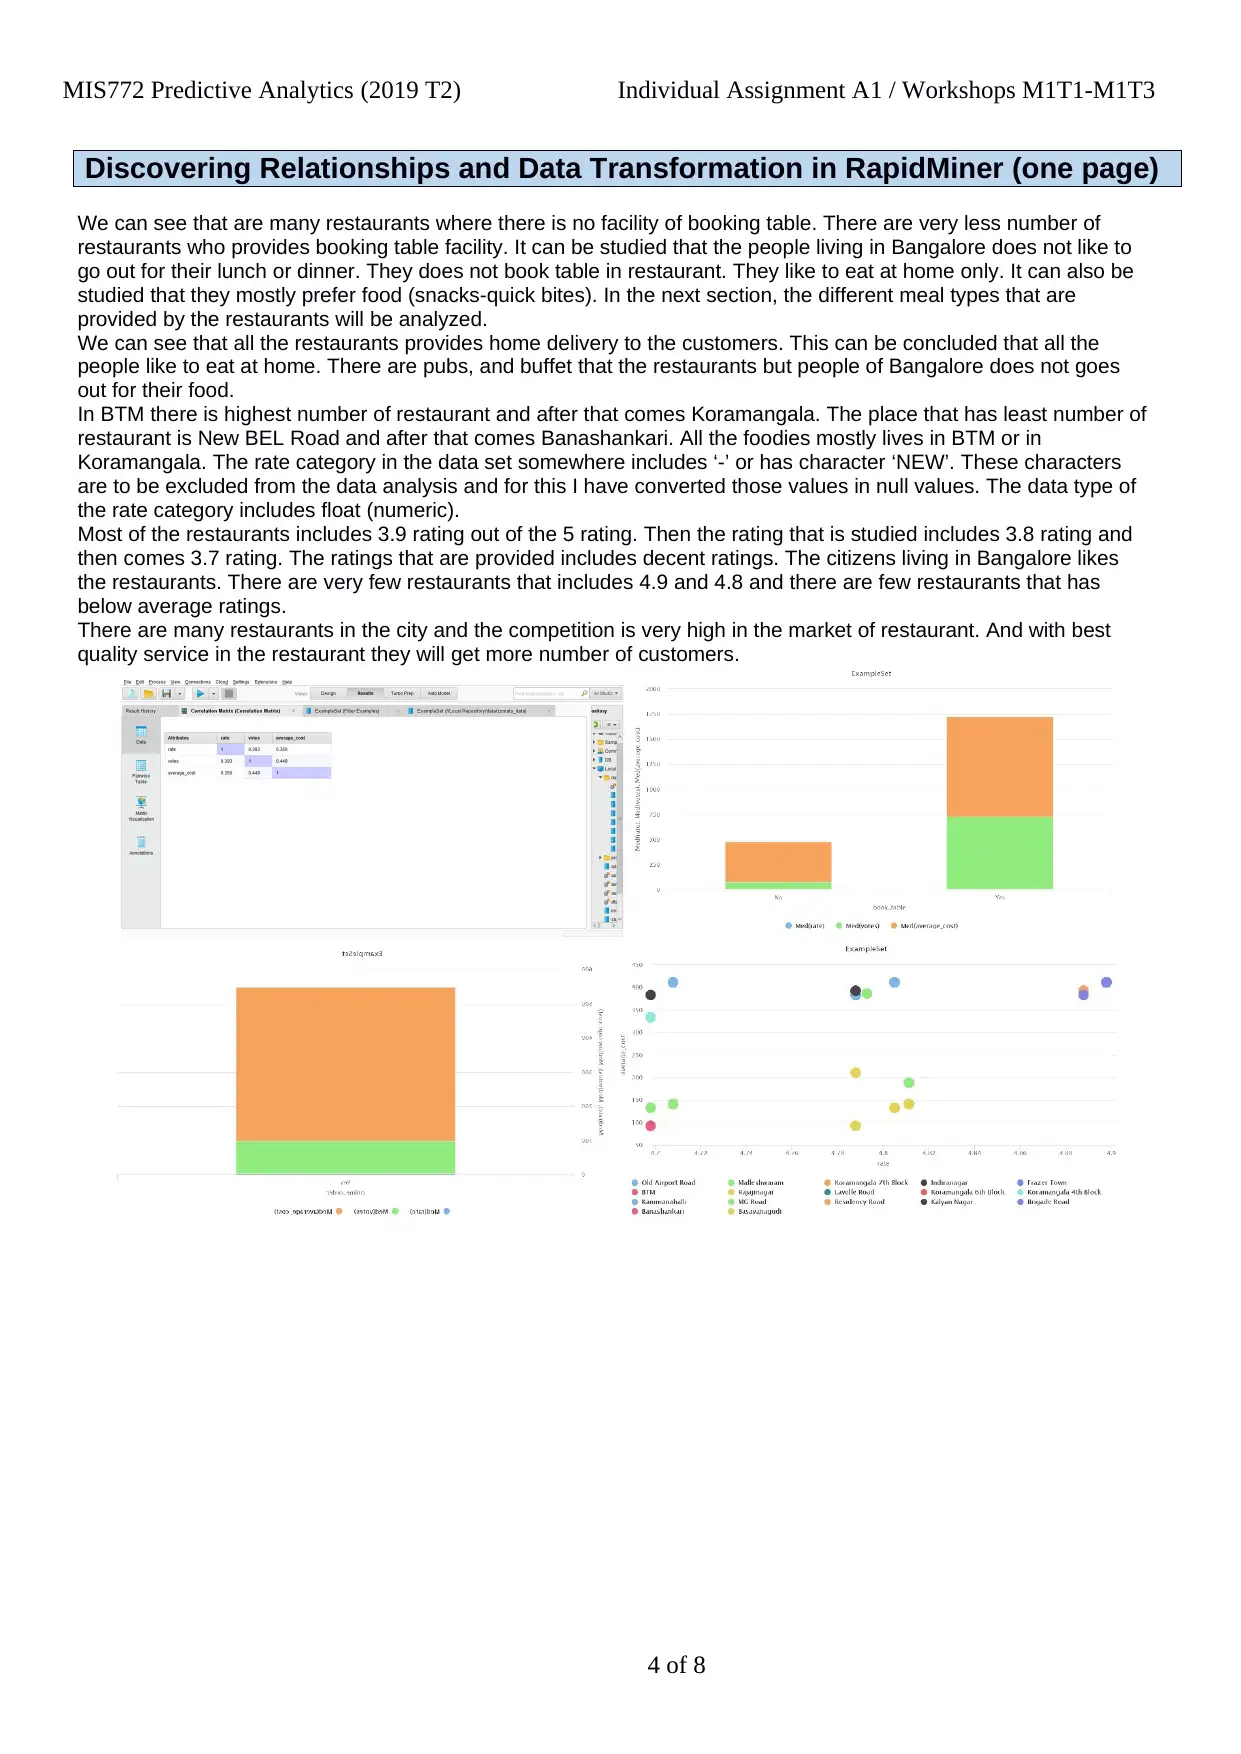
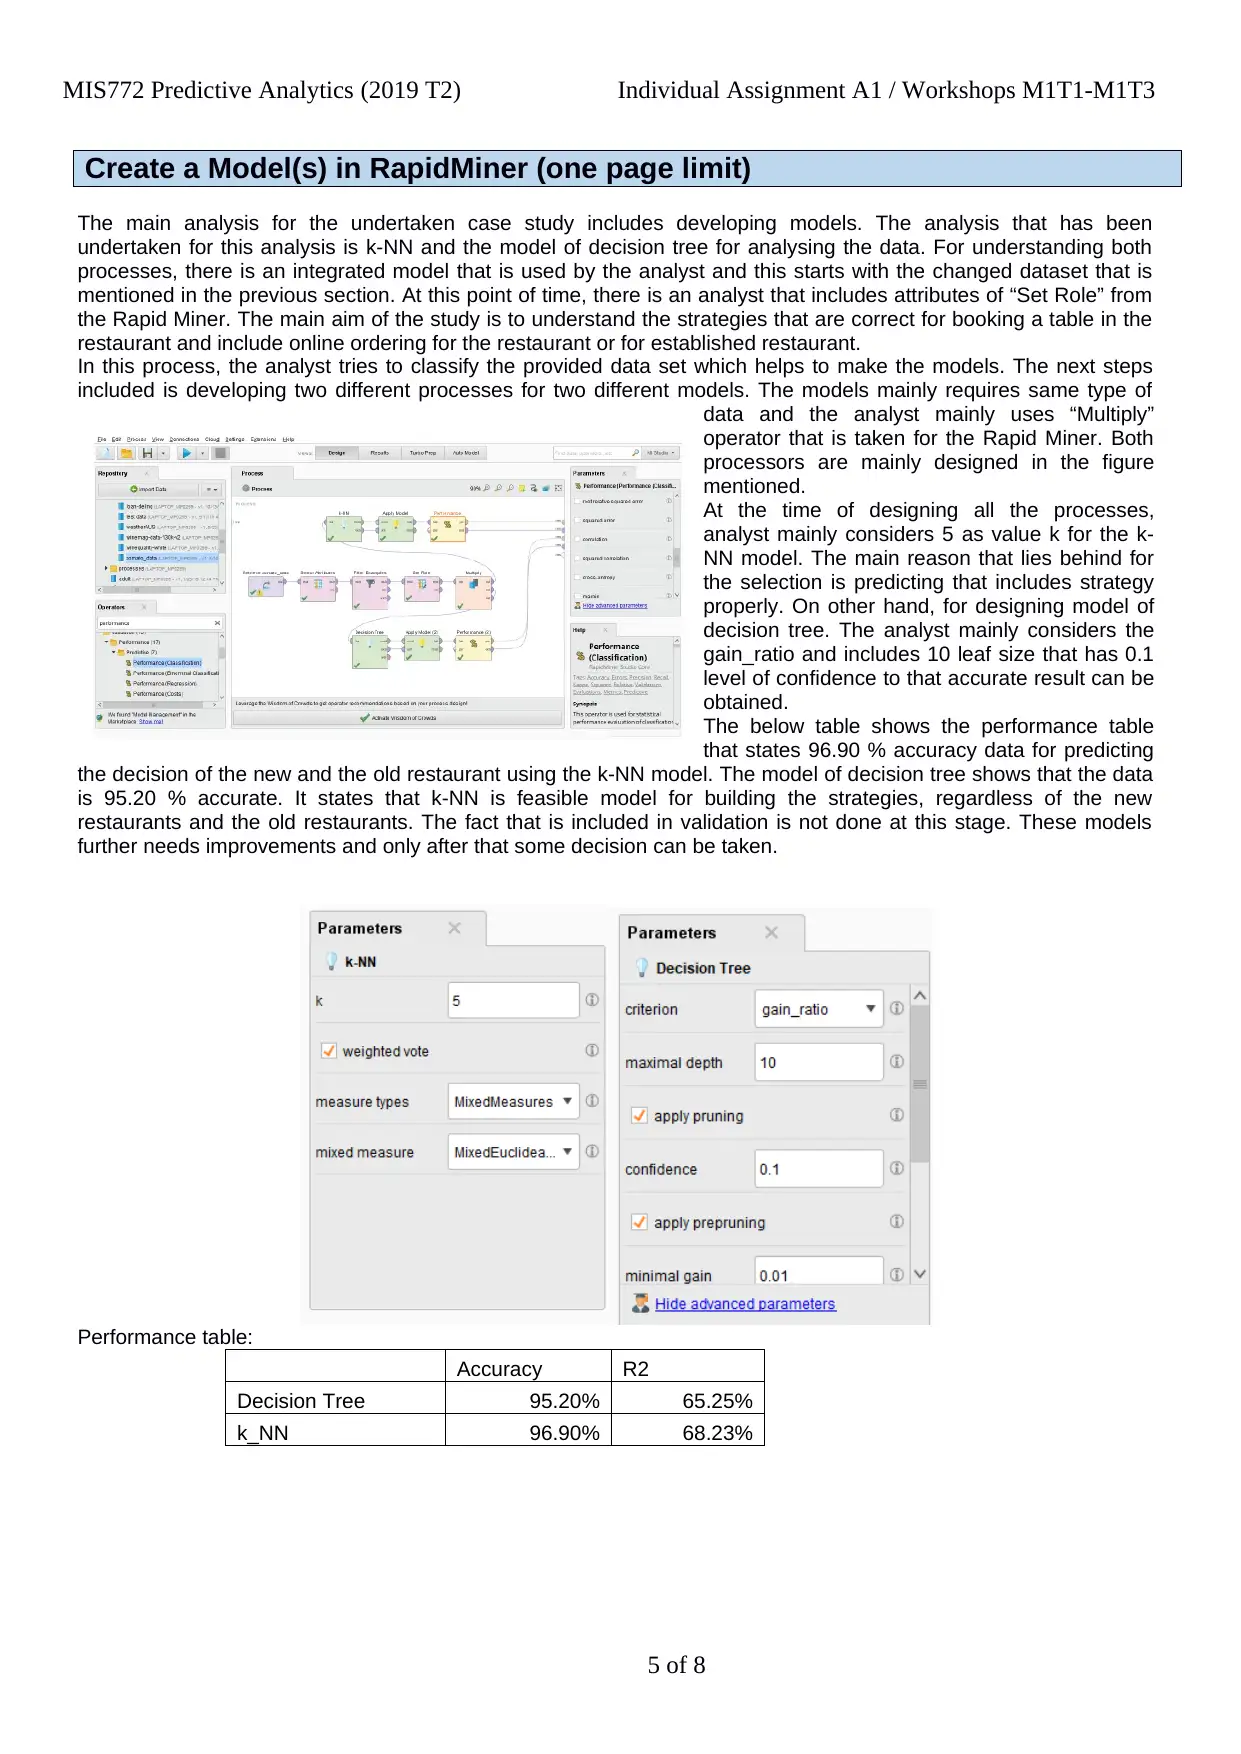
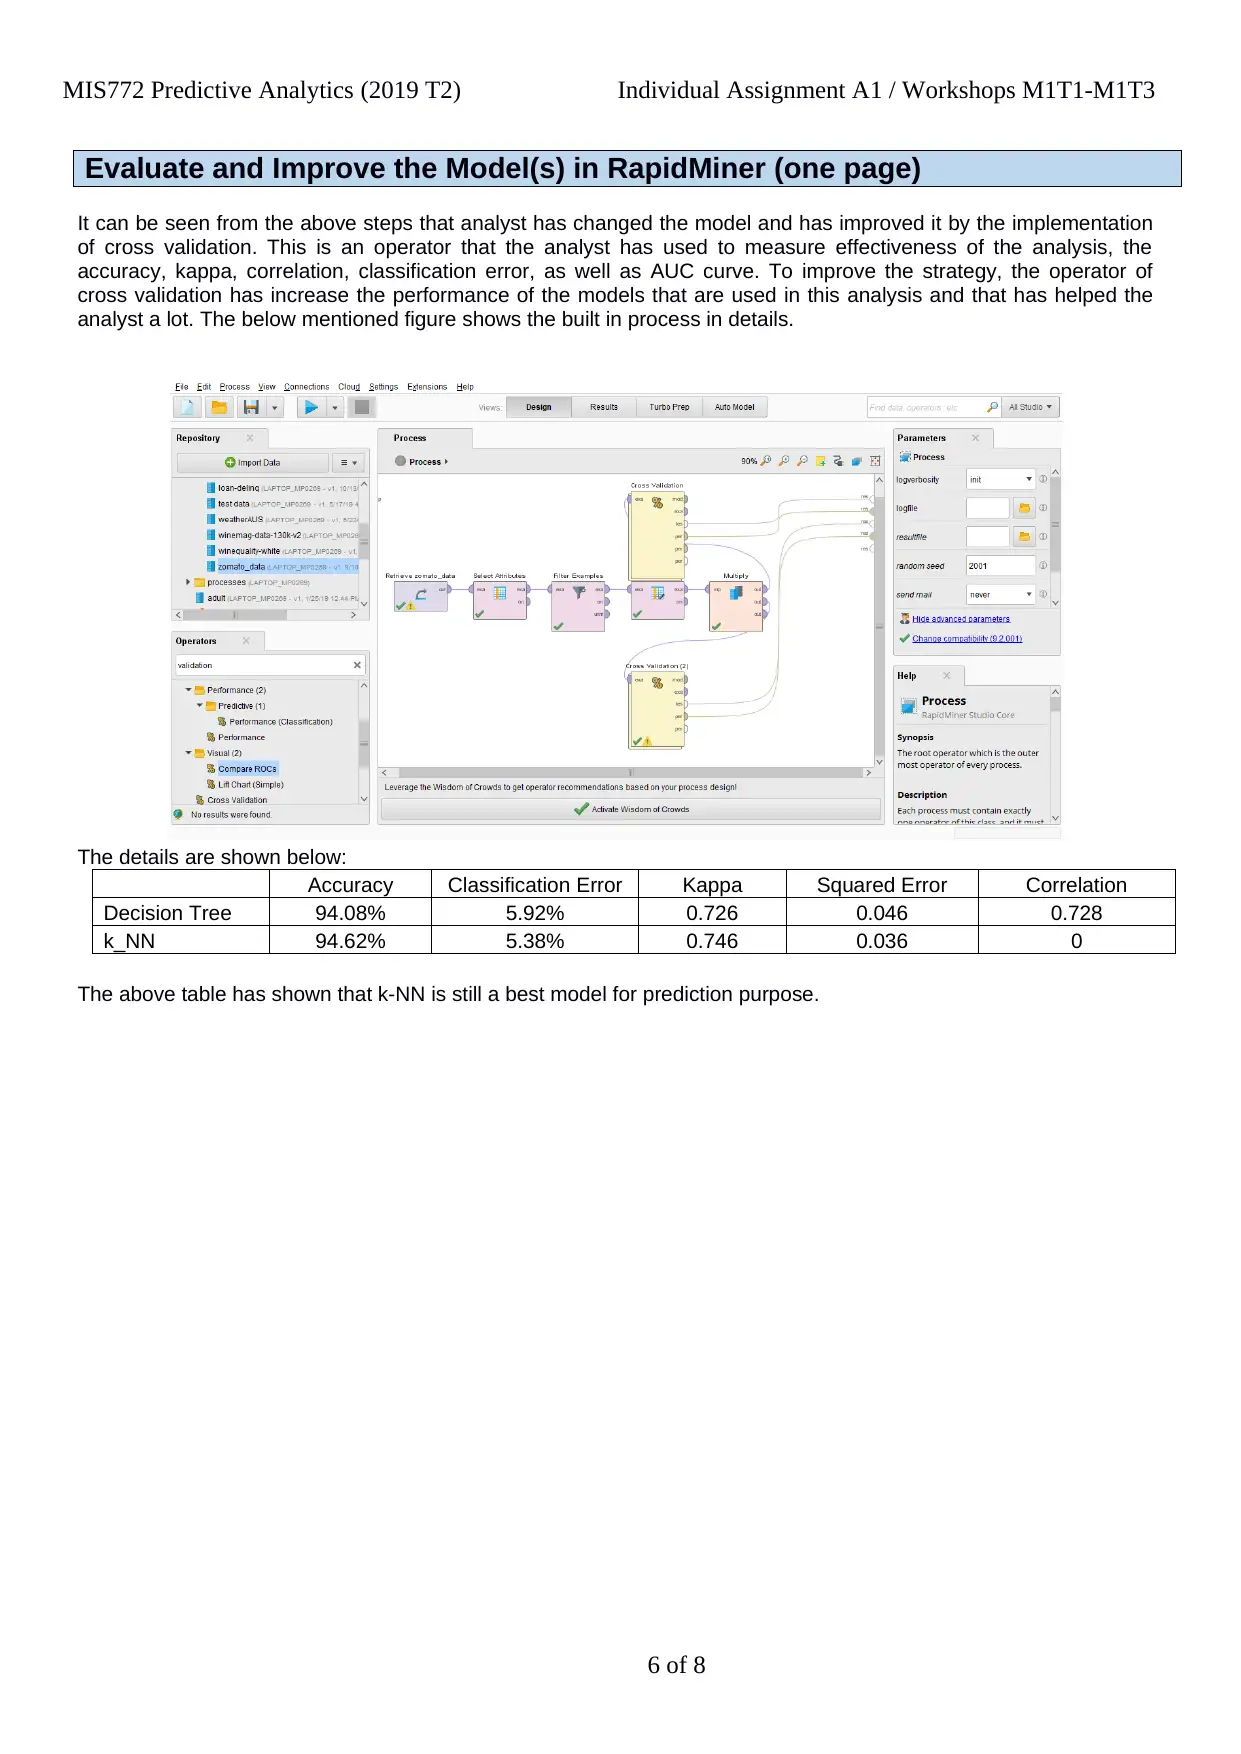
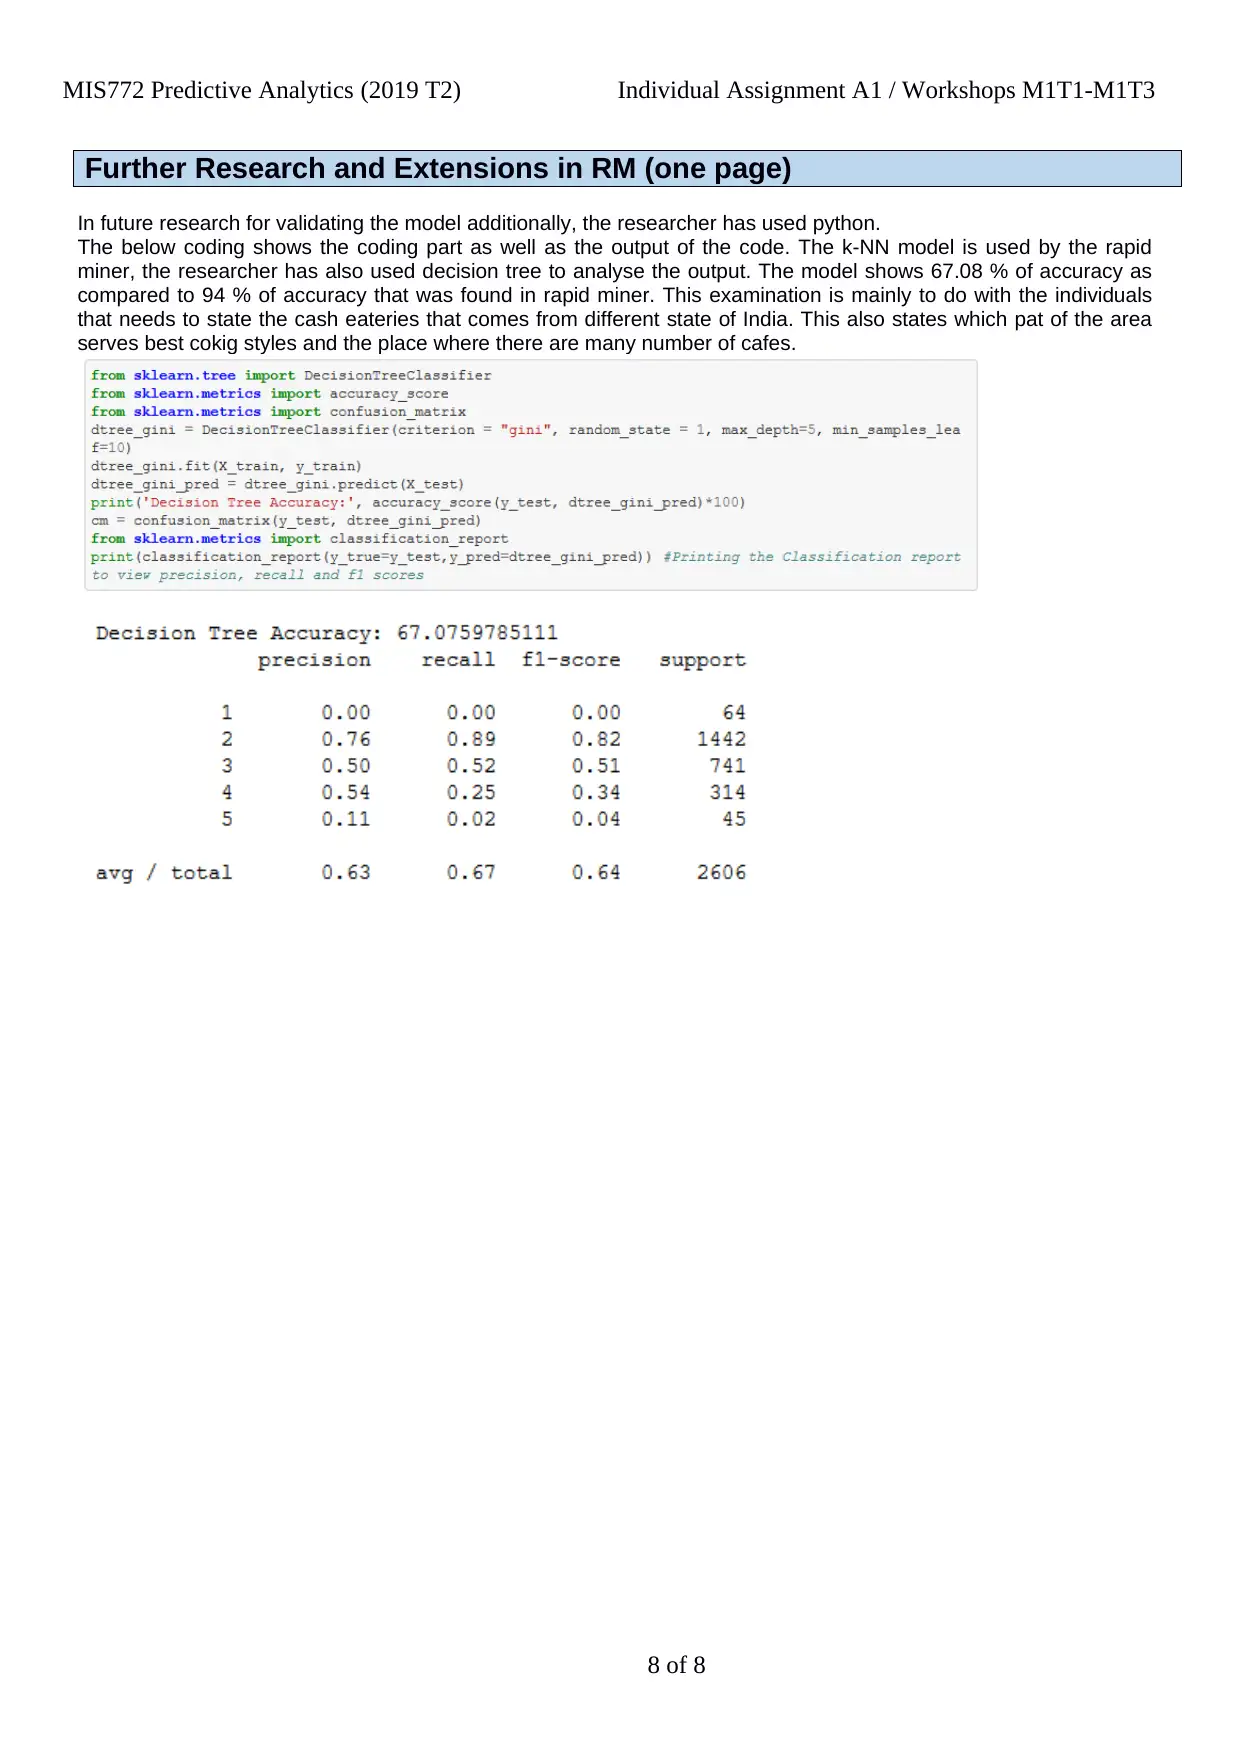
This report presents an analysis of Zomato restaurant data using RapidMiner, focusing on classification modeling. The study begins with an executive summary providing an overview of the Zomato platform and its data. The report then details data exploration and preparation, including handling missing values and data errors. It describes the process of discovering relationships within the data, transforming attributes, and selecting relevant features for prediction. The core of the analysis involves creating and comparing two classification models: k-NN and a decision tree. The report outlines the model building process, including parameter selection and performance metrics. It then evaluates and improves the models using cross-validation techniques, comparing their accuracy, classification error, and other performance indicators. The report concludes with a discussion of deployment strategies and insights derived from the analysis, such as the popularity of specific cuisines and the impact of online services. The findings suggest the effectiveness of the k-NN model and provide recommendations for improving restaurant strategies within the Zomato platform. The report is based on the MIS772 Predictive Analytics assignment for Deakin University and includes all necessary processes in RapidMiner.
Document Page
MIS772 Predictive Analytics (2019 T2) Individual Assignment A1 / Workshops M1T1-M1T3
Assignment A1-LP2: Classification
Student
Name
(as per record) Student No Student number
My other group members A1
Group No
As per CloudDeakin group
number
Team
Names
(as per record) Student Nos Student number
(as per record) Student number
Exceptional Meets expectations Issues noted Improve Unacceptable
Exec
Report
Use this area to self-assess your submission
Explore
Attributes
Be realistic as we will find problems in your work that you may not be aware of
Discover
Relationships
Create
Models
Evaluate &
Improve
Provide
Solution
Research &
Extend
Brief
Comments
Read these notes as we are really trying to help you out!
Remember: If it is not in this report, it does not exist and does not get marked!
Assume that markers could miss some important aspects of your submission unless presented clearly, or when
you deviate from the structure of this template (for which you will be penalised). So be clear, number tables,
charts and screen shots used as evidence, annotate all visuals, cross-reference your analysis with evidence.
Use the A1 Word template to prepare this report. Submit it in PDF format to avoid its accidental reformatting.
Submit all RM processes (.RMP files only – not the whole project directory or data) in a separate ZIP archive.
Only work submitted via CloudDeakin assignment box will be marked (not via email or any other way).
Ensure that the report is readable and the font is no smaller than Arial 10 points. Include only the most relevant
and significant results for your analysis and recommendations.
You will be able to submit your work as many times until deadline. We will mark the last complete submission,
i.e. the report in PDF and the ZIP-ped RapidMiner processes.
Go over this checklist: Is this your document? Does it report your work and your work only? Is this the correct
unit, assignment, year and trimester? Is your name entered above? Is the group number included and is it
correct? Are names of your group members entered as well? Are all pages included? Are all report sections
within the required page limit?
Then after the submission – check these: Was it lodged on time? Has the PDF report been submitted? Has the
Zip archive of RMP files been submitted? Can you retrieve and reopen both back from your submission folder?
We will be checking your work for plagiarism! If any parts of your work (report, screen shots or RM
processes) bear any resemblance to another students’ work, or by you for another unit, or anything
written by others without acknowledgement (e.g. on the web), it will be treated as plagiarism.
Total
Executive summary (one page)
Zomato is a search engine for Indian restaurants and operates over 24 countries in India. This application provides
information as well as reviews for all the restaurants who are registered in Zomato. The customers provides reviews
1 of 8
tabler-icon-diamond-filled.svg

Paraphrase This Document

Need a fresh take? Get an instant paraphrase of this document with our AI Paraphraser
Document Page
MIS772 Predictive Analytics (2019 T2) Individual Assignment A1 / Workshops M1T1-M1T3
and ratings for the restaurants they visit. This website includes information related to all the restaurants registered
and includes images of foods and the restaurants for providing better customer service.
2 of 8
Document Page
MIS772 Predictive Analytics (2019 T2) Individual Assignment A1 / Workshops M1T1-M1T3
Data exploration and preparation in RapidMiner (one page)
The data that is used for the analysis is done using the Zomato API. This API includes all the detailed information
registered in the Zomato App. Information that are included in the API includes the name of the restaurants
registered, their locations, the cuisines the restaurants provides, the ratings given by their customers, the reviews
given by their customers and many other important information related with the restaurant.
The main reason for this study is to analyze the effect of sales of the restaurants in Zomato. This analysis is done on
the basis of different categories included in the data set such as Location, Cuisine, and includes the rating provided
by the customers. All the categories that are taken for the analysis have more concentration on the market place in
India.
For the data analysis that is carried out in this report, we do not need the contact details of the restaurants, neither
we need the url of the sites as well as the address of the restaurants. So, we are omitting these categories from the
list.
The categories that will be considered for analyzing data of booking table and home delivery service is menu_item
as well as the reviews_list categories.
The category of menu_item includes the names of dishes that are restaurants provides their customers. The menu
names will not affect this study as this study includes mathematical studies. There are other categories as well that
includes listed_in (type), rest_type, the cuisines, the dish_liked which gives us an idea about the services that the
restaurants provides to the customers. The dishes that are not to be included in detailed for the study. The dishes
liked by the customer includes character and does not have numeric value. The next category is the reviews_list. All
the reviews included is take from the data set of Bangalore. The reviews_list includes data which is text. There is
also a rating feature for the customers. This rating will included for the review. The rating review in the data set
includes ‘/’ which is excluded from on the data. The rating data is changed from the string data type to float data type.
3 of 8
Document Page
MIS772 Predictive Analytics (2019 T2) Individual Assignment A1 / Workshops M1T1-M1T3
Discovering Relationships and Data Transformation in RapidMiner (one page)
We can see that are many restaurants where there is no facility of booking table. There are very less number of
restaurants who provides booking table facility. It can be studied that the people living in Bangalore does not like to
go out for their lunch or dinner. They does not book table in restaurant. They like to eat at home only. It can also be
studied that they mostly prefer food (snacks-quick bites). In the next section, the different meal types that are
provided by the restaurants will be analyzed.
We can see that all the restaurants provides home delivery to the customers. This can be concluded that all the
people like to eat at home. There are pubs, and buffet that the restaurants but people of Bangalore does not goes
out for their food.
In BTM there is highest number of restaurant and after that comes Koramangala. The place that has least number of
restaurant is New BEL Road and after that comes Banashankari. All the foodies mostly lives in BTM or in
Koramangala. The rate category in the data set somewhere includes ‘-’ or has character ‘NEW’. These characters
are to be excluded from the data analysis and for this I have converted those values in null values. The data type of
the rate category includes float (numeric).
Most of the restaurants includes 3.9 rating out of the 5 rating. Then the rating that is studied includes 3.8 rating and
then comes 3.7 rating. The ratings that are provided includes decent ratings. The citizens living in Bangalore likes
the restaurants. There are very few restaurants that includes 4.9 and 4.8 and there are few restaurants that has
below average ratings.
There are many restaurants in the city and the competition is very high in the market of restaurant. And with best
quality service in the restaurant they will get more number of customers.
4 of 8
tabler-icon-diamond-filled.svg

Paraphrase This Document

Need a fresh take? Get an instant paraphrase of this document with our AI Paraphraser
Document Page
MIS772 Predictive Analytics (2019 T2) Individual Assignment A1 / Workshops M1T1-M1T3
Create a Model(s) in RapidMiner (one page limit)
The main analysis for the undertaken case study includes developing models. The analysis that has been
undertaken for this analysis is k-NN and the model of decision tree for analysing the data. For understanding both
processes, there is an integrated model that is used by the analyst and this starts with the changed dataset that is
mentioned in the previous section. At this point of time, there is an analyst that includes attributes of “Set Role” from
the Rapid Miner. The main aim of the study is to understand the strategies that are correct for booking a table in the
restaurant and include online ordering for the restaurant or for established restaurant.
In this process, the analyst tries to classify the provided data set which helps to make the models. The next steps
included is developing two different processes for two different models. The models mainly requires same type of
data and the analyst mainly uses “Multiply”
operator that is taken for the Rapid Miner. Both
processors are mainly designed in the figure
mentioned.
At the time of designing all the processes,
analyst mainly considers 5 as value k for the k-
NN model. The main reason that lies behind for
the selection is predicting that includes strategy
properly. On other hand, for designing model of
decision tree. The analyst mainly considers the
gain_ratio and includes 10 leaf size that has 0.1
level of confidence to that accurate result can be
obtained.
The below table shows the performance table
that states 96.90 % accuracy data for predicting
the decision of the new and the old restaurant using the k-NN model. The model of decision tree shows that the data
is 95.20 % accurate. It states that k-NN is feasible model for building the strategies, regardless of the new
restaurants and the old restaurants. The fact that is included in validation is not done at this stage. These models
further needs improvements and only after that some decision can be taken.
Performance table:
Accuracy R2
Decision Tree 95.20% 65.25%
k_NN 96.90% 68.23%
5 of 8
Document Page
MIS772 Predictive Analytics (2019 T2) Individual Assignment A1 / Workshops M1T1-M1T3
Evaluate and Improve the Model(s) in RapidMiner (one page)
It can be seen from the above steps that analyst has changed the model and has improved it by the implementation
of cross validation. This is an operator that the analyst has used to measure effectiveness of the analysis, the
accuracy, kappa, correlation, classification error, as well as AUC curve. To improve the strategy, the operator of
cross validation has increase the performance of the models that are used in this analysis and that has helped the
analyst a lot. The below mentioned figure shows the built in process in details.
The details are shown below:
Accuracy Classification Error Kappa Squared Error Correlation
Decision Tree 94.08% 5.92% 0.726 0.046 0.728
k_NN 94.62% 5.38% 0.746 0.036 0
The above table has shown that k-NN is still a best model for prediction purpose.
6 of 8
Document Page
MIS772 Predictive Analytics (2019 T2) Individual Assignment A1 / Workshops M1T1-M1T3
Deployment in RapidMiner (one page)
From the analysis, it is clear that most of the restaurants provides North Indian food. So, it can be concluded that
though Bnaglore is situated in South of India, the people there like to eat North Indian foods. The people who live in
Bangalore comes from all over India and this was stated at the beginning of this analysis. So, the people living in
Bangalore mostly like to have Chinese foods and North India dishes. These cuisines are served by most of the
restaurants in Bangalore. There are many Indians also who likes to eat Chinese foods. Noting that cooking styles in
the restaurants helps to highlight the less remarkable qualities about the food. Indian culture contains different mixes
of food.
From the analysis, it can be seen that there are very less number of restaurants that serve just North Indian and
Chinese and Continental and Biryani.
The food that are sold in Bangalore restaurants are mostly Indians and they need to improve American cooking that
is needed to be developed in the Zomato Application. The rating by the individuals includes larger part of cafes as
normal are is not appraised at all. This cannot be considered as the solid factor for examining the eatery
achievement. The restaurants who provides features like booking a table on web as well as requesting table on web
requesting a higher shot helps to accomplish the contrasted with the others. There are some extraordinary outcomes
that includes cities having many number of cafes and there are many noteworthy foodies in Bangalore. It can also be
concluded that that there are many restaurants that are well-appraised and the most cooking styles that has favoured
by many of individuals. There are even some extra ordinary restaurants and some of them are not good as well.
7 of 8
tabler-icon-diamond-filled.svg

Paraphrase This Document

Need a fresh take? Get an instant paraphrase of this document with our AI Paraphraser
Document Page
MIS772 Predictive Analytics (2019 T2) Individual Assignment A1 / Workshops M1T1-M1T3
Further Research and Extensions in RM (one page)
In future research for validating the model additionally, the researcher has used python.
The below coding shows the coding part as well as the output of the code. The k-NN model is used by the rapid
miner, the researcher has also used decision tree to analyse the output. The model shows 67.08 % of accuracy as
compared to 94 % of accuracy that was found in rapid miner. This examination is mainly to do with the individuals
that needs to state the cash eateries that comes from different state of India. This also states which pat of the area
serves best cokig styles and the place where there are many number of cafes.
8 of 8
chevron_up_icon
1 out of 8
circle_padding
hide_on_mobile
zoom_out_icon
[object Object]