Decision Modelling for Business Analytics Assignment - Finance Project

Verified

Added on  2022/09/17

|4
|1128
|18
Project
AI Summary
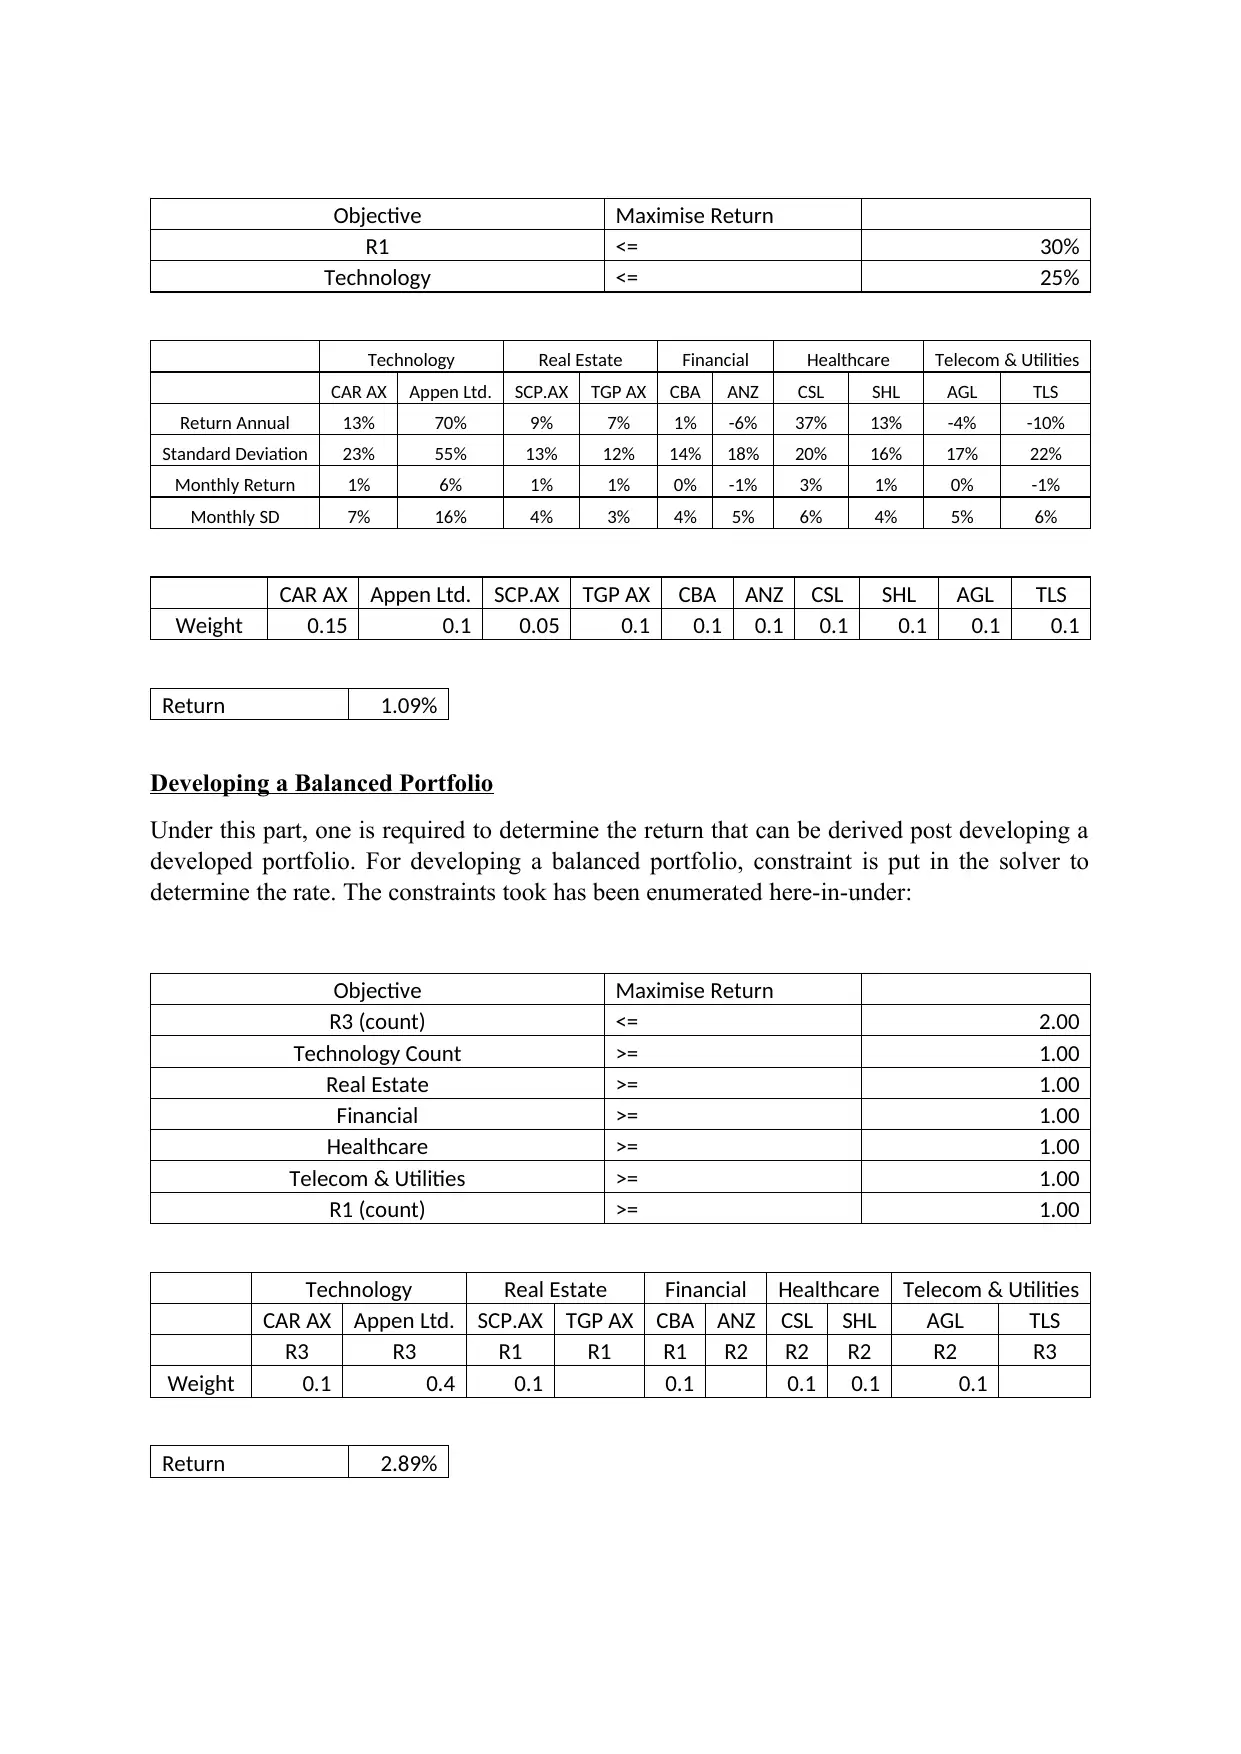
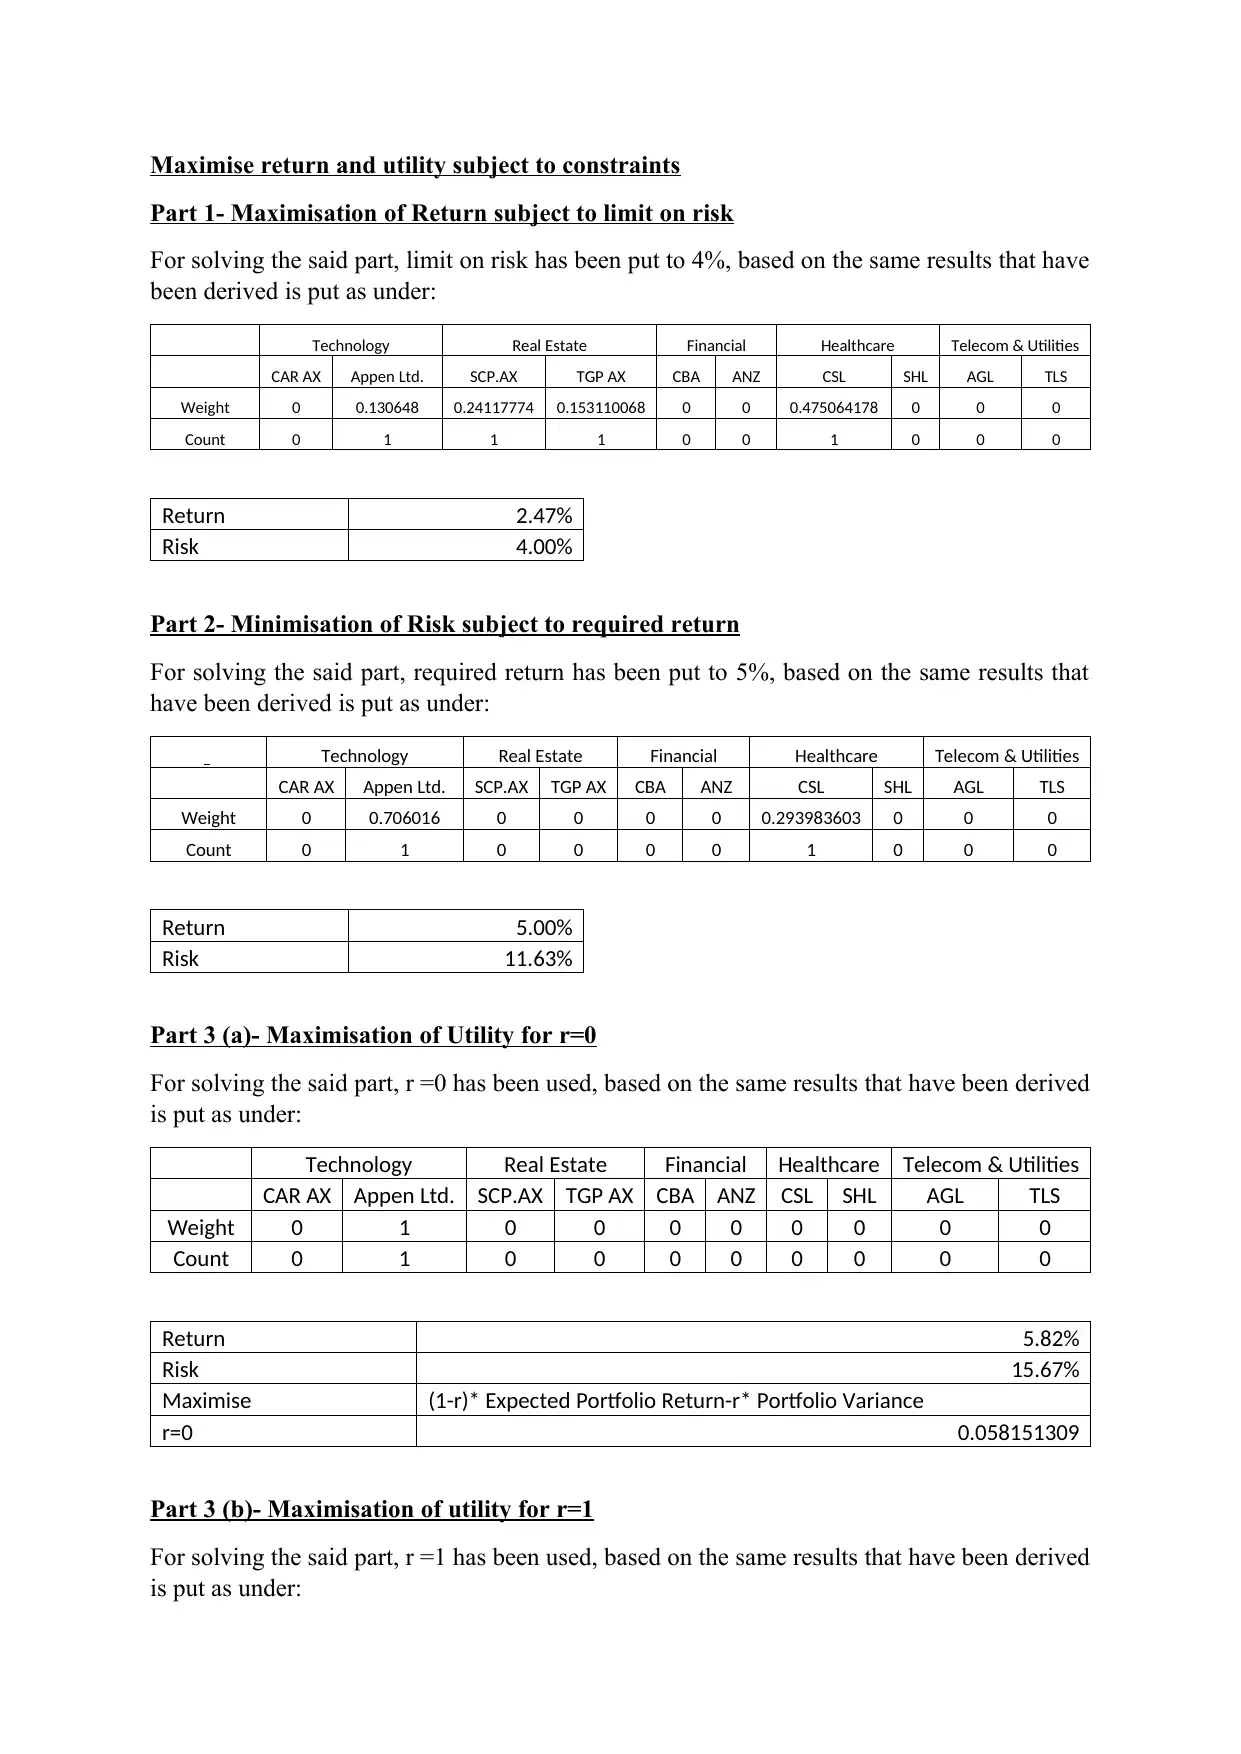
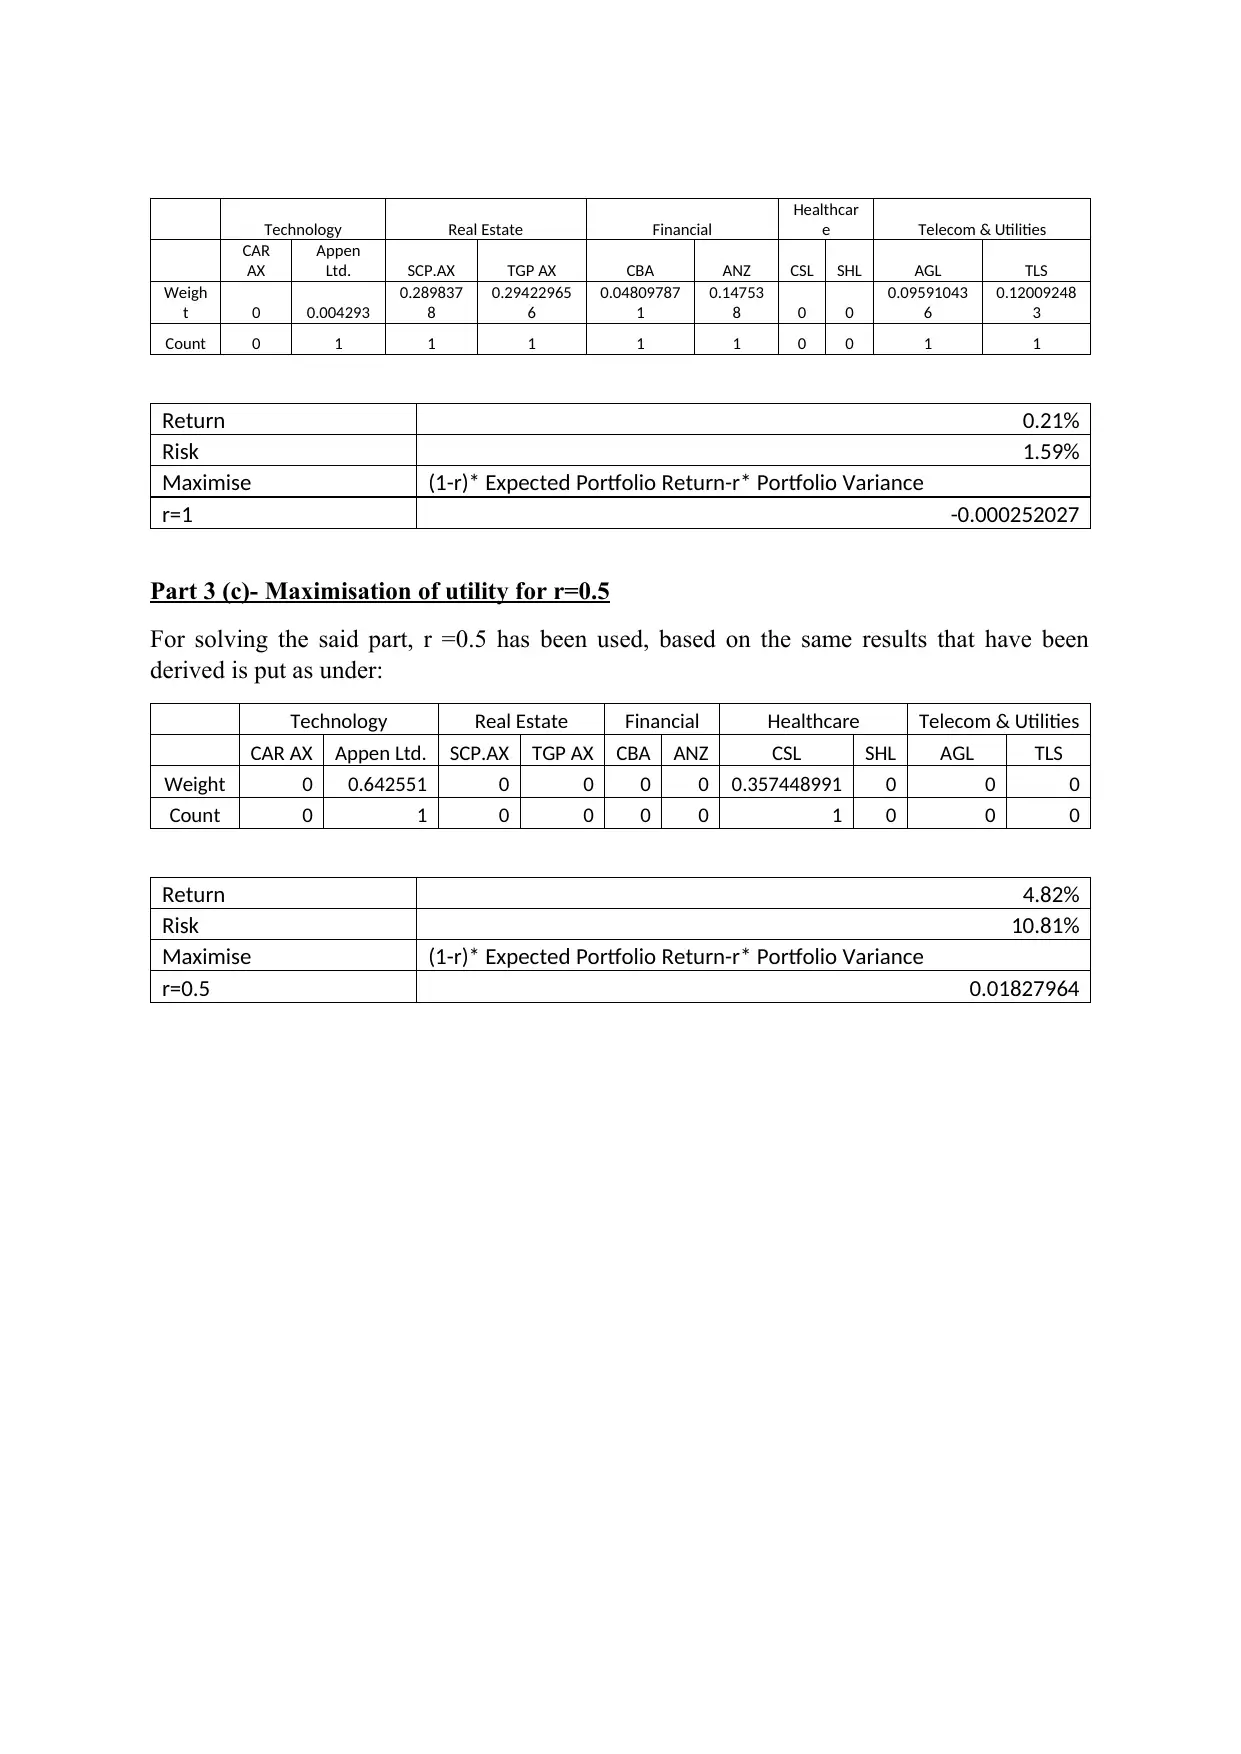
This assignment focuses on decision modelling for business analytics, specifically analyzing the return characteristics of a portfolio under various constraints using Excel's Solver tool. The analysis involves selecting companies from the Australian Stock Exchange, categorizing them based on risk, and determining portfolio returns under different constraints on risk and share categories. The project explores developing a balanced portfolio and maximizing return and utility, subject to specified constraints. It includes detailed calculations, risk assessments, and the application of optimization techniques to achieve the best possible financial outcomes. The assignment covers maximizing returns subject to risk limits, minimizing risk for required returns, and maximizing utility with different risk aversion levels, providing a comprehensive understanding of portfolio management and financial modeling.
tabler-icon-diamond-filled.svg

Contribute Materials

Your contribution can guide someone’s learning journey. Share your documents today.
Document Page
Decision Modelling for Business Analytics
Introduction
The purpose of this assignment is to analyse the return characteristic of the portfolio under
different constraints with the help of solver tool in excel. Further, the assignment also explore
the ways to maximise the utility. The assignment has the following parts:
(a) Selection of companies;
(b) Categorising the companies on the basis of risk
(c) Determining Return of the portfolio with constraint on risk and category of shares;
(d) Developing a Balanced Portfolio
(e) Maximise return and utility subject to constraints
Analysis
Selection of companies
The companies selected for analysis includes the following:
(a) Appen Limited: Technology Company Listed on Australian Stock Exchange;
(b) 360 Capital Group Limited: Real Estate Company Listed on Australian Stock
Exchange;
(c) Australia New Zealand Bank: Finance Company Listed on Australian Stock Exchange;
(d) Sonic Heath: Healthcare Company Listed on Australian Stock Exchange;
(e) Telstra: Telecom & Utilities co. Listed on Australian Stock Exchange
Categorising the companies on the basis of risk
The standard deviation of the stocks have been individually computed to understand the
volatility and risk each stock carries over the period of analysis. Further, the categorisation of
stock has been done on the basis of risk category which has been presented as under:
Technology Real Estate Financial Healthcare Telecom & Utilities
CAR AX Appen Ltd. SCP.AX TGP AX CBA ANZ CSL SHL AGL TLS
St dev 7% 16% 4% 3% 4% 5% 6% 4% 5% 6%
Annua
l 23% 55% 13% 12% 14% 18% 20% 16% 17% 22%
10-15% R1 SCP.AX TGP AX CBA
16-20% R2 ANZ CSL SHL AGL
21% & above R3 CAR AX Appen Ltd. TLS
Determining Return of the portfolio with constraint on risk and category of shares
Under this part, one is required to determine the return that can be derived putting constraint
on risk and category of shares. When such constraint is put the solver has been applied to
determine the rate. The constraints took has been enumerated here-in-under:
tabler-icon-diamond-filled.svg

Secure Best Marks with AI Grader

Need help grading? Try our AI Grader for instant feedback on your assignments.
Document Page
Objective Maximise Return
R1 <= 30%
Technology <= 25%
Technology Real Estate Financial Healthcare Telecom & Utilities
CAR AX Appen Ltd. SCP.AX TGP AX CBA ANZ CSL SHL AGL TLS
Return Annual 13% 70% 9% 7% 1% -6% 37% 13% -4% -10%
Standard Deviation 23% 55% 13% 12% 14% 18% 20% 16% 17% 22%
Monthly Return 1% 6% 1% 1% 0% -1% 3% 1% 0% -1%
Monthly SD 7% 16% 4% 3% 4% 5% 6% 4% 5% 6%
CAR AX Appen Ltd. SCP.AX TGP AX CBA ANZ CSL SHL AGL TLS
Weight 0.15 0.1 0.05 0.1 0.1 0.1 0.1 0.1 0.1 0.1
Return 1.09%
Developing a Balanced Portfolio
Under this part, one is required to determine the return that can be derived post developing a
developed portfolio. For developing a balanced portfolio, constraint is put in the solver to
determine the rate. The constraints took has been enumerated here-in-under:
Objective Maximise Return
R3 (count) <= 2.00
Technology Count >= 1.00
Real Estate >= 1.00
Financial >= 1.00
Healthcare >= 1.00
Telecom & Utilities >= 1.00
R1 (count) >= 1.00
Technology Real Estate Financial Healthcare Telecom & Utilities
CAR AX Appen Ltd. SCP.AX TGP AX CBA ANZ CSL SHL AGL TLS
R3 R3 R1 R1 R1 R2 R2 R2 R2 R3
Weight 0.1 0.4 0.1 0.1 0.1 0.1 0.1
Return 2.89%
Document Page
Maximise return and utility subject to constraints
Part 1- Maximisation of Return subject to limit on risk
For solving the said part, limit on risk has been put to 4%, based on the same results that have
been derived is put as under:
Technology Real Estate Financial Healthcare Telecom & Utilities
CAR AX Appen Ltd. SCP.AX TGP AX CBA ANZ CSL SHL AGL TLS
Weight 0 0.130648 0.24117774 0.153110068 0 0 0.475064178 0 0 0
Count 0 1 1 1 0 0 1 0 0 0
Return 2.47%
Risk 4.00%
Part 2- Minimisation of Risk subject to required return
For solving the said part, required return has been put to 5%, based on the same results that
have been derived is put as under:
Technology Real Estate Financial Healthcare Telecom & Utilities
CAR AX Appen Ltd. SCP.AX TGP AX CBA ANZ CSL SHL AGL TLS
Weight 0 0.706016 0 0 0 0 0.293983603 0 0 0
Count 0 1 0 0 0 0 1 0 0 0
Return 5.00%
Risk 11.63%
Part 3 (a)- Maximisation of Utility for r=0
For solving the said part, r =0 has been used, based on the same results that have been derived
is put as under:
Technology Real Estate Financial Healthcare Telecom & Utilities
CAR AX Appen Ltd. SCP.AX TGP AX CBA ANZ CSL SHL AGL TLS
Weight 0 1 0 0 0 0 0 0 0 0
Count 0 1 0 0 0 0 0 0 0 0
Return 5.82%
Risk 15.67%
Maximise (1-r)* Expected Portfolio Return-r* Portfolio Variance
r=0 0.058151309
Part 3 (b)- Maximisation of utility for r=1
For solving the said part, r =1 has been used, based on the same results that have been derived
is put as under:
Document Page
Technology Real Estate Financial
Healthcar
e Telecom & Utilities
CAR
AX
Appen
Ltd. SCP.AX TGP AX CBA ANZ CSL SHL AGL TLS
Weigh
t 0 0.004293
0.289837
8
0.29422965
6
0.04809787
1
0.14753
8 0 0
0.09591043
6
0.12009248
3
Count 0 1 1 1 1 1 0 0 1 1
Return 0.21%
Risk 1.59%
Maximise (1-r)* Expected Portfolio Return-r* Portfolio Variance
r=1 -0.000252027
Part 3 (c)- Maximisation of utility for r=0.5
For solving the said part, r =0.5 has been used, based on the same results that have been
derived is put as under:
Technology Real Estate Financial Healthcare Telecom & Utilities
CAR AX Appen Ltd. SCP.AX TGP AX CBA ANZ CSL SHL AGL TLS
Weight 0 0.642551 0 0 0 0 0.357448991 0 0 0
Count 0 1 0 0 0 0 1 0 0 0
Return 4.82%
Risk 10.81%
Maximise (1-r)* Expected Portfolio Return-r* Portfolio Variance
r=0.5 0.01827964
chevron_up_icon
1 out of 4
circle_padding
hide_on_mobile
zoom_out_icon
logo.png

Your All-in-One AI-Powered Toolkit for Academic Success.

Available 24*7 on WhatsApp / Email

[object Object]