MIS784 Marketing Analytics: Customer Churn & RFM Analysis-TESCO
VerifiedAdded on 2023/04/23
|28
|6188
|170
Report
AI Summary
This report provides an analysis of customer data from TESCO, focusing on predicting customer churn and performing Recency Frequency Monetary (RFM) analysis. The analysis uses decision trees in IBM SPSS and Microsoft Excel to evaluate model performance. The report includes a literature review on customer satisfaction, outlines the methodology used (descriptive and quantitative research designs), and presents results related to customer segmentation and churn prediction. The goal is to help TESCO improve customer experience and loyalty programs by understanding customer behavior and prioritizing customer service efforts. Desklib offers a range of resources, including similar reports and solved assignments, to aid students in their studies.
Deakin Business School
Department of Information Systems and Business Analytics
Assignment 2
Name of Student:
Student ID:
Department of Information Systems and Business Analytics
Assignment 2
Name of Student:
Student ID:
Paraphrase This Document
Need a fresh take? Get an instant paraphrase of this document with our AI Paraphraser
Contents
Introduction.................................................................................................................................................3
Literature Review........................................................................................................................................3
Methodology...............................................................................................................................................5
Results.........................................................................................................................................................7
Conclusion.................................................................................................................................................13
Recommendations.....................................................................................................................................13
References.................................................................................................................................................15
Appendix...................................................................................................................................................16
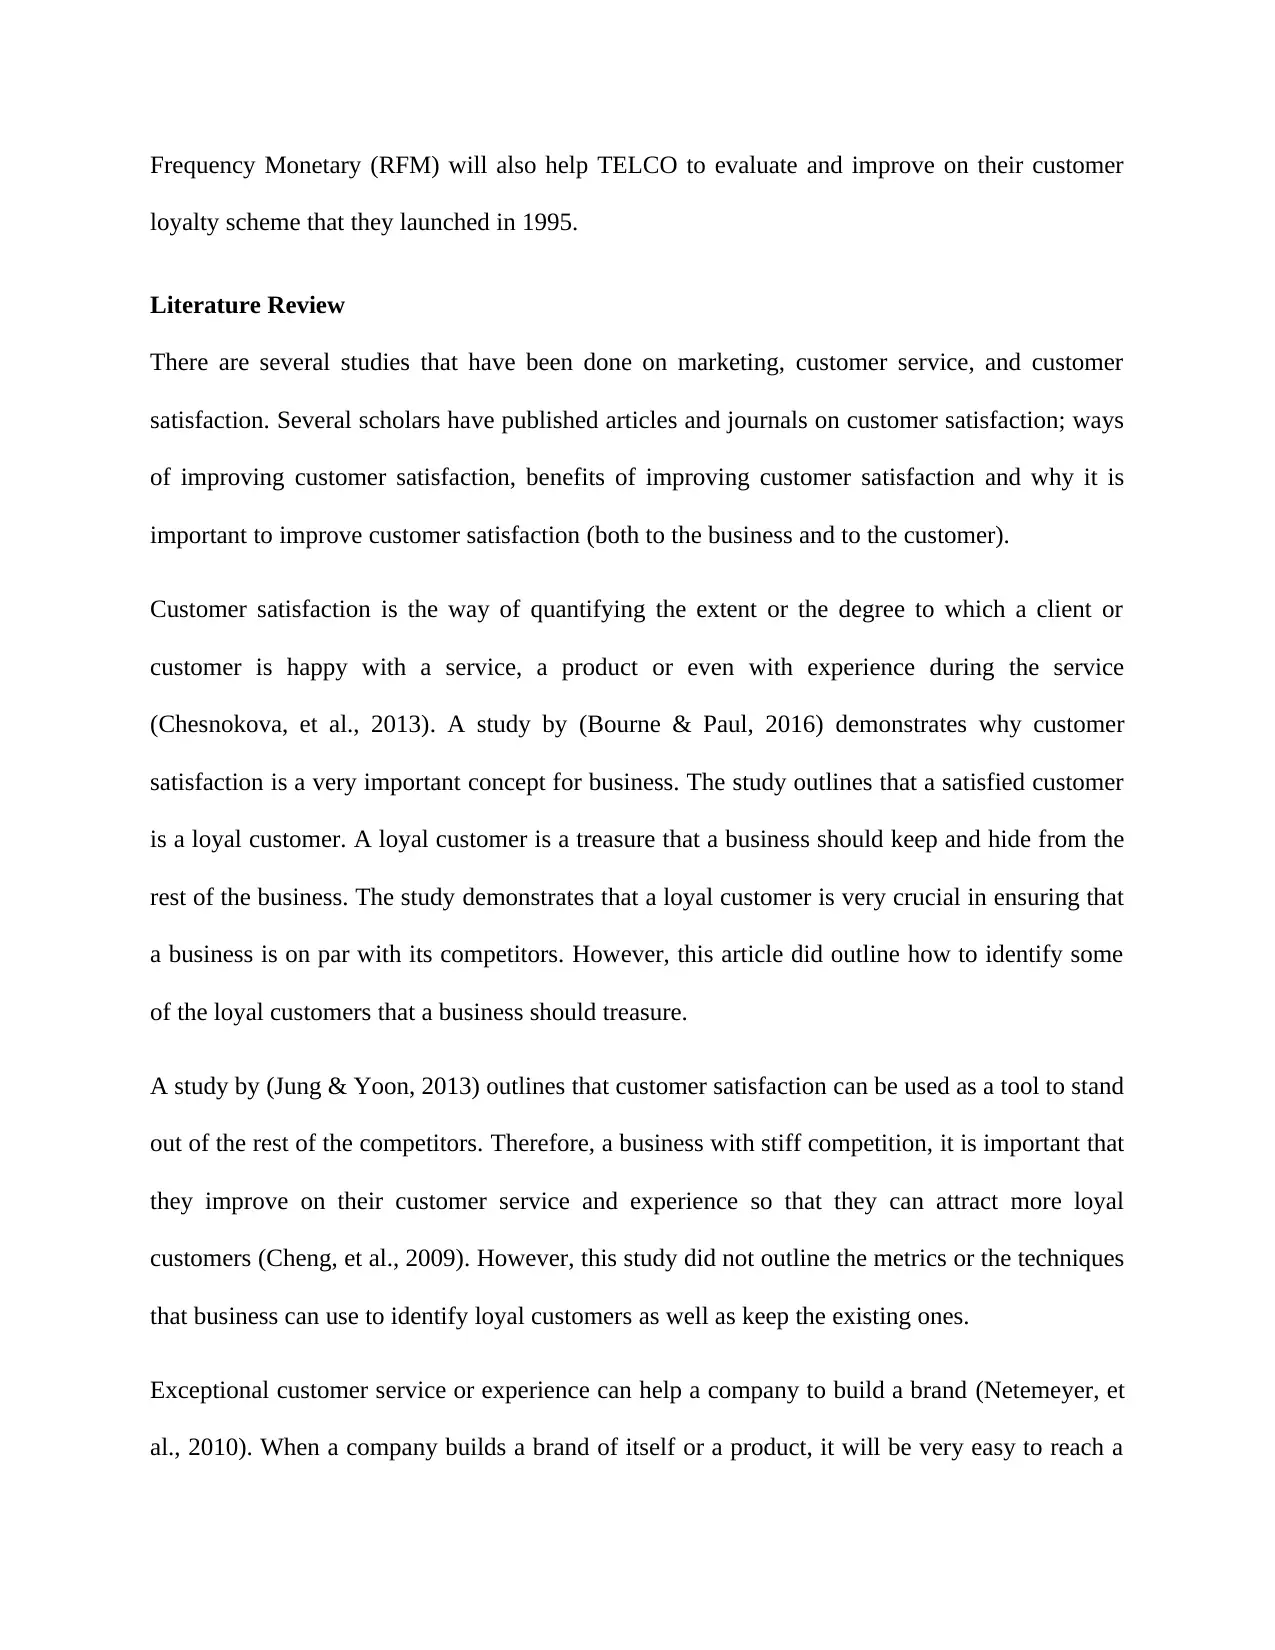
Introduction
This section gives an overview of the report and the problem that this report is solving. The
primary purpose of this report is to provide an analysis of some of the important aspects of
customers from TESCO public limited company. The analysis is meant to assist Telco in making
important decisions which are data- driven as well as being conscious of the nature of customer
base that they have.
TESCO is public limited company leading international supermarket based in the United
Kingdom (UK). TESCO Public limited company has a wide base of customers. TESCO public
limited company would like to improve their customer experience based on the experiences that
they have with the customers in the recent past. As a result, TESCO collected some important
information from their customers. The information that was collected for each client included
customers’ loyalty, customers’ churn, customers’ purchasing amount and the last time of
purchase just to mention a few.
The problem that is being solved in this report is to help TESCO public limited company in
predicting their customer’s churn as well as the Recency Frequency Monetary (RFM). Therefore,
the focus of TESCO is to be able to predict their customers’ church based on the parameters that
they have. Similarly, TESCO is interested in segmenting customers into different categories
based on their churn or loyalty. Segmentation of the customers will enable the management to
properly prioritize the customers and improve on their customer service as well as experience.
Finally, TESCO public limited company is interested in determining the Recency Frequency
Monetary (RFM) of the customers. Recency Frequency Monetary (RFM) method is a technique
that is commonly used in marketing and sales field to quantitatively analyze and determine the
best customers for given product or business (Vermeeren, et al., 2011). Similarly, Recency
⊘ This is a preview!⊘
Do you want full access?
Subscribe today to unlock all pages.
Trusted by 1+ million students worldwide
Frequency Monetary (RFM) will also help TELCO to evaluate and improve on their customer
loyalty scheme that they launched in 1995.
Literature Review
There are several studies that have been done on marketing, customer service, and customer
satisfaction. Several scholars have published articles and journals on customer satisfaction; ways
of improving customer satisfaction, benefits of improving customer satisfaction and why it is
important to improve customer satisfaction (both to the business and to the customer).
Customer satisfaction is the way of quantifying the extent or the degree to which a client or
customer is happy with a service, a product or even with experience during the service
(Chesnokova, et al., 2013). A study by (Bourne & Paul, 2016) demonstrates why customer
satisfaction is a very important concept for business. The study outlines that a satisfied customer
is a loyal customer. A loyal customer is a treasure that a business should keep and hide from the
rest of the business. The study demonstrates that a loyal customer is very crucial in ensuring that
a business is on par with its competitors. However, this article did outline how to identify some
of the loyal customers that a business should treasure.
A study by (Jung & Yoon, 2013) outlines that customer satisfaction can be used as a tool to stand
out of the rest of the competitors. Therefore, a business with stiff competition, it is important that
they improve on their customer service and experience so that they can attract more loyal
customers (Cheng, et al., 2009). However, this study did not outline the metrics or the techniques
that business can use to identify loyal customers as well as keep the existing ones.
Exceptional customer service or experience can help a company to build a brand (Netemeyer, et
al., 2010). When a company builds a brand of itself or a product, it will be very easy to reach a
Paraphrase This Document
Need a fresh take? Get an instant paraphrase of this document with our AI Paraphraser
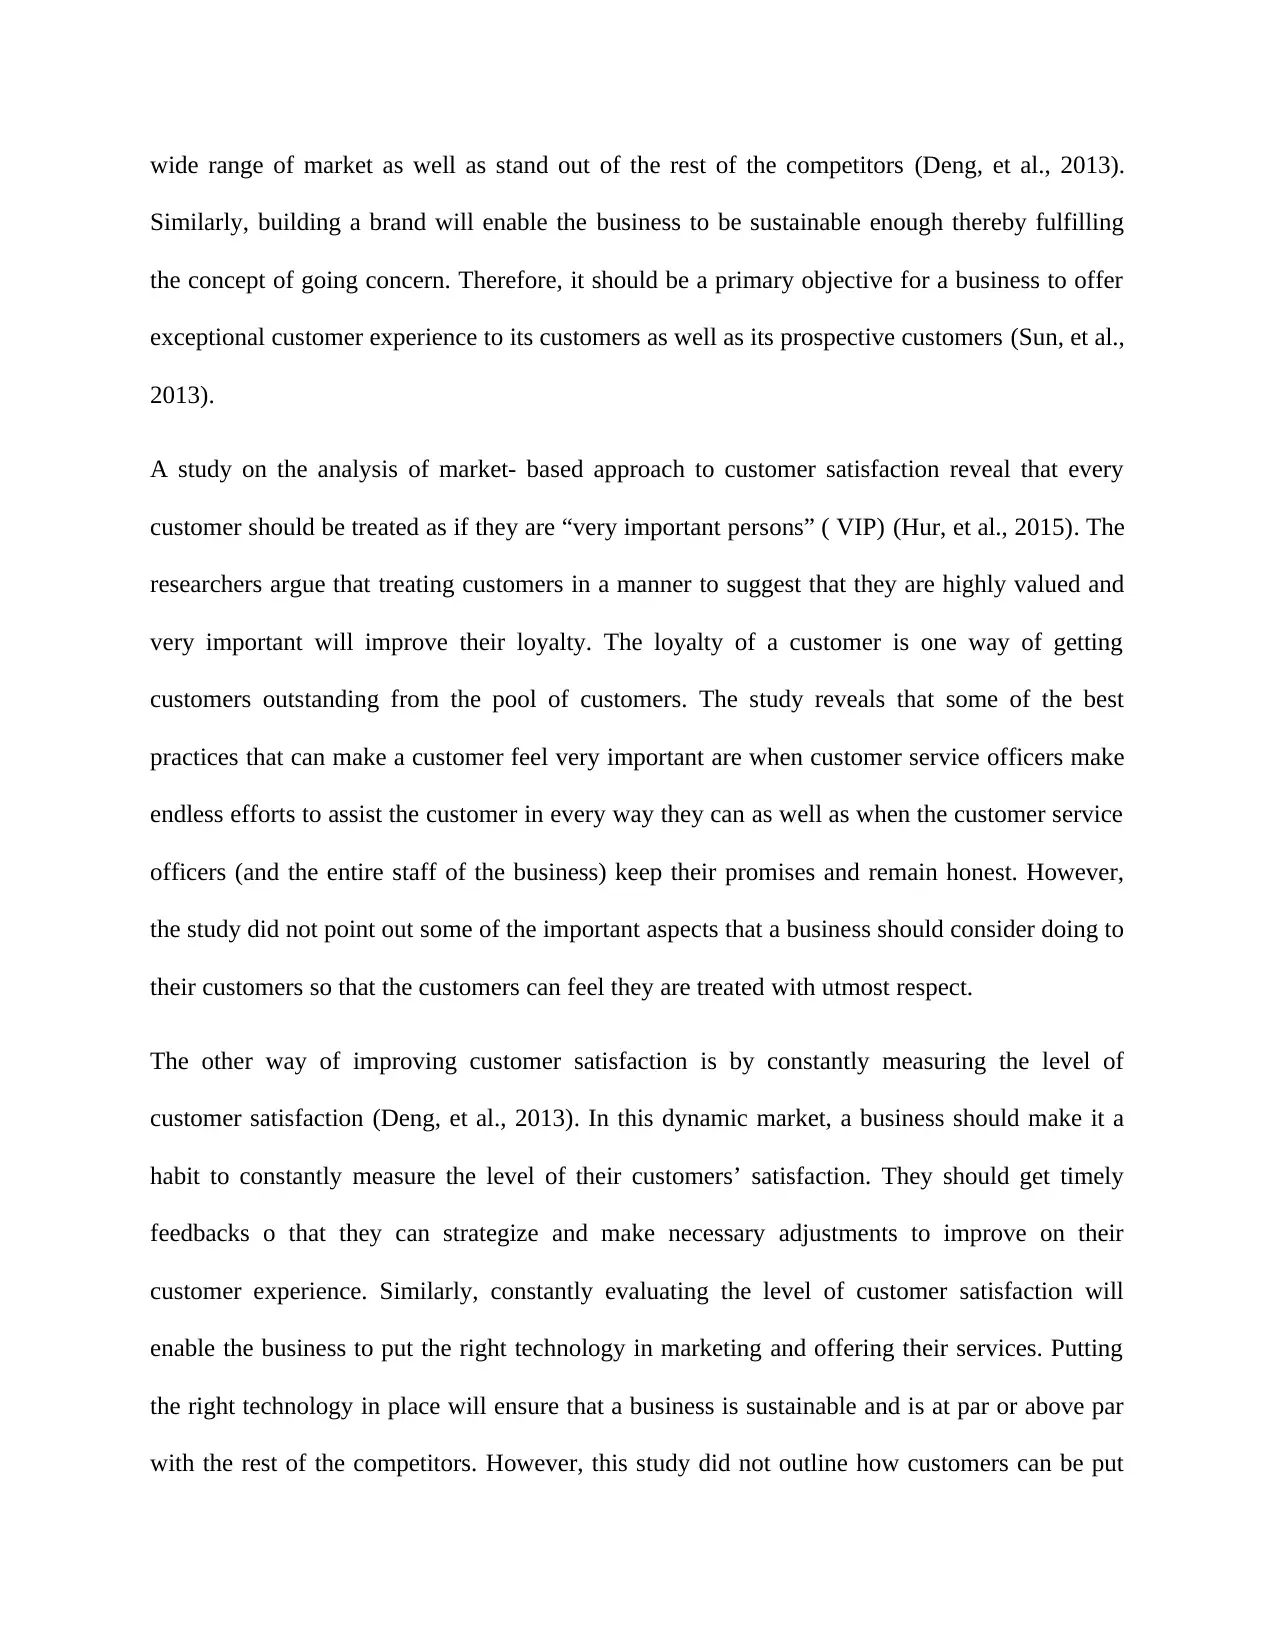
wide range of market as well as stand out of the rest of the competitors (Deng, et al., 2013).
Similarly, building a brand will enable the business to be sustainable enough thereby fulfilling
the concept of going concern. Therefore, it should be a primary objective for a business to offer
exceptional customer experience to its customers as well as its prospective customers (Sun, et al.,
2013).
A study on the analysis of market- based approach to customer satisfaction reveal that every
customer should be treated as if they are “very important persons” ( VIP) (Hur, et al., 2015). The
researchers argue that treating customers in a manner to suggest that they are highly valued and
very important will improve their loyalty. The loyalty of a customer is one way of getting
customers outstanding from the pool of customers. The study reveals that some of the best
practices that can make a customer feel very important are when customer service officers make
endless efforts to assist the customer in every way they can as well as when the customer service
officers (and the entire staff of the business) keep their promises and remain honest. However,
the study did not point out some of the important aspects that a business should consider doing to
their customers so that the customers can feel they are treated with utmost respect.
The other way of improving customer satisfaction is by constantly measuring the level of
customer satisfaction (Deng, et al., 2013). In this dynamic market, a business should make it a
habit to constantly measure the level of their customers’ satisfaction. They should get timely
feedbacks o that they can strategize and make necessary adjustments to improve on their
customer experience. Similarly, constantly evaluating the level of customer satisfaction will
enable the business to put the right technology in marketing and offering their services. Putting
the right technology in place will ensure that a business is sustainable and is at par or above par
with the rest of the competitors. However, this study did not outline how customers can be put
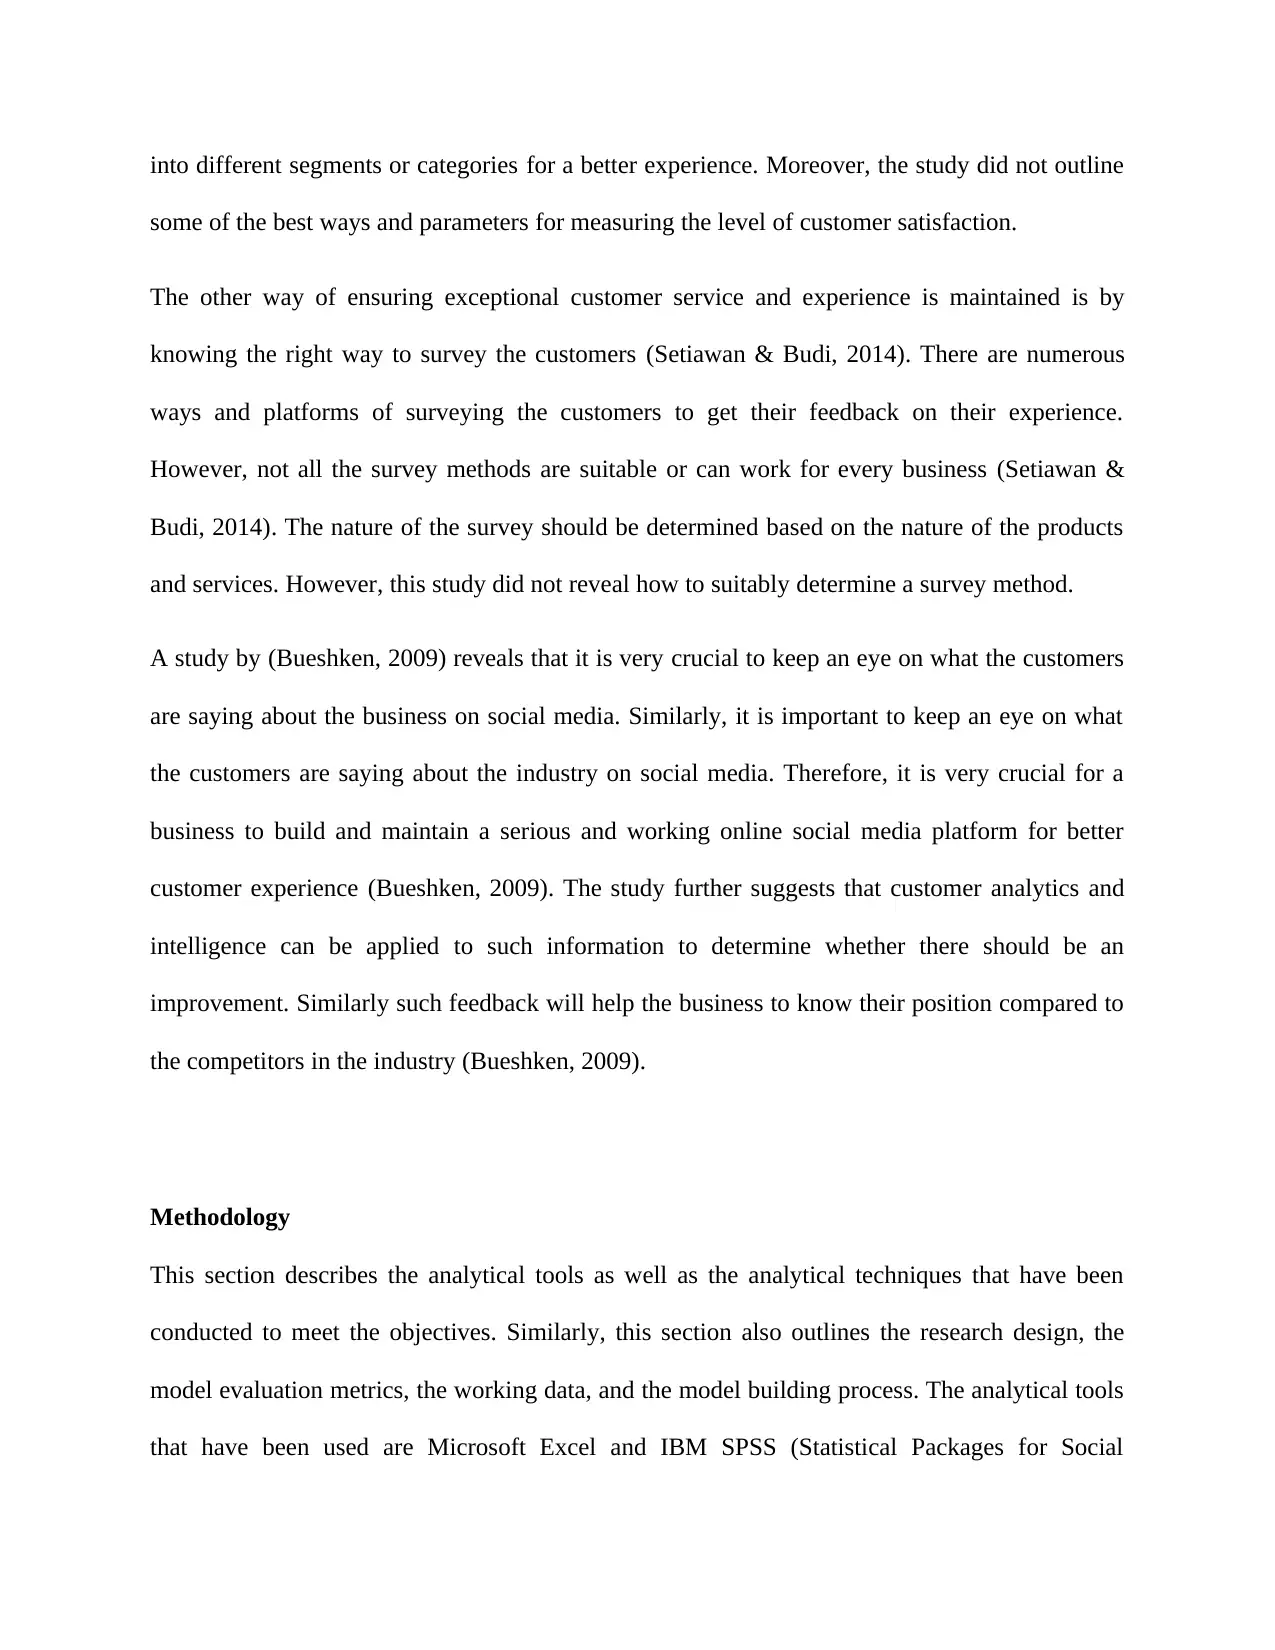
into different segments or categories for a better experience. Moreover, the study did not outline
some of the best ways and parameters for measuring the level of customer satisfaction.
The other way of ensuring exceptional customer service and experience is maintained is by
knowing the right way to survey the customers (Setiawan & Budi, 2014). There are numerous
ways and platforms of surveying the customers to get their feedback on their experience.
However, not all the survey methods are suitable or can work for every business (Setiawan &
Budi, 2014). The nature of the survey should be determined based on the nature of the products
and services. However, this study did not reveal how to suitably determine a survey method.
A study by (Bueshken, 2009) reveals that it is very crucial to keep an eye on what the customers
are saying about the business on social media. Similarly, it is important to keep an eye on what
the customers are saying about the industry on social media. Therefore, it is very crucial for a
business to build and maintain a serious and working online social media platform for better
customer experience (Bueshken, 2009). The study further suggests that customer analytics and
intelligence can be applied to such information to determine whether there should be an
improvement. Similarly such feedback will help the business to know their position compared to
the competitors in the industry (Bueshken, 2009).
Methodology
This section describes the analytical tools as well as the analytical techniques that have been
conducted to meet the objectives. Similarly, this section also outlines the research design, the
model evaluation metrics, the working data, and the model building process. The analytical tools
that have been used are Microsoft Excel and IBM SPSS (Statistical Packages for Social
⊘ This is a preview!⊘
Do you want full access?
Subscribe today to unlock all pages.
Trusted by 1+ million students worldwide
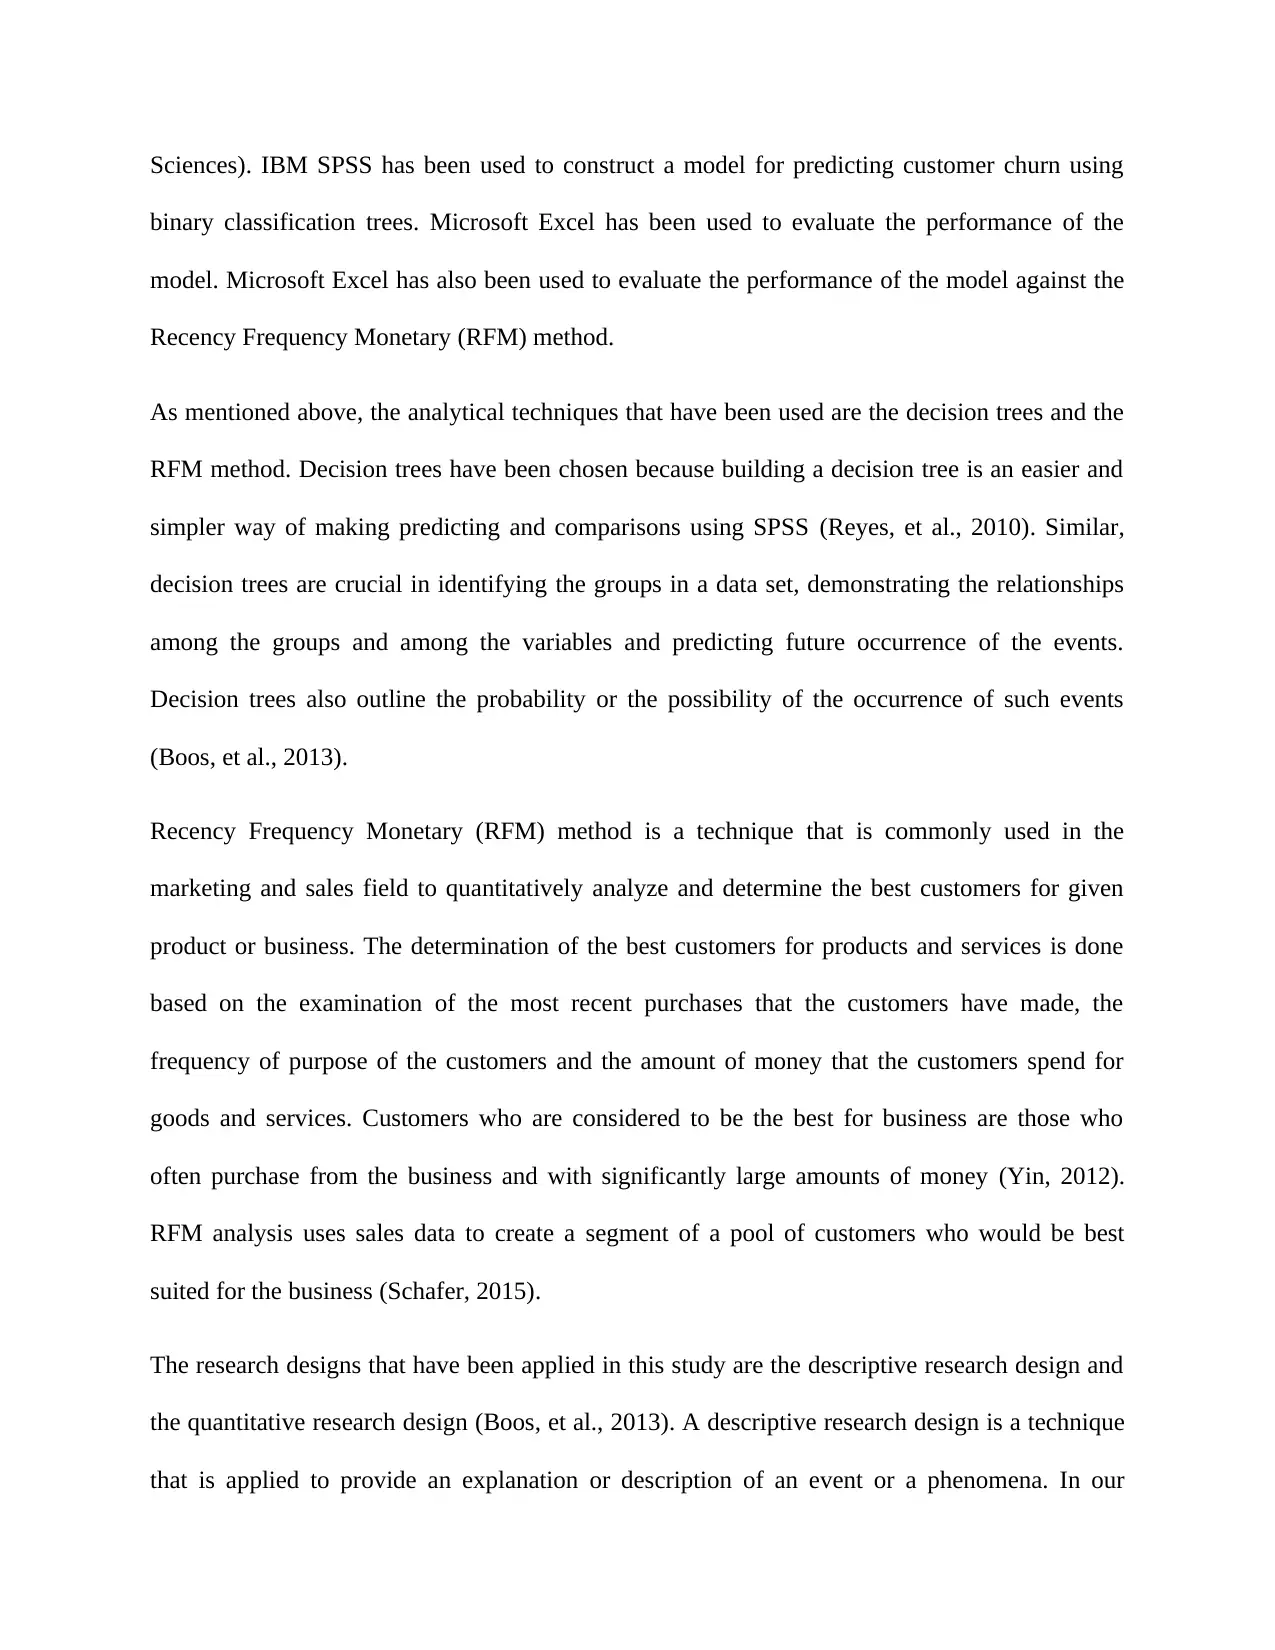
Sciences). IBM SPSS has been used to construct a model for predicting customer churn using
binary classification trees. Microsoft Excel has been used to evaluate the performance of the
model. Microsoft Excel has also been used to evaluate the performance of the model against the
Recency Frequency Monetary (RFM) method.
As mentioned above, the analytical techniques that have been used are the decision trees and the
RFM method. Decision trees have been chosen because building a decision tree is an easier and
simpler way of making predicting and comparisons using SPSS (Reyes, et al., 2010). Similar,
decision trees are crucial in identifying the groups in a data set, demonstrating the relationships
among the groups and among the variables and predicting future occurrence of the events.
Decision trees also outline the probability or the possibility of the occurrence of such events
(Boos, et al., 2013).
Recency Frequency Monetary (RFM) method is a technique that is commonly used in the
marketing and sales field to quantitatively analyze and determine the best customers for given
product or business. The determination of the best customers for products and services is done
based on the examination of the most recent purchases that the customers have made, the
frequency of purpose of the customers and the amount of money that the customers spend for
goods and services. Customers who are considered to be the best for business are those who
often purchase from the business and with significantly large amounts of money (Yin, 2012).
RFM analysis uses sales data to create a segment of a pool of customers who would be best
suited for the business (Schafer, 2015).
The research designs that have been applied in this study are the descriptive research design and
the quantitative research design (Boos, et al., 2013). A descriptive research design is a technique
that is applied to provide an explanation or description of an event or a phenomena. In our
Paraphrase This Document
Need a fresh take? Get an instant paraphrase of this document with our AI Paraphraser
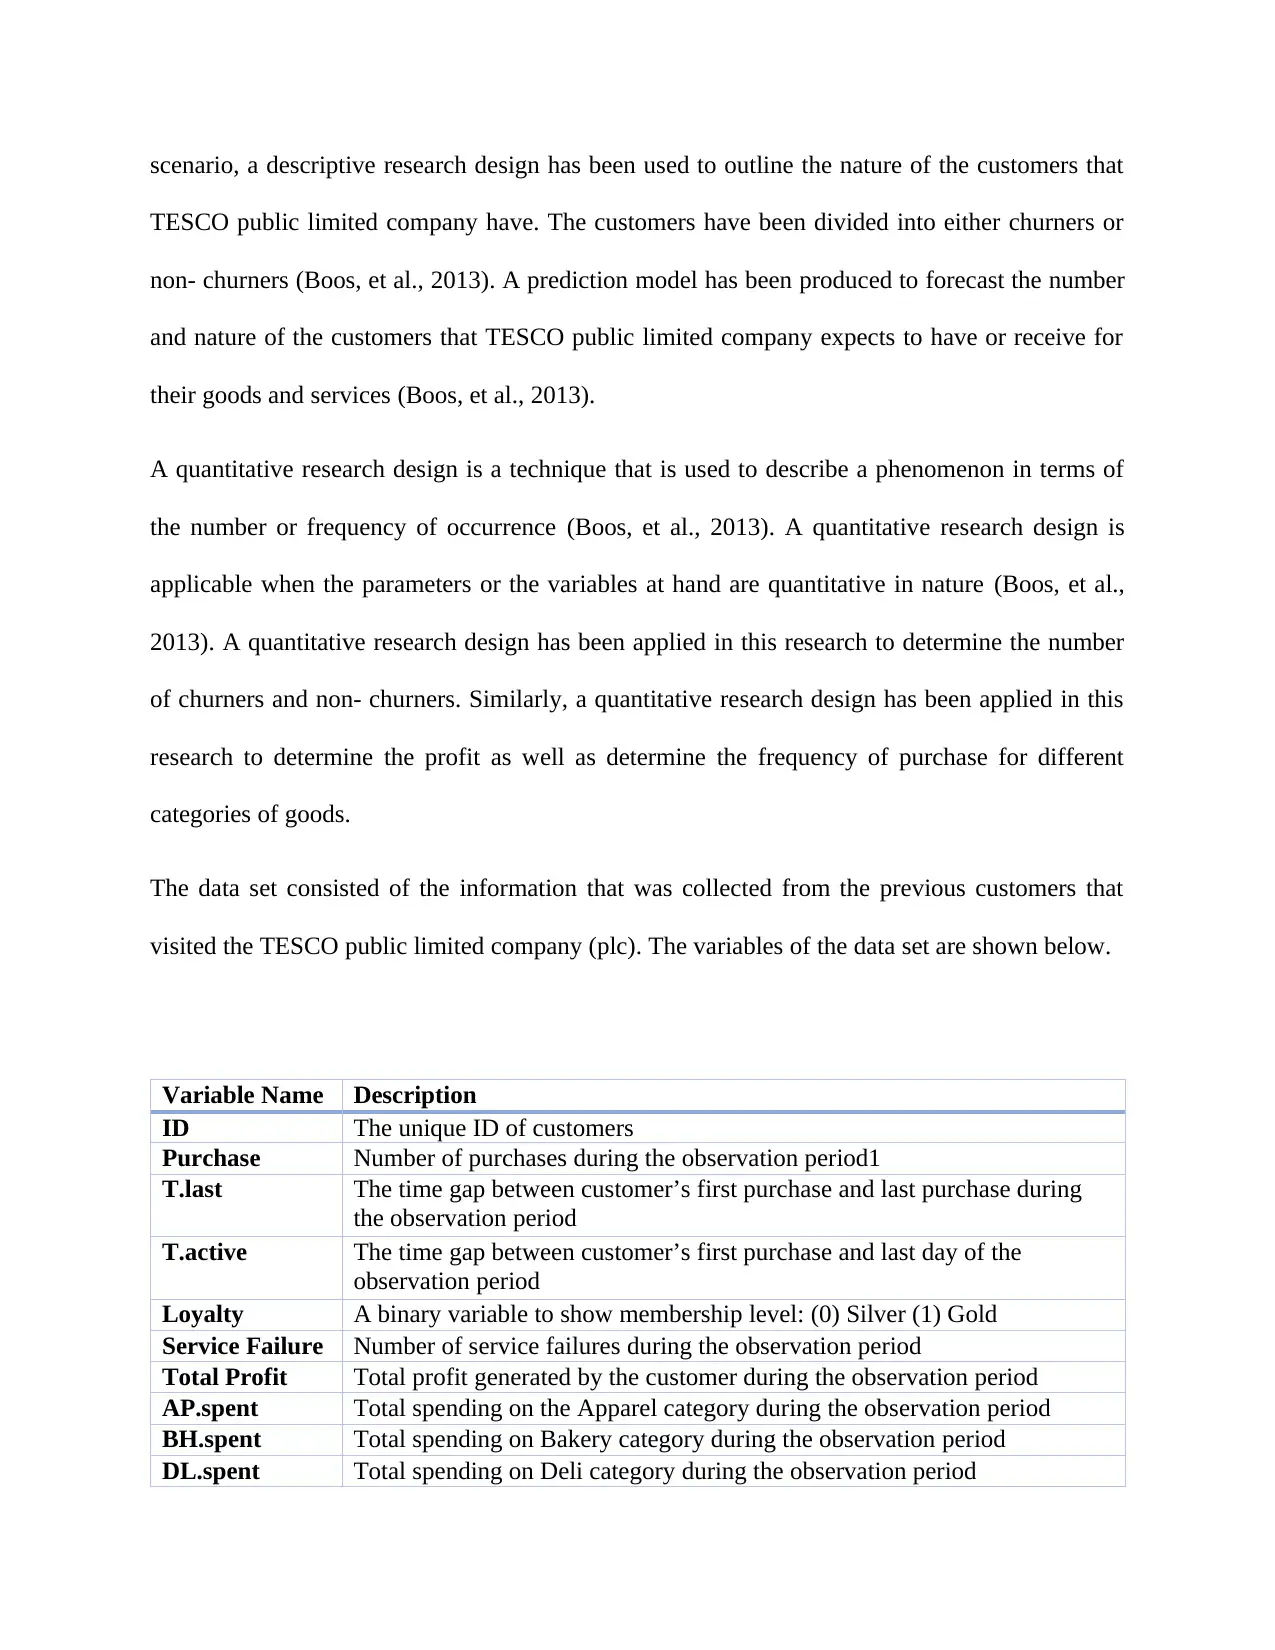
scenario, a descriptive research design has been used to outline the nature of the customers that
TESCO public limited company have. The customers have been divided into either churners or
non- churners (Boos, et al., 2013). A prediction model has been produced to forecast the number
and nature of the customers that TESCO public limited company expects to have or receive for
their goods and services (Boos, et al., 2013).
A quantitative research design is a technique that is used to describe a phenomenon in terms of
the number or frequency of occurrence (Boos, et al., 2013). A quantitative research design is
applicable when the parameters or the variables at hand are quantitative in nature (Boos, et al.,
2013). A quantitative research design has been applied in this research to determine the number
of churners and non- churners. Similarly, a quantitative research design has been applied in this
research to determine the profit as well as determine the frequency of purchase for different
categories of goods.
The data set consisted of the information that was collected from the previous customers that
visited the TESCO public limited company (plc). The variables of the data set are shown below.
Variable Name Description
ID The unique ID of customers
Purchase Number of purchases during the observation period1
T.last The time gap between customer’s first purchase and last purchase during
the observation period
T.active The time gap between customer’s first purchase and last day of the
observation period
Loyalty A binary variable to show membership level: (0) Silver (1) Gold
Service Failure Number of service failures during the observation period
Total Profit Total profit generated by the customer during the observation period
AP.spent Total spending on the Apparel category during the observation period
BH.spent Total spending on Bakery category during the observation period
DL.spent Total spending on Deli category during the observation period
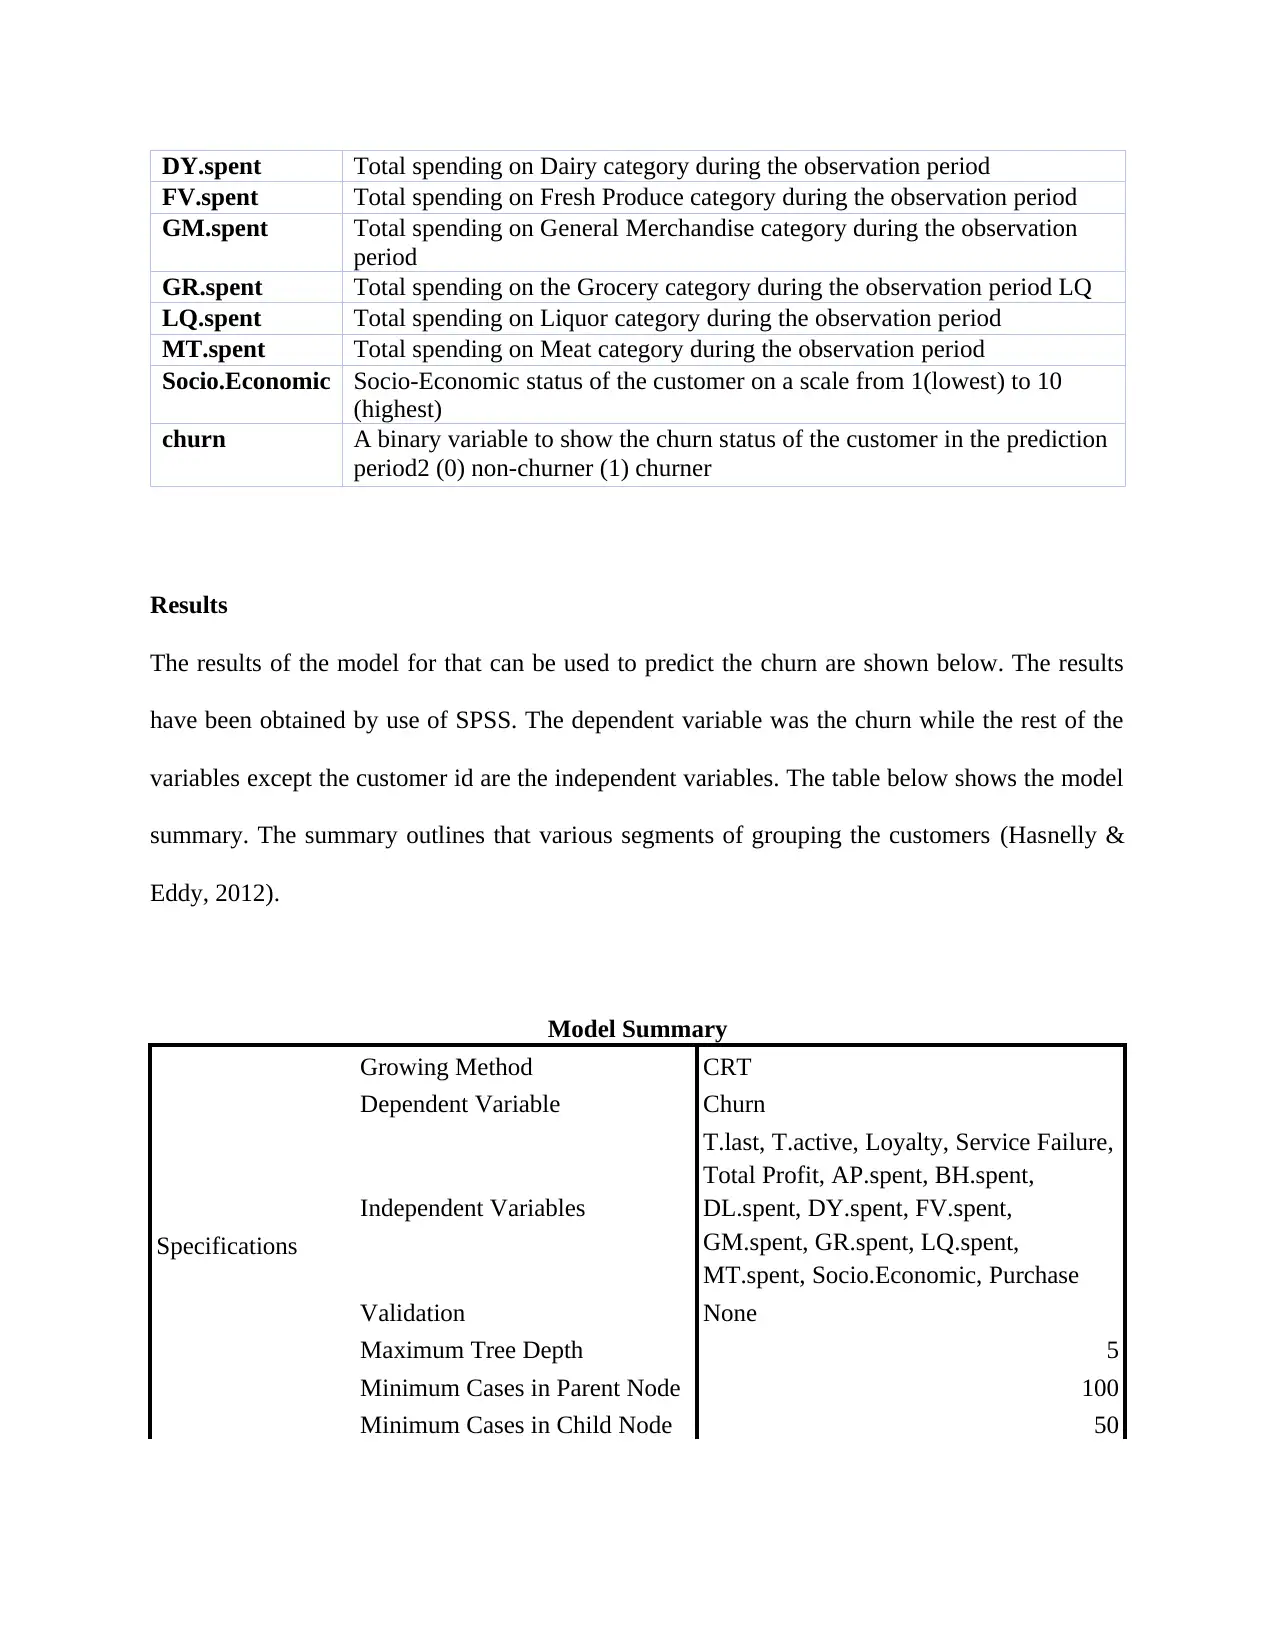
DY.spent Total spending on Dairy category during the observation period
FV.spent Total spending on Fresh Produce category during the observation period
GM.spent Total spending on General Merchandise category during the observation
period
GR.spent Total spending on the Grocery category during the observation period LQ
LQ.spent Total spending on Liquor category during the observation period
MT.spent Total spending on Meat category during the observation period
Socio.Economic Socio-Economic status of the customer on a scale from 1(lowest) to 10
(highest)
churn A binary variable to show the churn status of the customer in the prediction
period2 (0) non-churner (1) churner
Results
The results of the model for that can be used to predict the churn are shown below. The results
have been obtained by use of SPSS. The dependent variable was the churn while the rest of the
variables except the customer id are the independent variables. The table below shows the model
summary. The summary outlines that various segments of grouping the customers (Hasnelly &
Eddy, 2012).
Model Summary
Specifications
Growing Method CRT
Dependent Variable Churn
Independent Variables
T.last, T.active, Loyalty, Service Failure,
Total Profit, AP.spent, BH.spent,
DL.spent, DY.spent, FV.spent,
GM.spent, GR.spent, LQ.spent,
MT.spent, Socio.Economic, Purchase
Validation None
Maximum Tree Depth 5
Minimum Cases in Parent Node 100
Minimum Cases in Child Node 50
⊘ This is a preview!⊘
Do you want full access?
Subscribe today to unlock all pages.
Trusted by 1+ million students worldwide
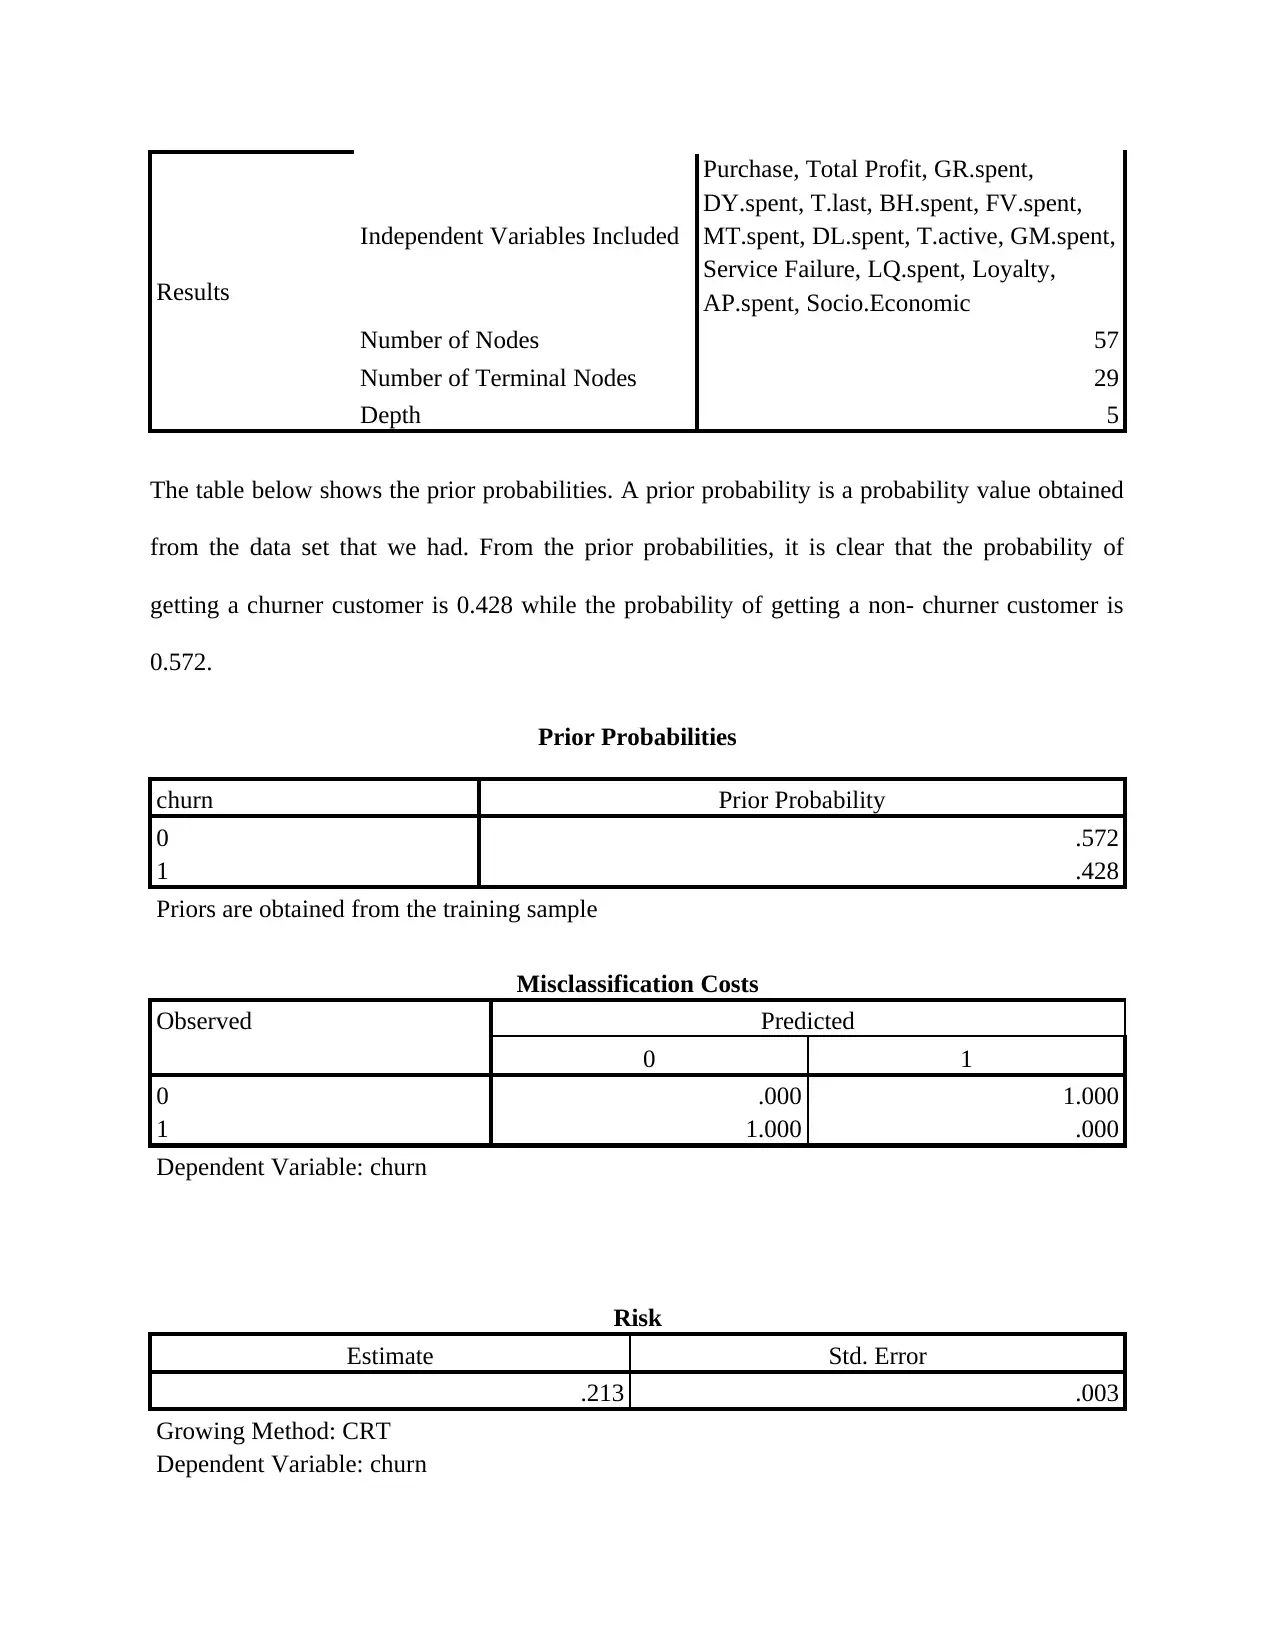
Results
Independent Variables Included
Purchase, Total Profit, GR.spent,
DY.spent, T.last, BH.spent, FV.spent,
MT.spent, DL.spent, T.active, GM.spent,
Service Failure, LQ.spent, Loyalty,
AP.spent, Socio.Economic
Number of Nodes 57
Number of Terminal Nodes 29
Depth 5
The table below shows the prior probabilities. A prior probability is a probability value obtained
from the data set that we had. From the prior probabilities, it is clear that the probability of
getting a churner customer is 0.428 while the probability of getting a non- churner customer is
0.572.
Prior Probabilities
churn Prior Probability
0 .572
1 .428
Priors are obtained from the training sample
Misclassification Costs
Observed Predicted
0 1
0 .000 1.000
1 1.000 .000
Dependent Variable: churn
Risk
Estimate Std. Error
.213 .003
Growing Method: CRT
Dependent Variable: churn
Paraphrase This Document
Need a fresh take? Get an instant paraphrase of this document with our AI Paraphraser
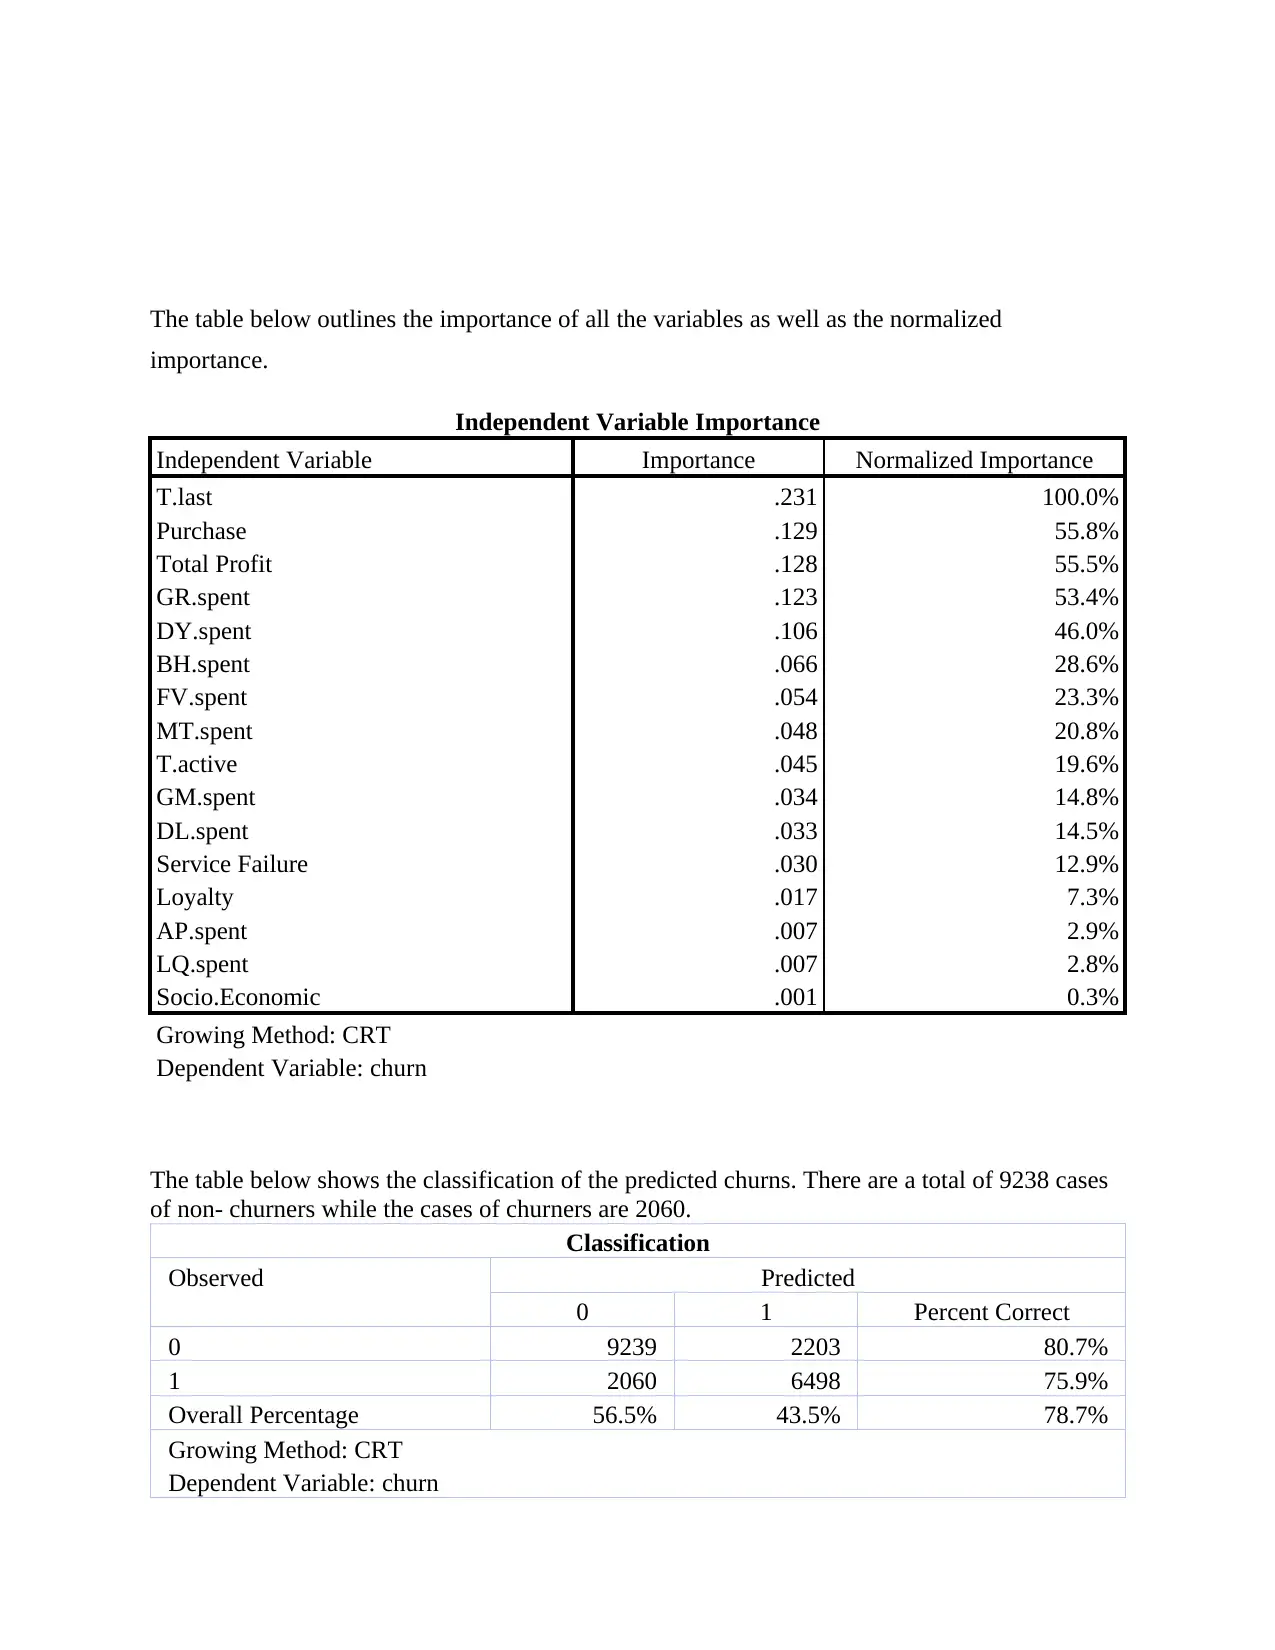
The table below outlines the importance of all the variables as well as the normalized
importance.
Independent Variable Importance
Independent Variable Importance Normalized Importance
T.last .231 100.0%
Purchase .129 55.8%
Total Profit .128 55.5%
GR.spent .123 53.4%
DY.spent .106 46.0%
BH.spent .066 28.6%
FV.spent .054 23.3%
MT.spent .048 20.8%
T.active .045 19.6%
GM.spent .034 14.8%
DL.spent .033 14.5%
Service Failure .030 12.9%
Loyalty .017 7.3%
AP.spent .007 2.9%
LQ.spent .007 2.8%
Socio.Economic .001 0.3%
Growing Method: CRT
Dependent Variable: churn
The table below shows the classification of the predicted churns. There are a total of 9238 cases
of non- churners while the cases of churners are 2060.
Classification
Observed Predicted
0 1 Percent Correct
0 9239 2203 80.7%
1 2060 6498 75.9%
Overall Percentage 56.5% 43.5% 78.7%
Growing Method: CRT
Dependent Variable: churn
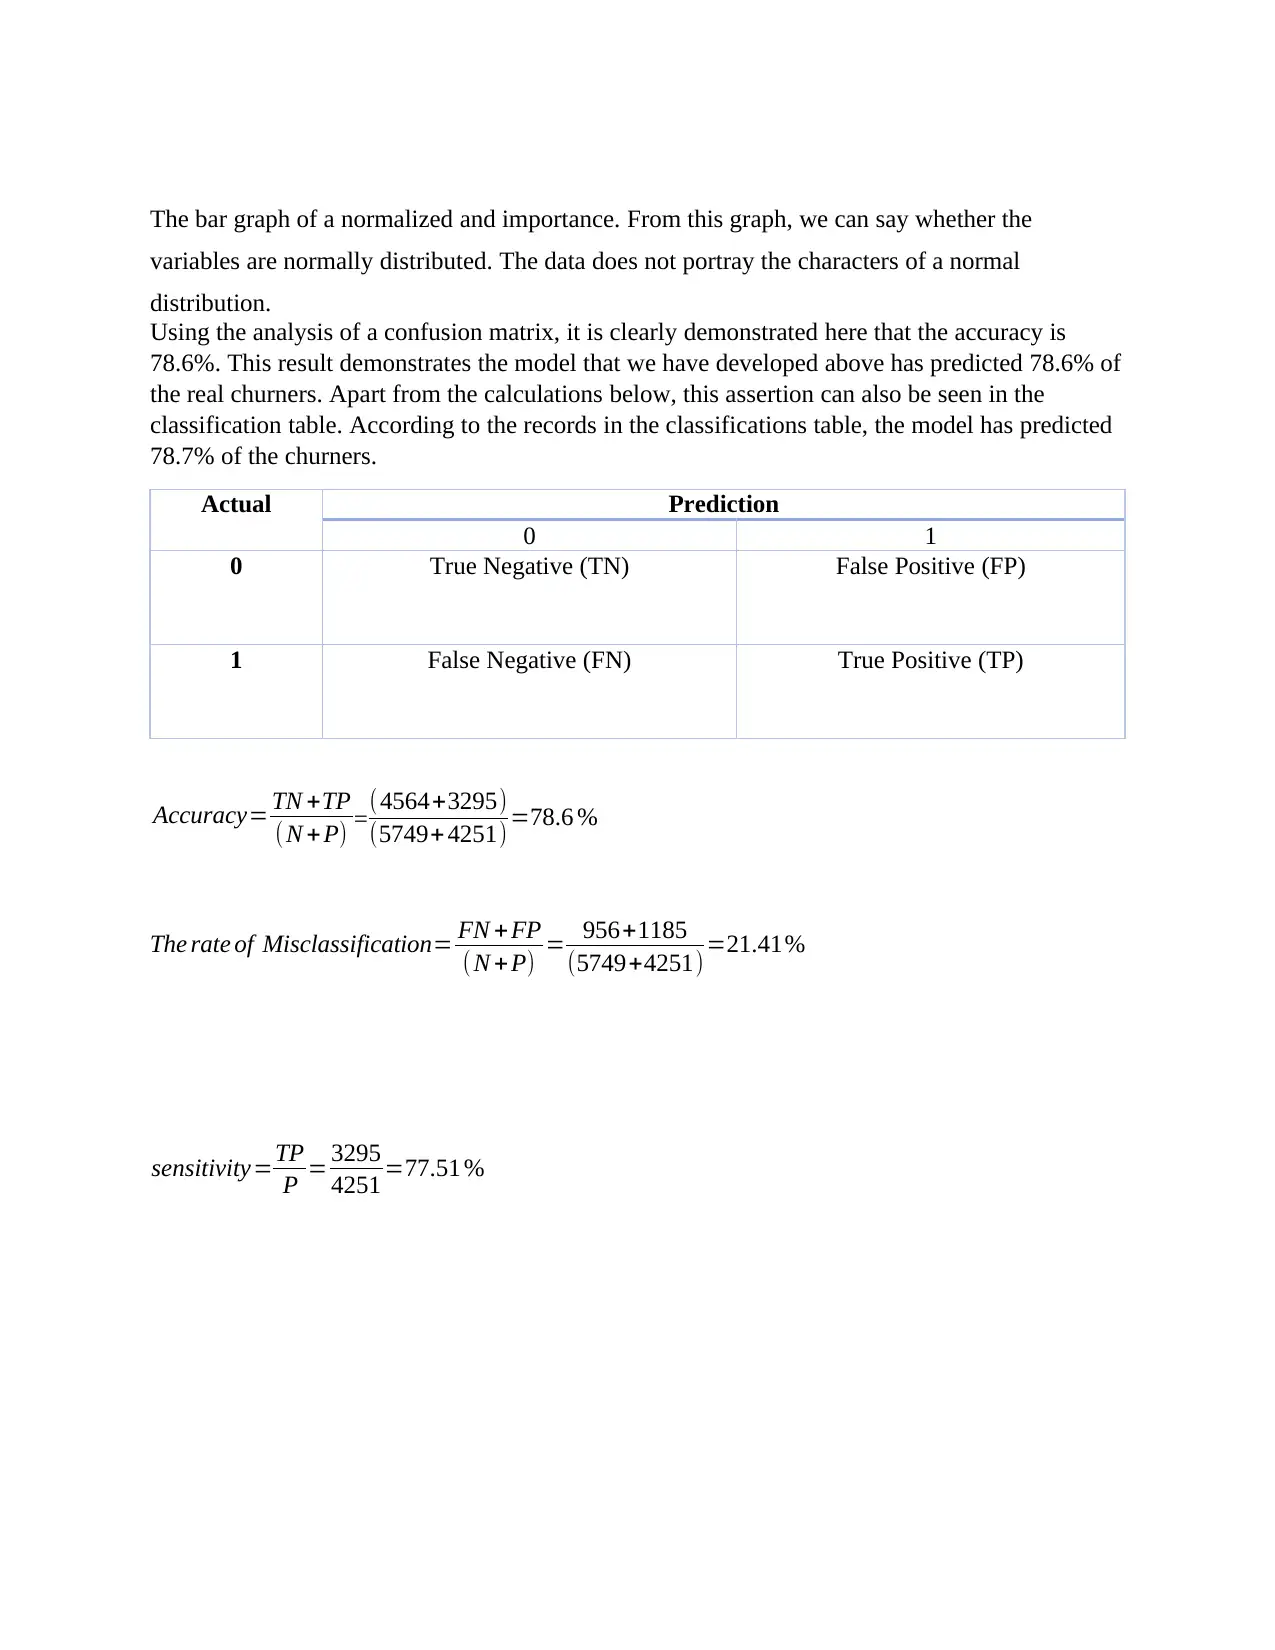
The bar graph of a normalized and importance. From this graph, we can say whether the
variables are normally distributed. The data does not portray the characters of a normal
distribution.
Using the analysis of a confusion matrix, it is clearly demonstrated here that the accuracy is
78.6%. This result demonstrates the model that we have developed above has predicted 78.6% of
the real churners. Apart from the calculations below, this assertion can also be seen in the
classification table. According to the records in the classifications table, the model has predicted
78.7% of the churners.
Actual Prediction
0 1
0 True Negative (TN) False Positive (FP)
1 False Negative (FN) True Positive (TP)
Accuracy= TN +TP
( N + P) =(4564+3295)
(5749+ 4251) =78.6 %
The rate of Misclassification= FN +FP
(N +P) = 956+1185
(5749+4251) =21.41%
sensitivity=TP
P = 3295
4251 =77.51 %
⊘ This is a preview!⊘
Do you want full access?
Subscribe today to unlock all pages.
Trusted by 1+ million students worldwide
1 out of 28
Related Documents


Your All-in-One AI-Powered Toolkit for Academic Success.
+13062052269
info@desklib.com
Available 24*7 on WhatsApp / Email
![[object Object]](/_next/static/media/star-bottom.7253800d.svg)
Unlock your academic potential
Copyright © 2020–2026 A2Z Services. All Rights Reserved. Developed and managed by ZUCOL.