Bike Share Plan: Mississauga's Economic Impact and Location Analysis
VerifiedAdded on 2022/08/12
|9
|301
|24
Project
AI Summary
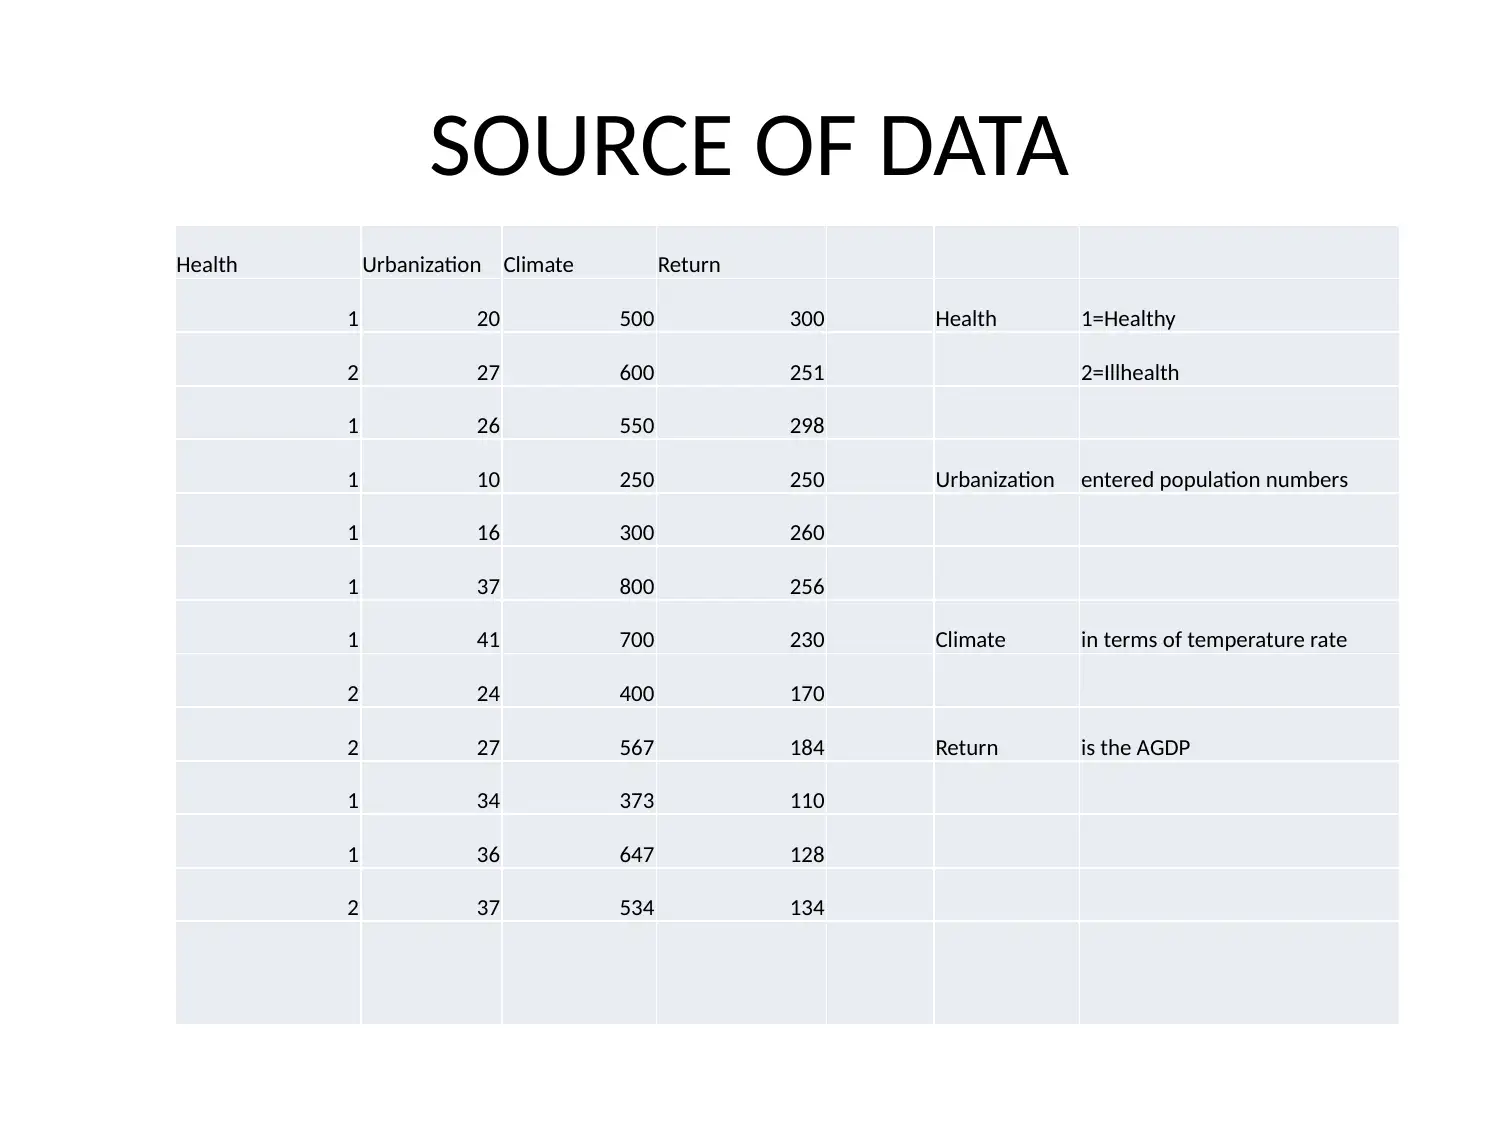
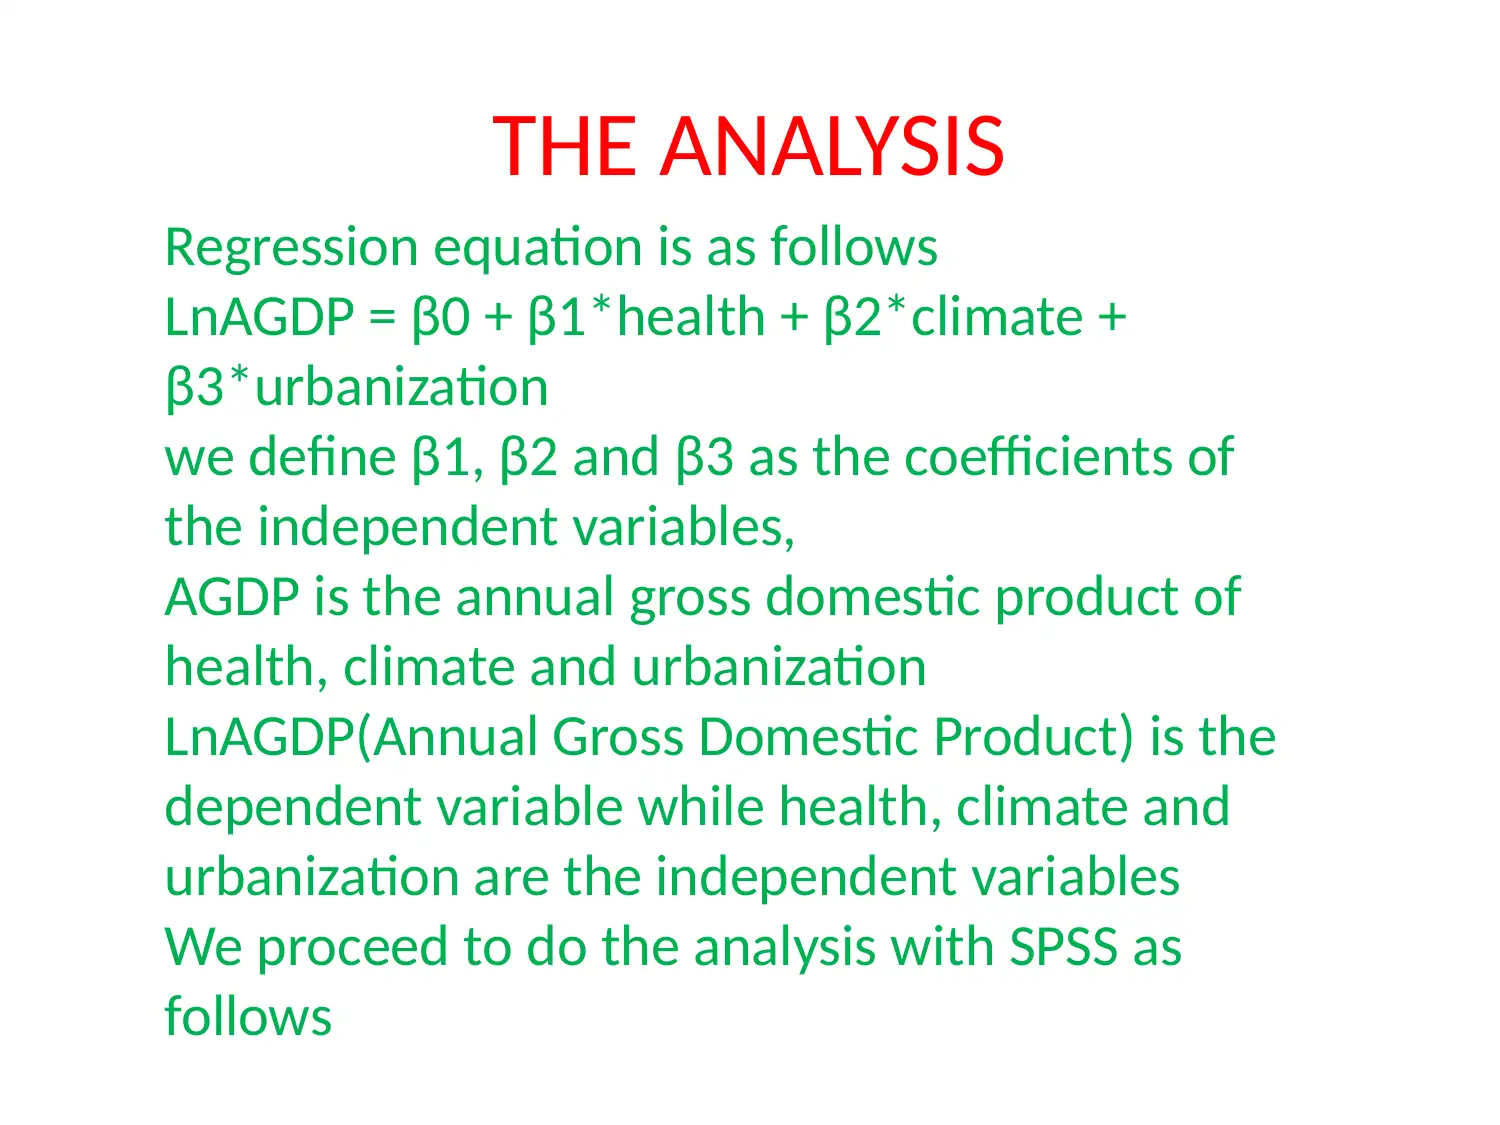
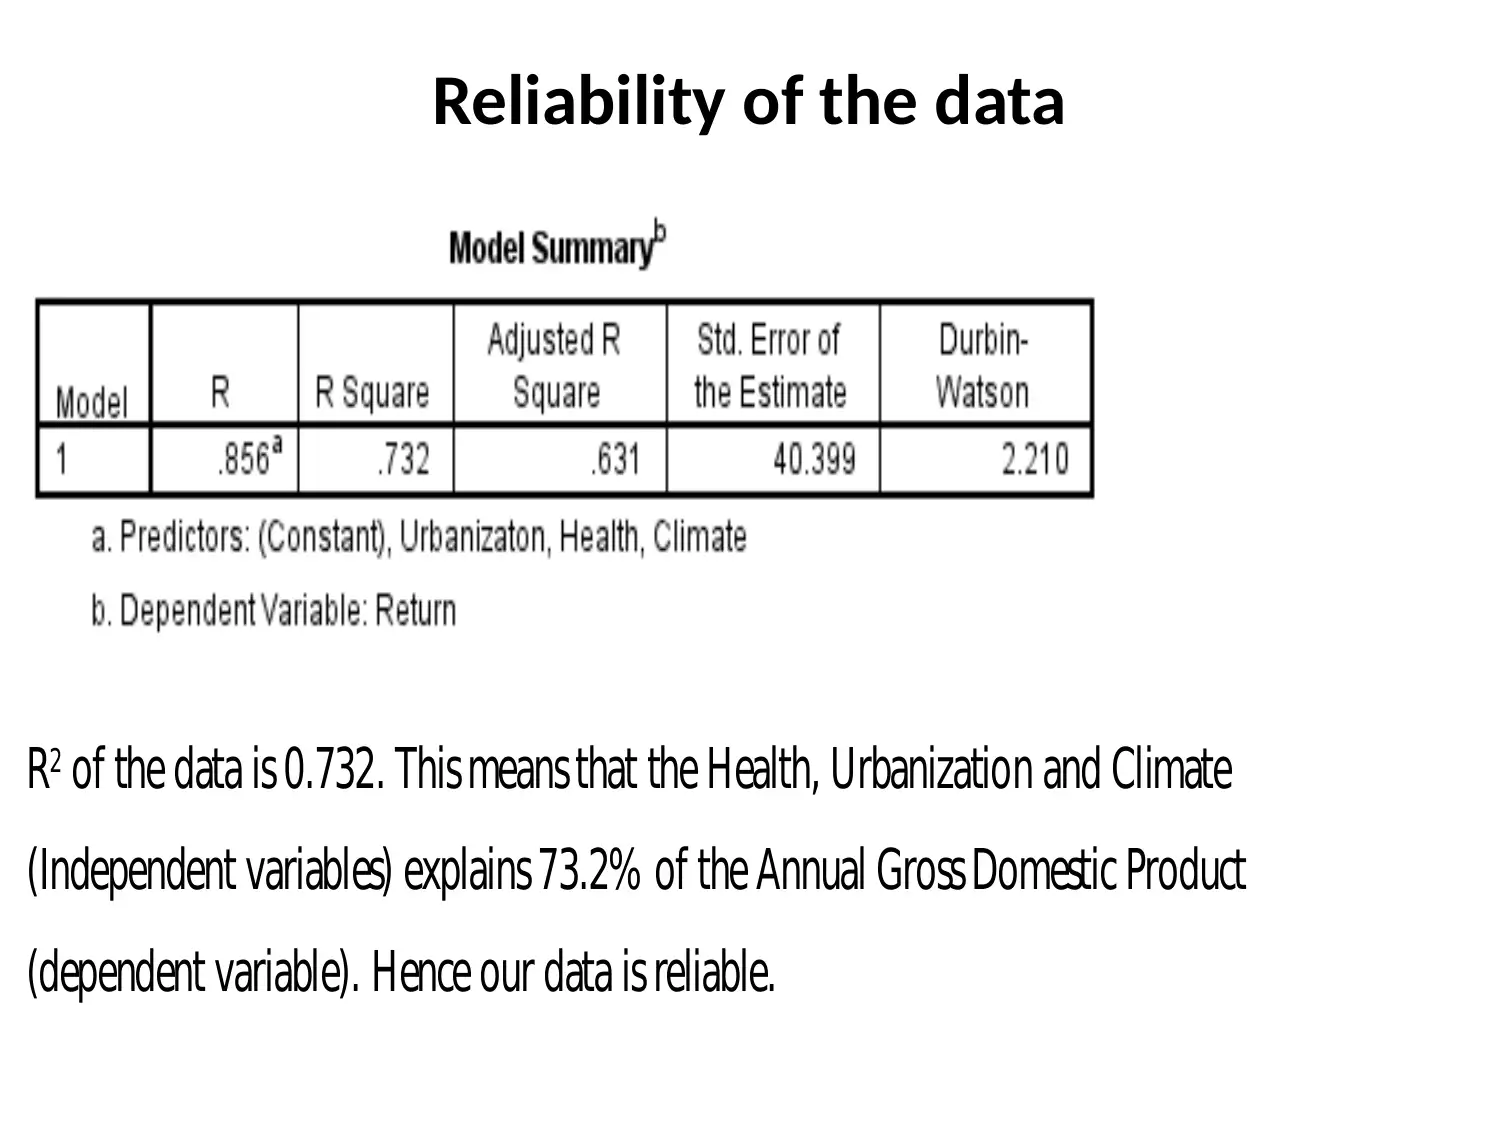
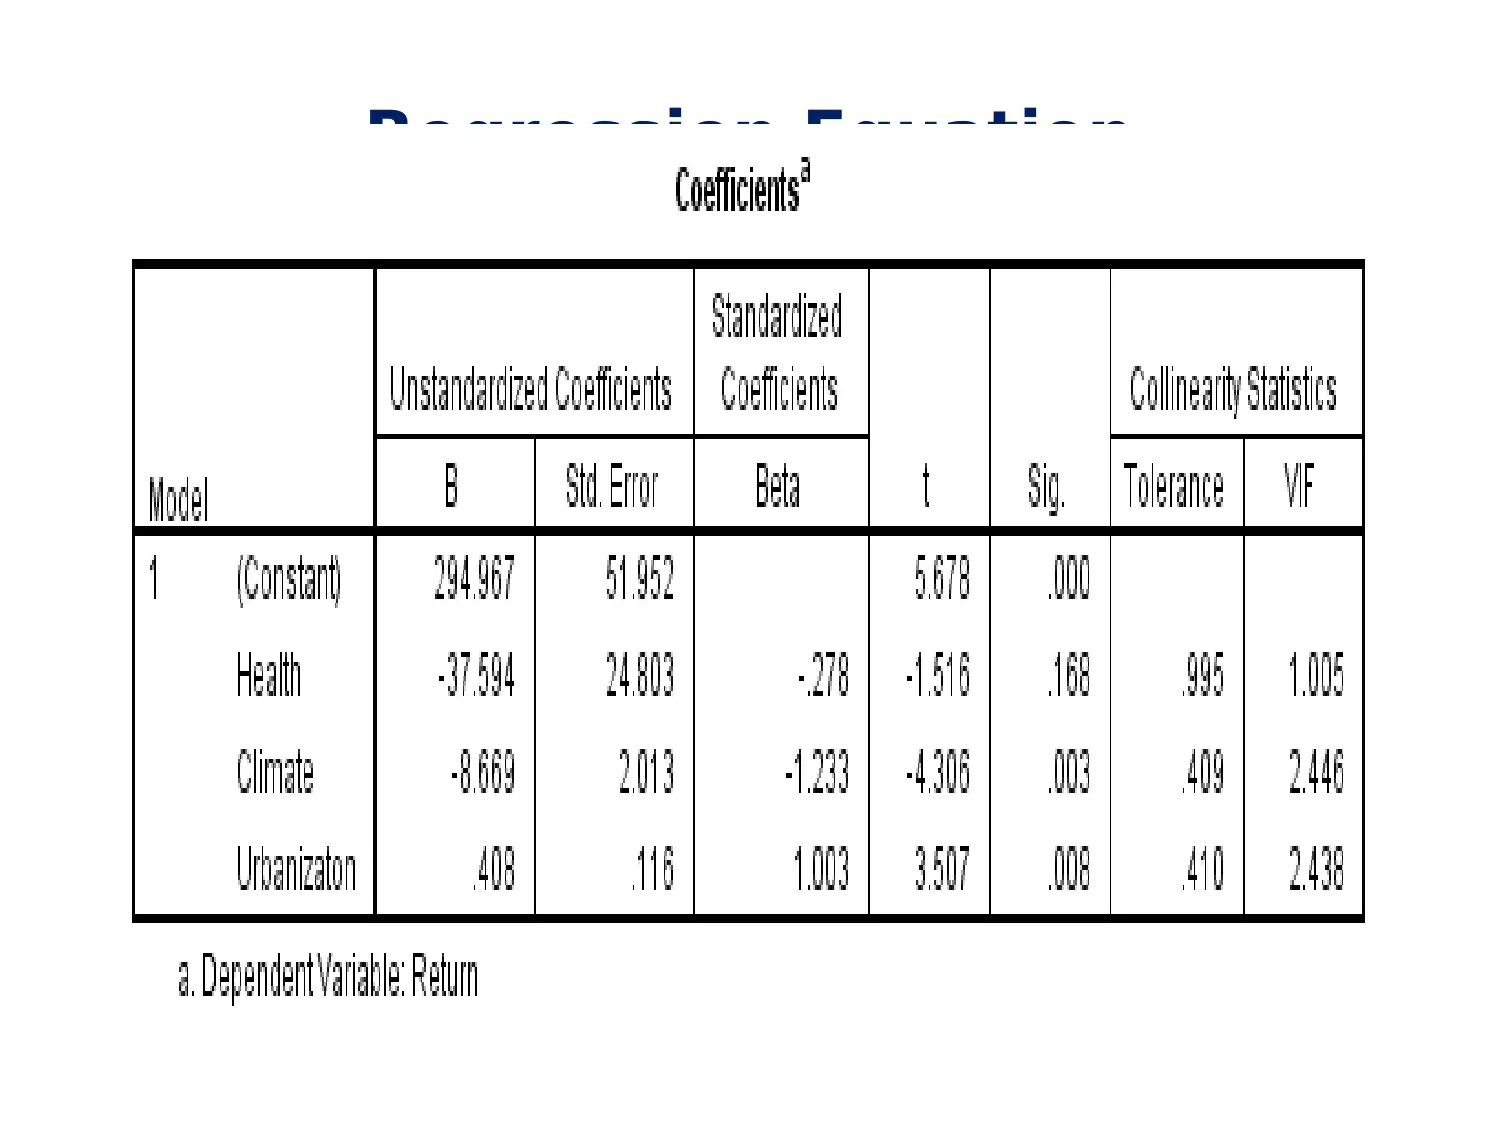
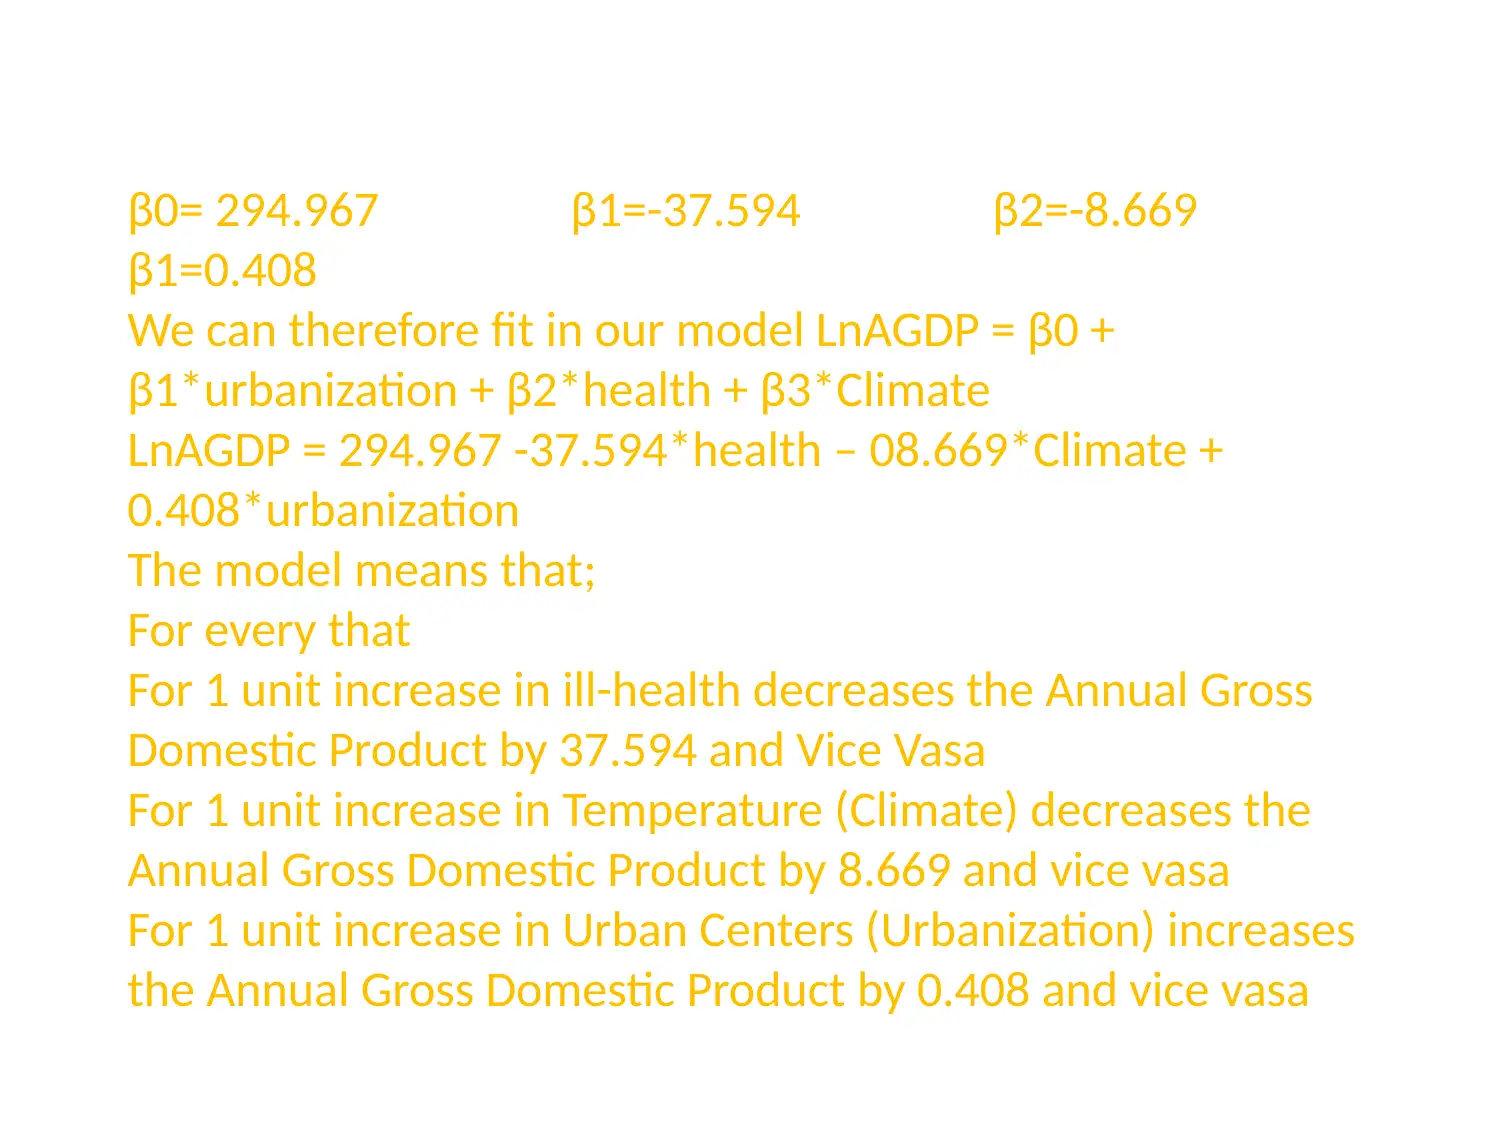
This project analyzes Mississauga's bike share plan, aiming to identify prime locations that optimize the use of bike share throughout the city. The analysis focuses on population density, business density, and proximity to transit hubs (MiWay & GO). The project utilizes a regression model, calculating t...

THE PREDICTIVE MODEL
OF ECONOMIC LOSS OF
EDMONTON CITY
REQUIREMENT
ANALYSIS & DATA
OF ECONOMIC LOSS OF
EDMONTON CITY
REQUIREMENT
ANALYSIS & DATA
Paraphrase This Document
Need a fresh take? Get an instant paraphrase of this document with our AI Paraphraser

SOURCE OF DATA
Health Urbanization Climate Return
1 20 500 300 Health 1=Healthy
2 27 600 251 2=Illhealth
1 26 550 298
1 10 250 250 Urbanization entered population numbers
1 16 300 260
1 37 800 256
1 41 700 230 Climate in terms of temperature rate
2 24 400 170
2 27 567 184 Return is the AGDP
1 34 373 110
1 36 647 128
2 37 534 134

THE ANALYSIS
Regression equation is as follows
LnAGDP = β0 + β1*health + β2*climate +
β3*urbanization
we define β1, β2 and β3 as the coefficients of
the independent variables,
AGDP is the annual gross domestic product of
health, climate and urbanization
LnAGDP(Annual Gross Domestic Product) is the
dependent variable while health, climate and
urbanization are the independent variables
We proceed to do the analysis with SPSS as
follows
You're viewing a preview
Unlock full access by subscribing today!

Reliability of the data
R2 of the data is 0.732. This means that the Health, Urbanization and Climate
(Independent variables) explains 73.2% of the Annual Gross Domestic Product
(dependent variable). Hence our data is reliable.
R2 of the data is 0.732. This means that the Health, Urbanization and Climate
(Independent variables) explains 73.2% of the Annual Gross Domestic Product
(dependent variable). Hence our data is reliable.
Paraphrase This Document
Need a fresh take? Get an instant paraphrase of this document with our AI Paraphraser

Regression Equation

β0= 294.967 β1=-37.594 β2=-8.669
β1=0.408
We can therefore fit in our model LnAGDP = β0 +
β1*urbanization + β2*health + β3*Climate
LnAGDP = 294.967 -37.594*health – 08.669*Climate +
0.408*urbanization
The model means that;
For every that
For 1 unit increase in ill-health decreases the Annual Gross
Domestic Product by 37.594 and Vice Vasa
For 1 unit increase in Temperature (Climate) decreases the
Annual Gross Domestic Product by 8.669 and vice vasa
For 1 unit increase in Urban Centers (Urbanization) increases
the Annual Gross Domestic Product by 0.408 and vice vasa
You're viewing a preview
Unlock full access by subscribing today!

Multicollinearity check
Multicollinearity occur when Variance Inflation Factor
(VIF) is less than 10. In our analysis, the VIF is as
follows
Health=1.005
Climate=2.446
Urbanization=2.438
This imply that multicollinearity does not affect our
model and we can therefore put our trust to the
calculated coefficients and the p-value with no further
action
By checking the p values of the independent variables,
we notice that the p values are less than 0.05 hence
Paraphrase This Document
Need a fresh take? Get an instant paraphrase of this document with our AI Paraphraser

Normality of the data

You're viewing a preview
Unlock full access by subscribing today!
1 out of 9
Related Documents

Your All-in-One AI-Powered Toolkit for Academic Success.
+13062052269
info@desklib.com
Available 24*7 on WhatsApp / Email
Unlock your academic potential
© 2024 | Zucol Services PVT LTD | All rights reserved.