MITS6002 Business Analytics: Low Birth Weight Presentation
VerifiedAdded on 2022/09/16
|8
|549
|24
Presentation
AI Summary
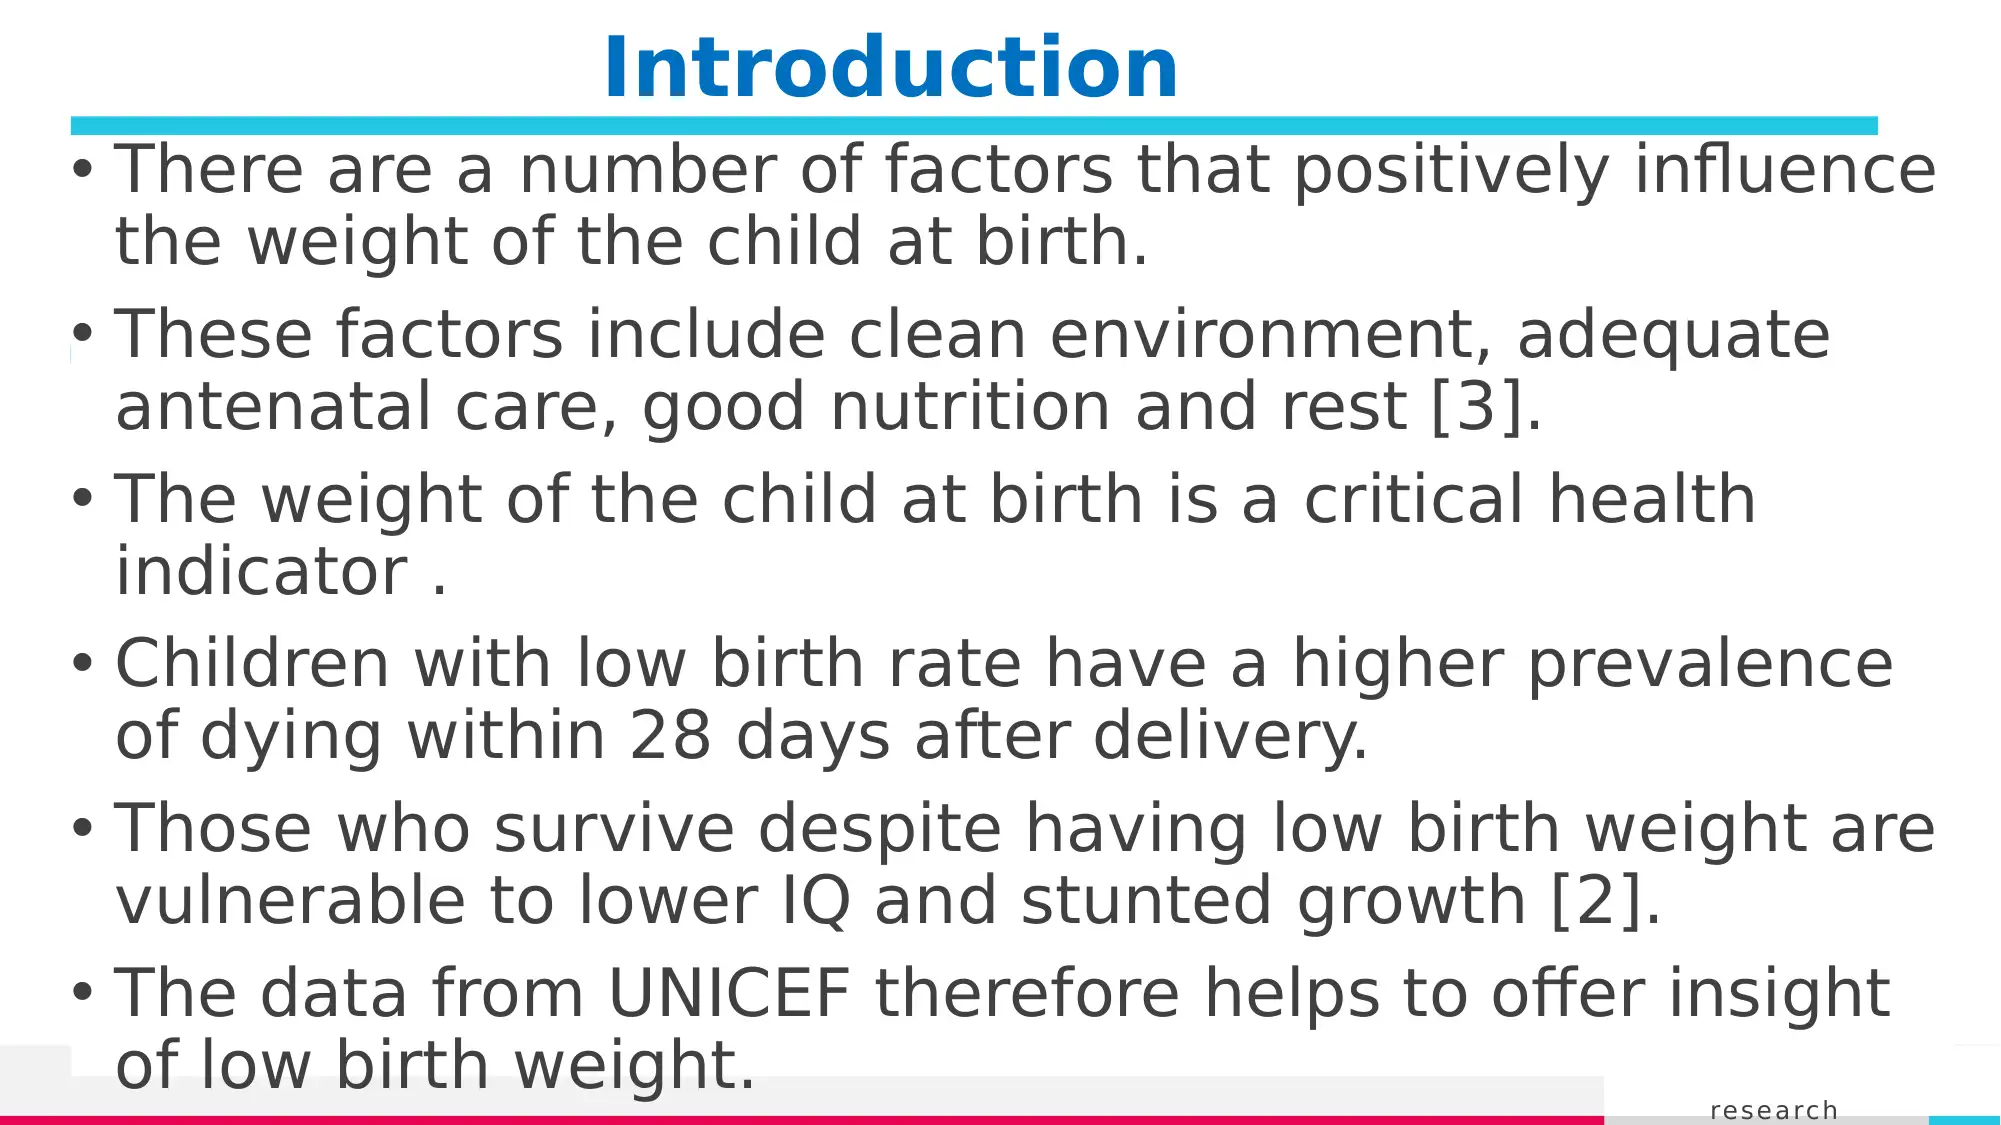
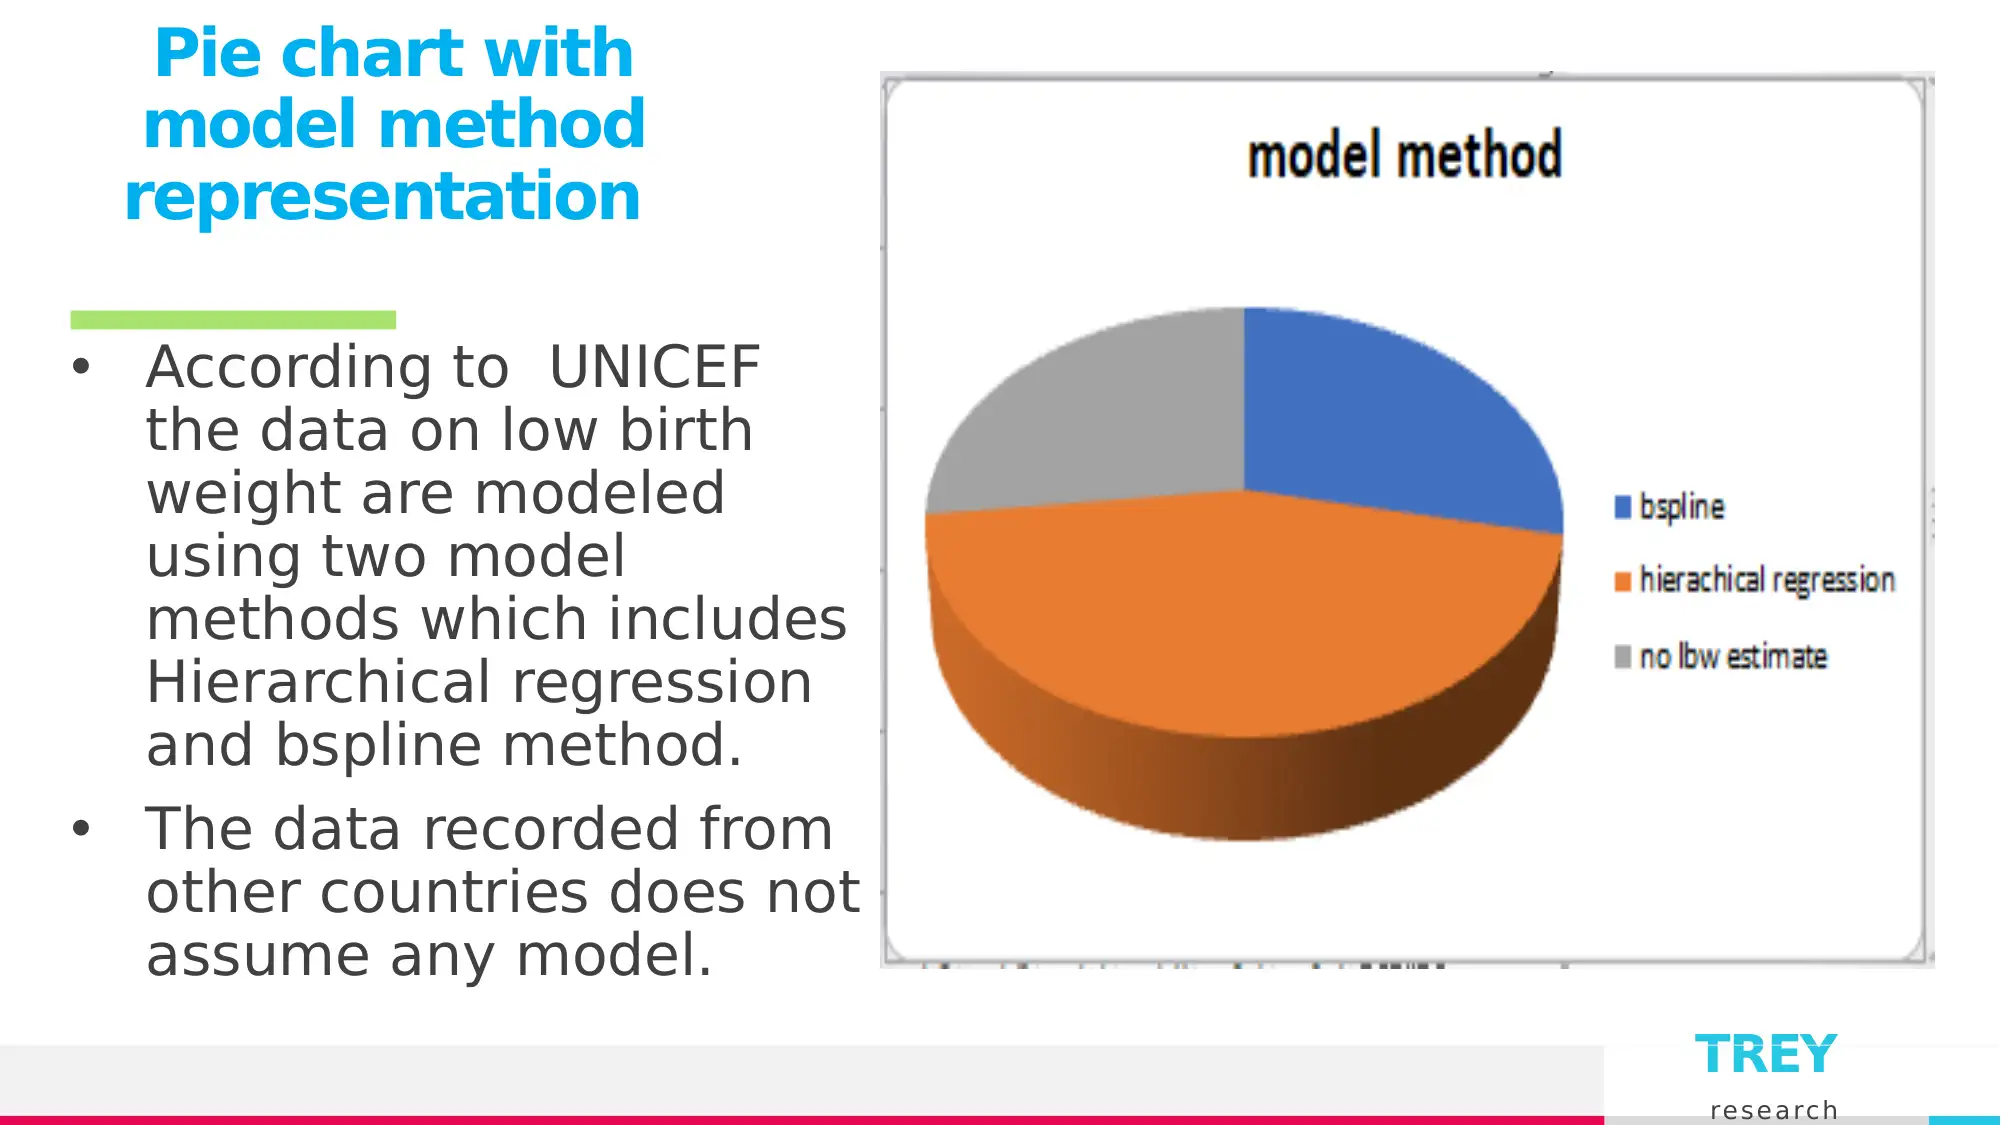
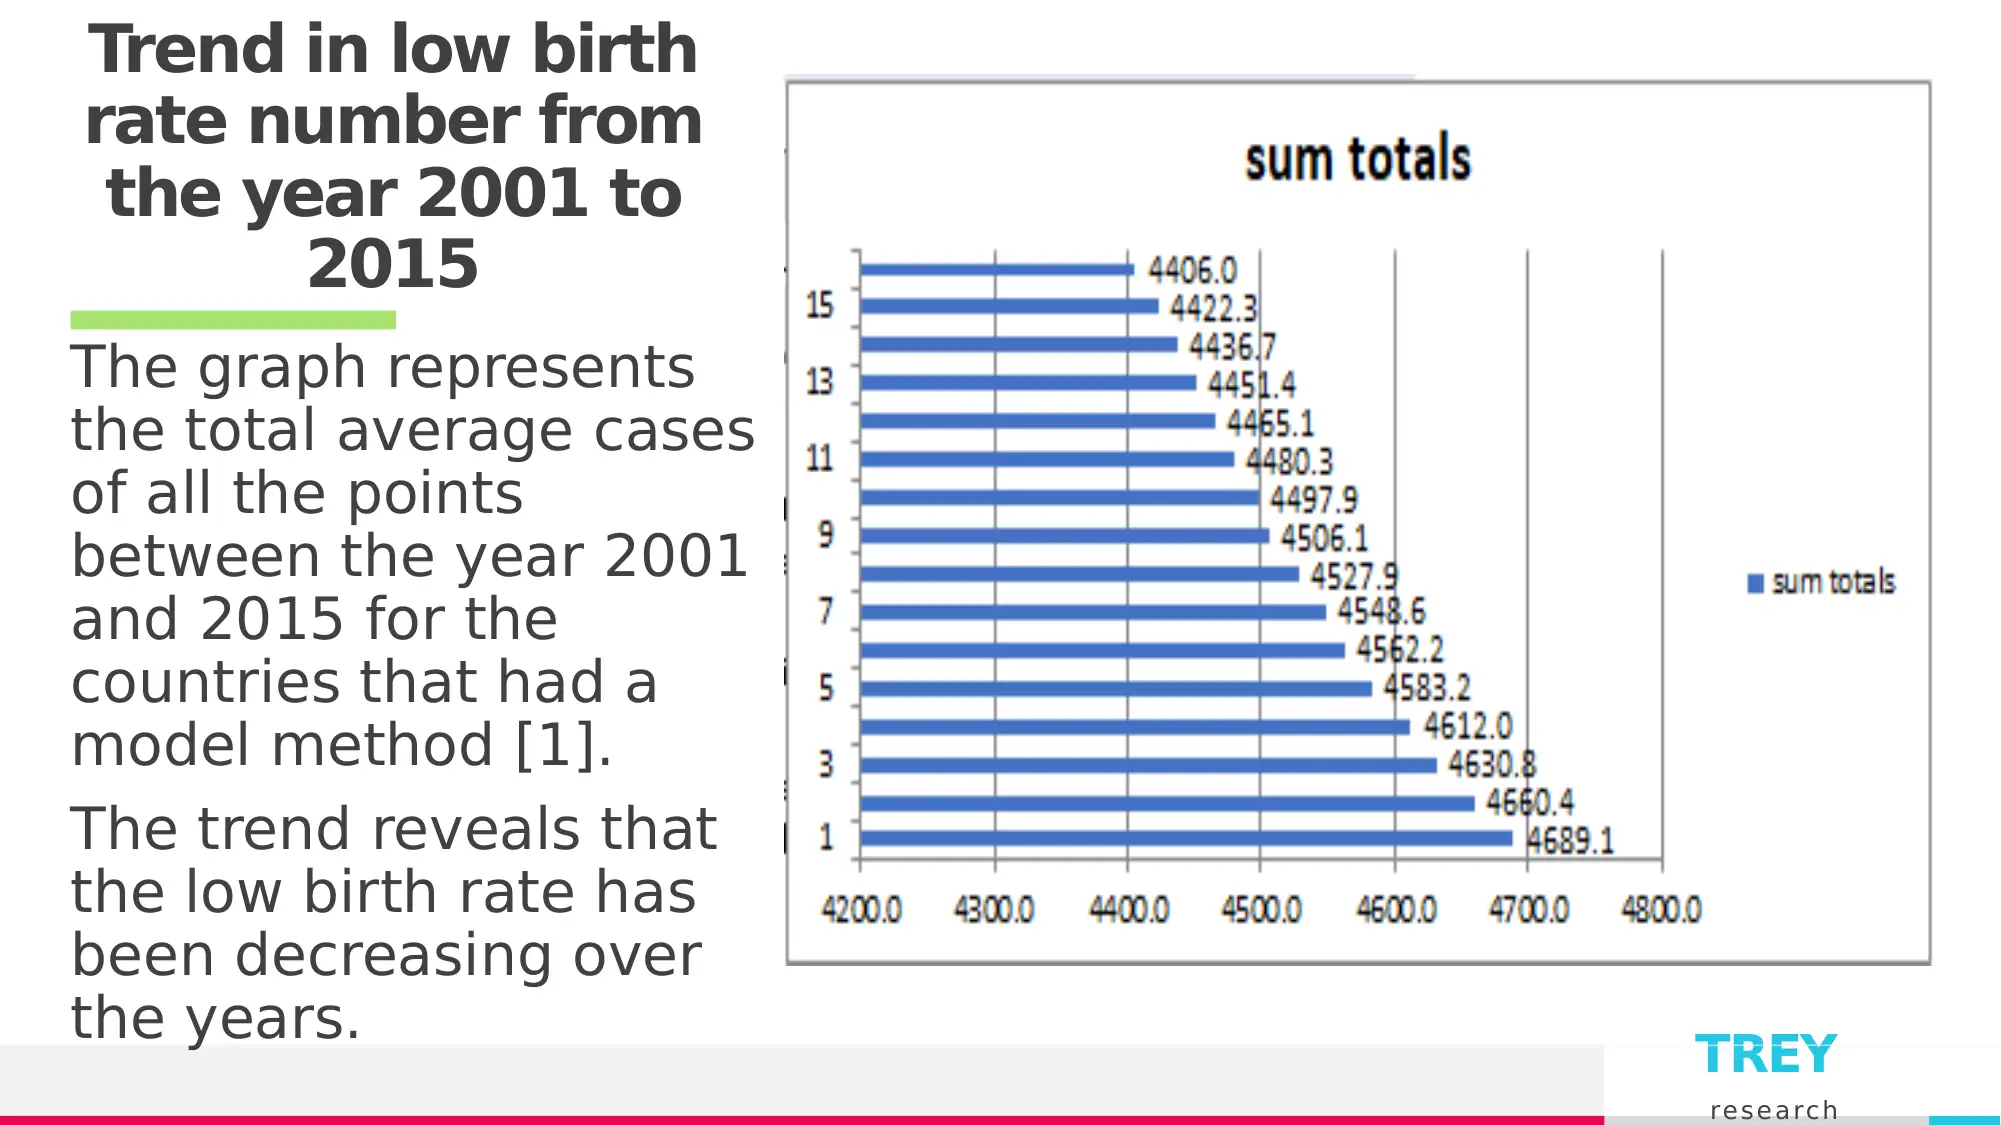
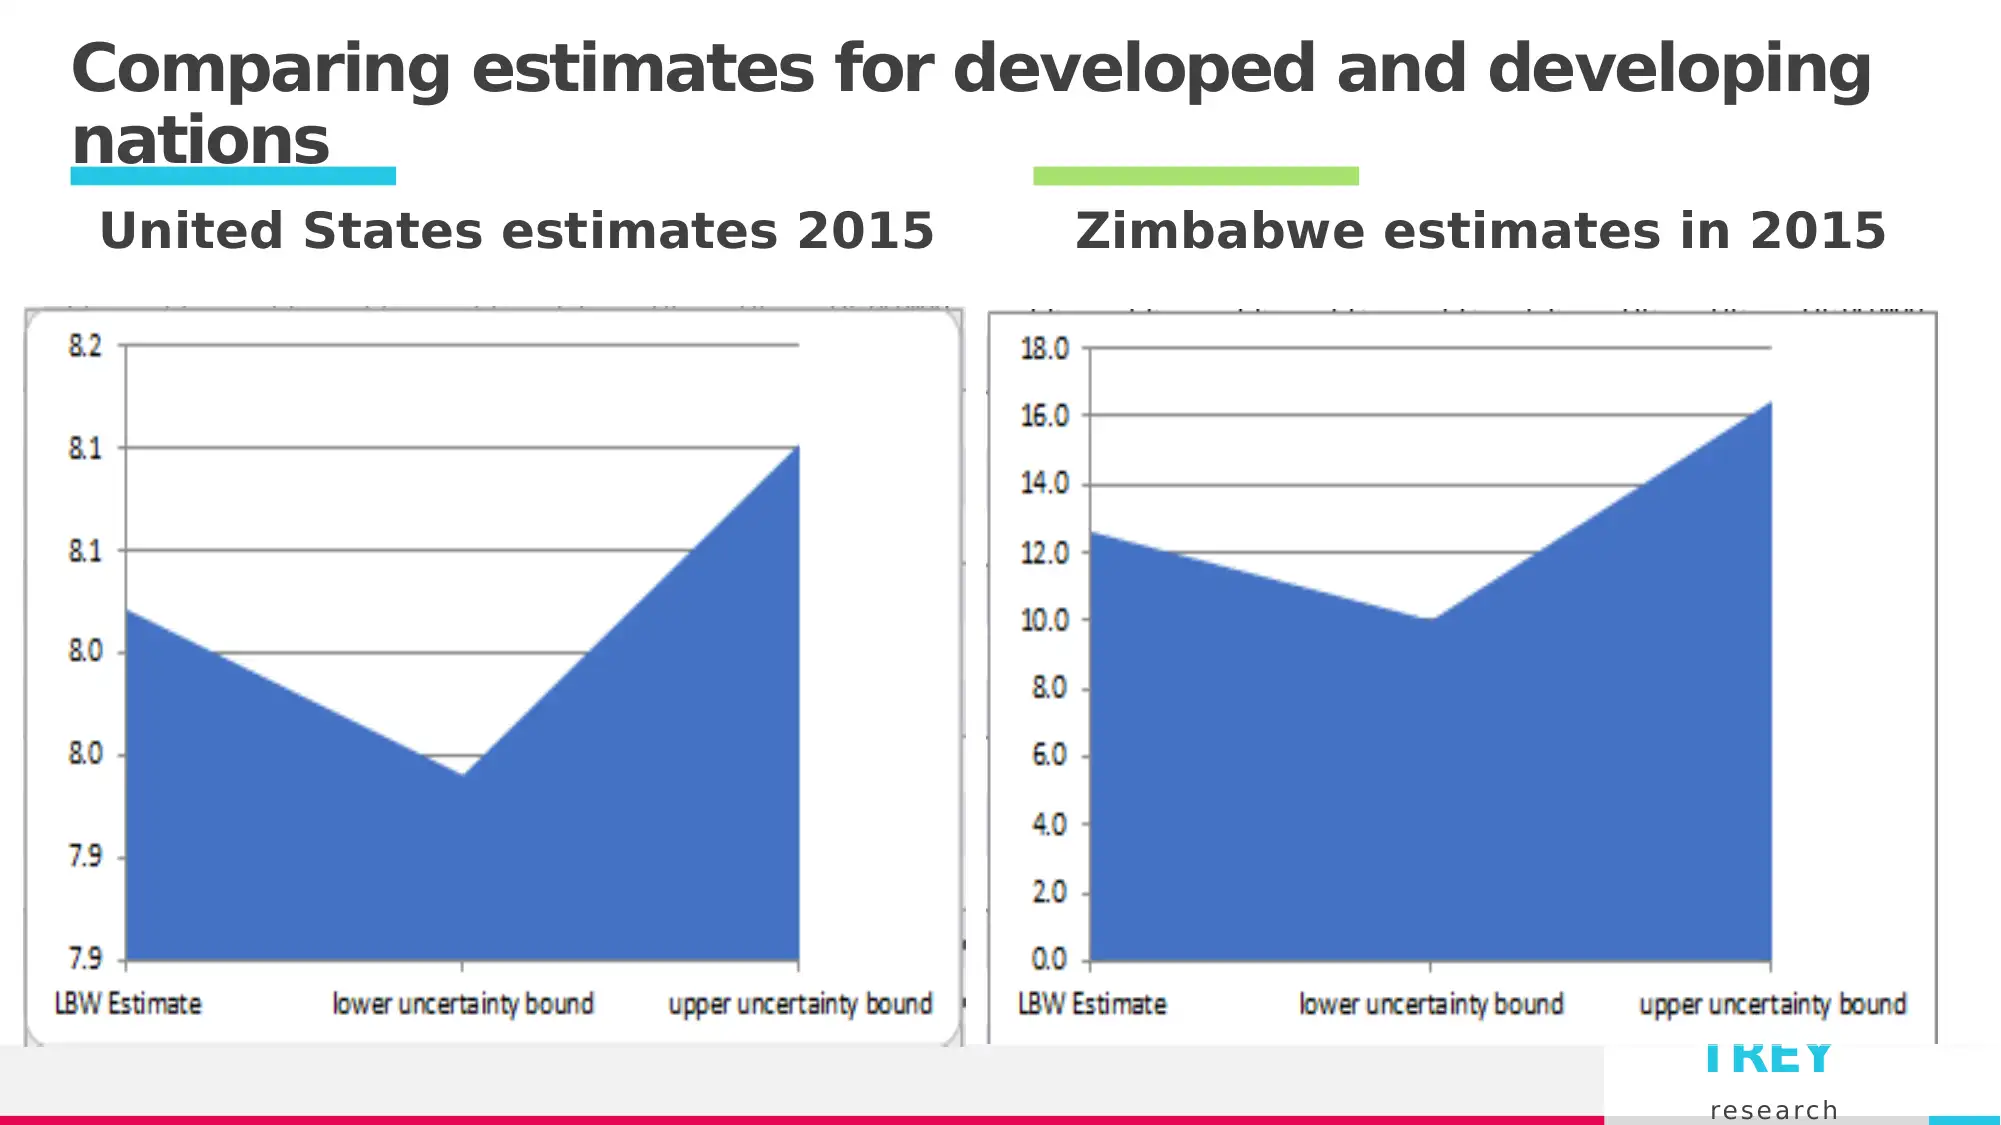
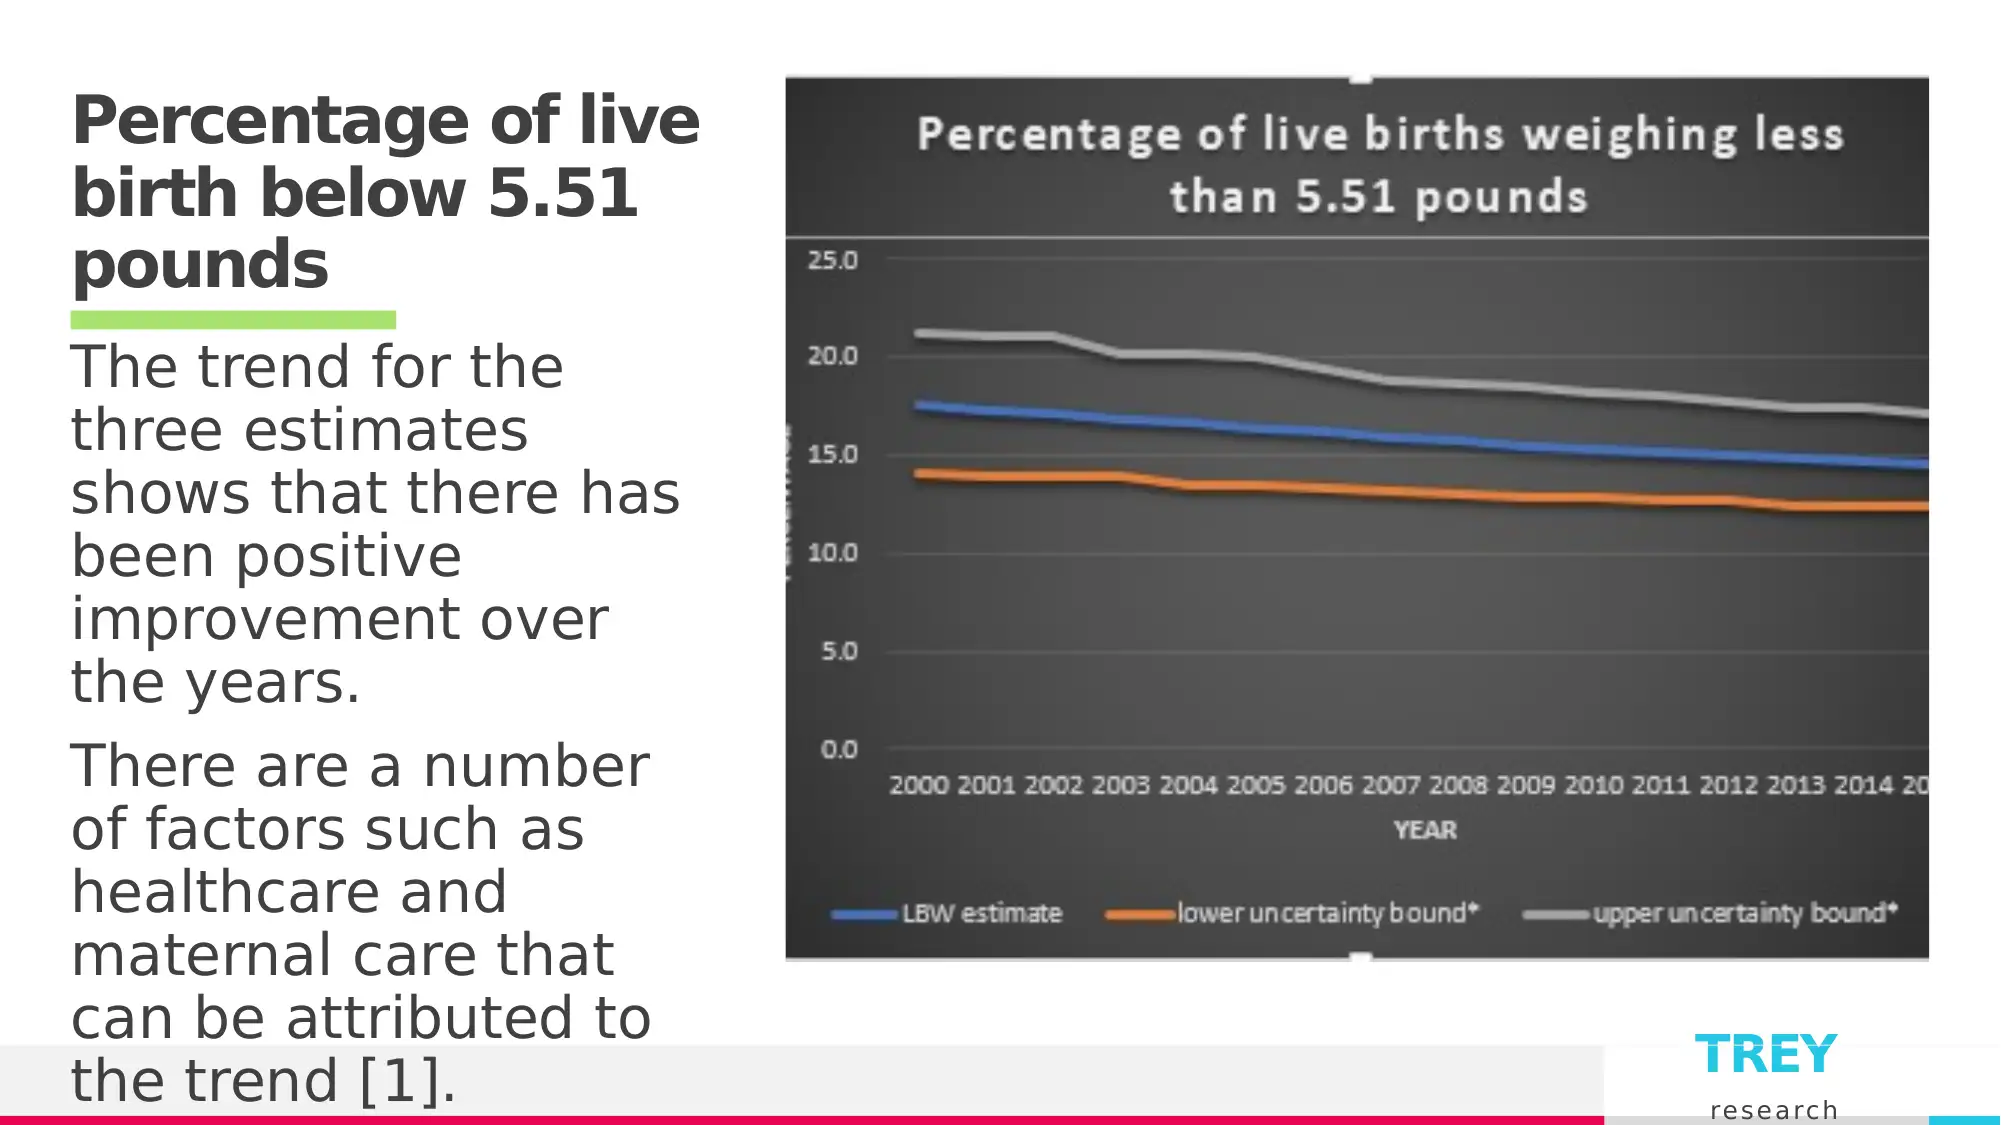
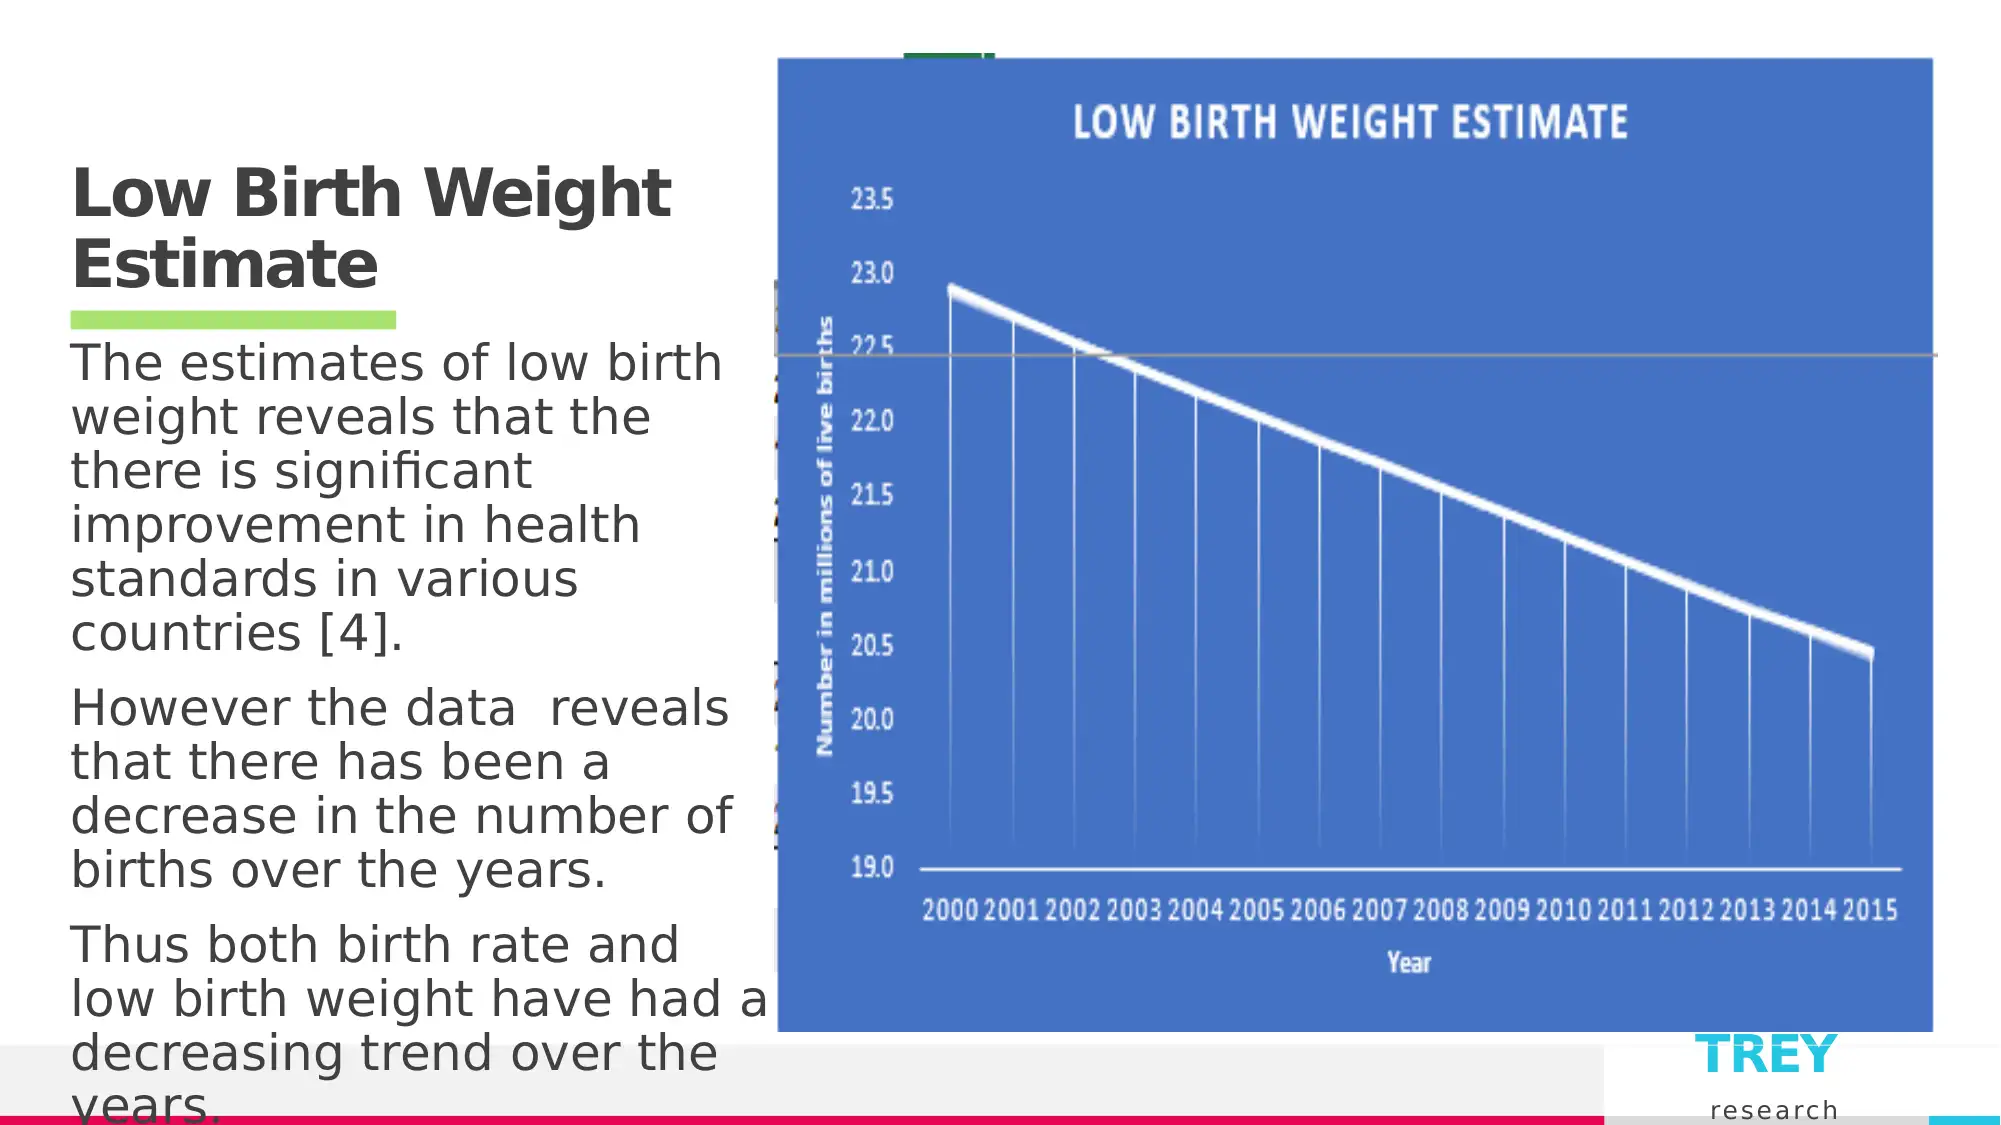
This presentation analyzes low birth weight data, focusing on factors influencing birth weight, such as clean environments, antenatal care, and nutrition. It utilizes UNICEF data and explores trends from 2001 to 2015, employing hierarchical regression and bspline methods. The presentation compares estimates for developed and developing nations, highlighting improvements in health standards, though noting a decrease in births over the years. References include sources like UNICEF DATA and research on the impacts of low birth weight, providing a comprehensive overview of the topic.

Insert or Drag and Drop your Photo Here
Low Birth Weight
Low Birth Weight
Paraphrase This Document
Need a fresh take? Get an instant paraphrase of this document with our AI Paraphraser

TREY
re s e a rc h
Introduction
• There are a number of factors that positively influence
the weight of the child at birth.
• These factors include clean environment, adequate
antenatal care, good nutrition and rest [3].
• The weight of the child at birth is a critical health
indicator .
• Children with low birth rate have a higher prevalence
of dying within 28 days after delivery.
• Those who survive despite having low birth weight are
vulnerable to lower IQ and stunted growth [2].
• The data from UNICEF therefore helps to offer insight
of low birth weight.

TREY
re s e a rc h
Pie chart with
model method
representation
• According to UNICEF
the data on low birth
weight are modeled
using two model
methods which includes
Hierarchical regression
and bspline method.
• The data recorded from
other countries does not
assume any model.
Click icon to add picture
re s e a rc h
Pie chart with
model method
representation
• According to UNICEF
the data on low birth
weight are modeled
using two model
methods which includes
Hierarchical regression
and bspline method.
• The data recorded from
other countries does not
assume any model.
Click icon to add picture
⊘ This is a preview!⊘
Do you want full access?
Subscribe today to unlock all pages.

Trusted by 1+ million students worldwide

TREY
re s e a rc h
Trend in low birth
rate number from
the year 2001 to
2015
The graph represents
the total average cases
of all the points
between the year 2001
and 2015 for the
countries that had a
model method [1].
The trend reveals that
the low birth rate has
been decreasing over
the years.
Click icon to add picture
Paraphrase This Document
Need a fresh take? Get an instant paraphrase of this document with our AI Paraphraser

TREY
re s e a rc h
Comparing estimates for developed and developing
nations
United States estimates 2015 Zimbabwe estimates in 2015
re s e a rc h
Comparing estimates for developed and developing
nations
United States estimates 2015 Zimbabwe estimates in 2015

TREY
re s e a rc h
Percentage of live
birth below 5.51
pounds
The trend for the
three estimates
shows that there has
been positive
improvement over
the years.
There are a number
of factors such as
healthcare and
maternal care that
can be attributed to
the trend [1].
re s e a rc h
Percentage of live
birth below 5.51
pounds
The trend for the
three estimates
shows that there has
been positive
improvement over
the years.
There are a number
of factors such as
healthcare and
maternal care that
can be attributed to
the trend [1].
⊘ This is a preview!⊘
Do you want full access?
Subscribe today to unlock all pages.

Trusted by 1+ million students worldwide

TREY
re s e a rc h
Low Birth Weight
Estimate
The estimates of low birth
weight reveals that the
there is significant
improvement in health
standards in various
countries [4].
However the data reveals
that there has been a
decrease in the number of
births over the years.
Thus both birth rate and
low birth weight have had a
decreasing trend over the
years.
Click icon to add picture
Paraphrase This Document
Need a fresh take? Get an instant paraphrase of this document with our AI Paraphraser

TREY
re s e a rc h
References
• [1]UNICEF, "Child Nutrition - UNICEF DATA", UNICEF DATA, 2020.
[Online]. Available: https://data.unicef.org/topic/nutrition/child-
nutrition/. [Accessed: 10- Apr- 2020].
• [2]N. Grote, J. Bridge, A. Gavin, J. Melville, S. Iyengar and W. Katon, "A
Meta-analysis of Depression During Pregnancy and the Risk of Preterm
Birth, Low Birth Weight, and Intrauterine Growth Restriction", Archives
of General Psychiatry, vol. 67, no. 10, p. 1012, 2010. Available:
10.1001/archgenpsychiatry.2010.111.
• [3]A. Rodríguez, S. De Ugarte, E. Guerra, A. Azpeitia and A. Valls I Soler,
"425 Mortality Risk Scores for Very-Lowbirthweight Infants (VLBWI)
Admitted to a Single Neonatal Unit (NICU) in a 15 Year Period", Pediatric
Research, vol. 68, pp. 218-219, 2010. Available: 10.1203/00006450-
201011001-00425.
• [4]D. Kumar, D. Mukhopadhyay, D. Malhi and D. Bhalla, "GROWTH,
NEURODEVELOPMENT IN EXTREMELY LOWBIRTH BABIES AT TWO YEAR
OF CORRECTED AGE", International Journal of Medical and Biomedical
1 out of 8
Related Documents
Your All-in-One AI-Powered Toolkit for Academic Success.
+13062052269
info@desklib.com
Available 24*7 on WhatsApp / Email
Unlock your academic potential
Copyright © 2020–2026 A2Z Services. All Rights Reserved. Developed and managed by ZUCOL.


