MITS6002 Business Analytics: CommBank Retail Insights Report FY18

Verified

Added on  2023/03/30

|10
|1865
|483
Report
AI Summary
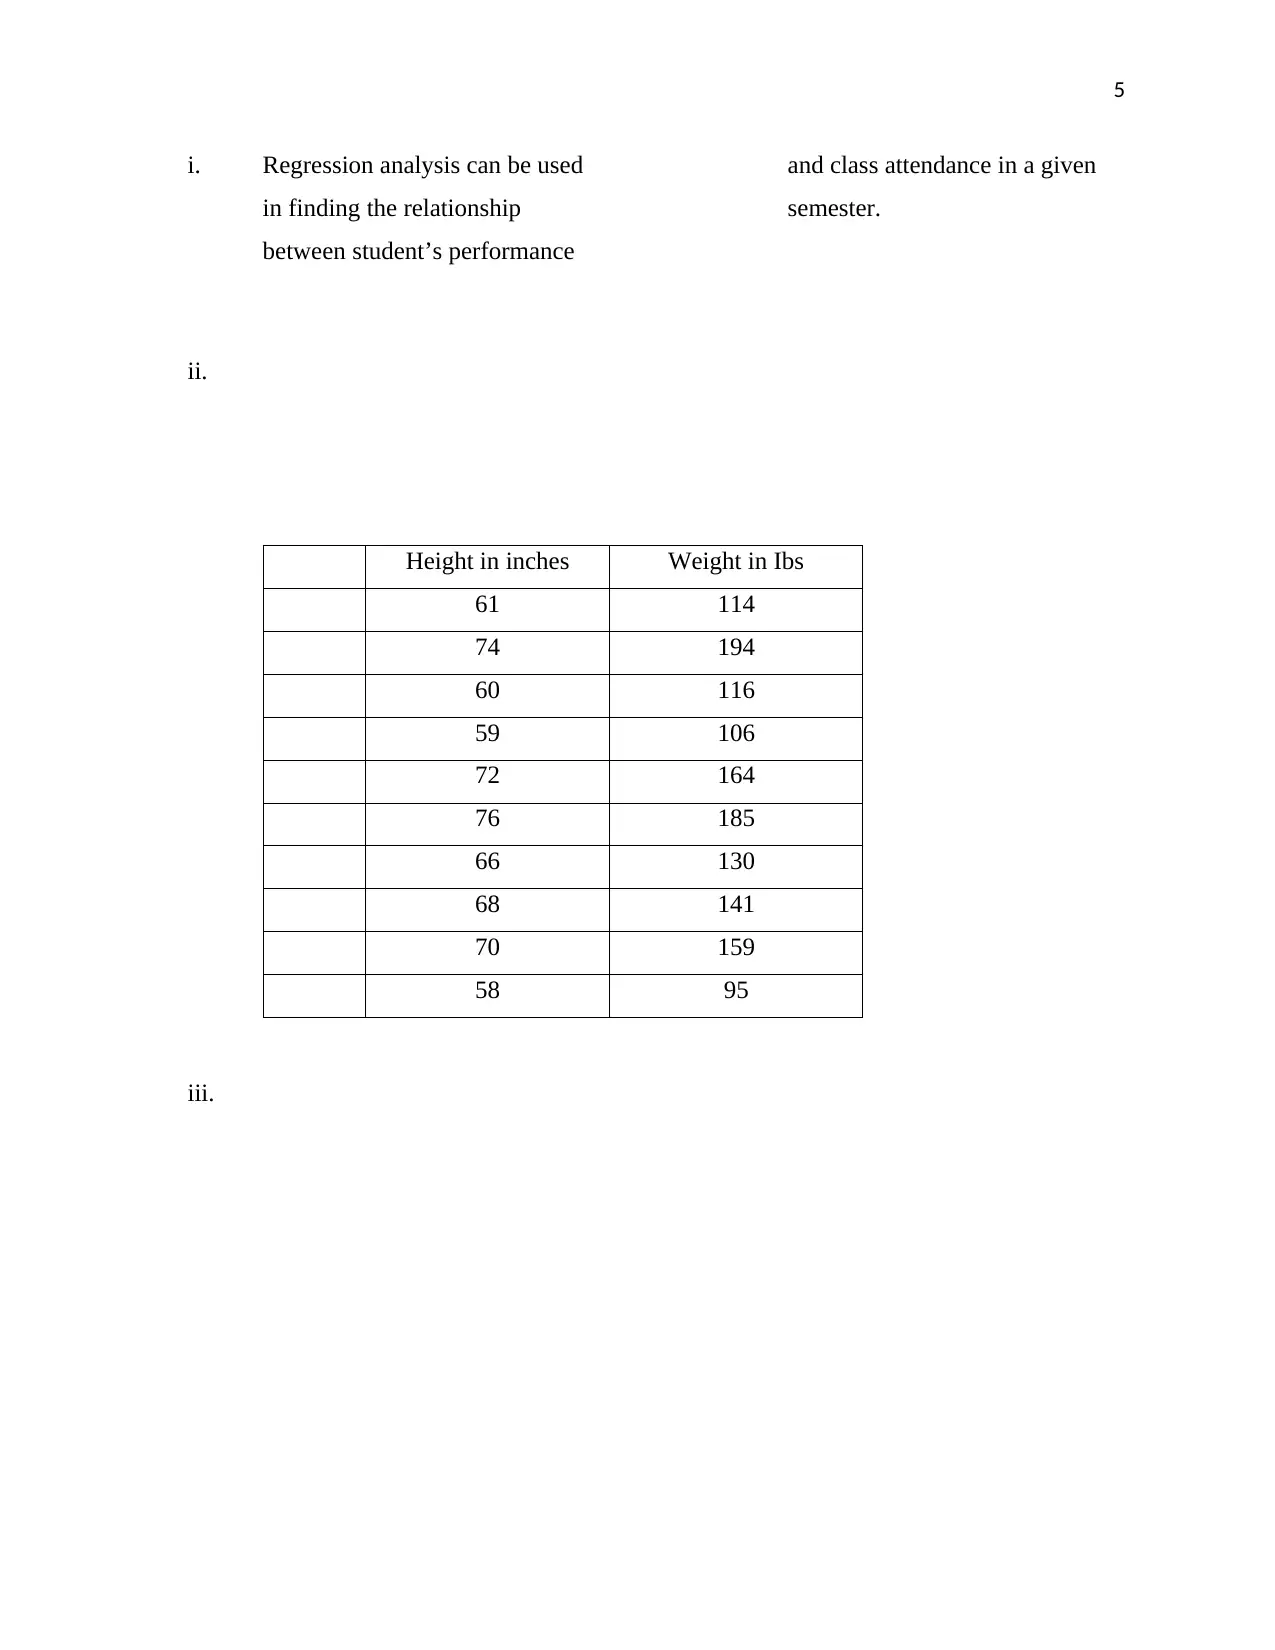
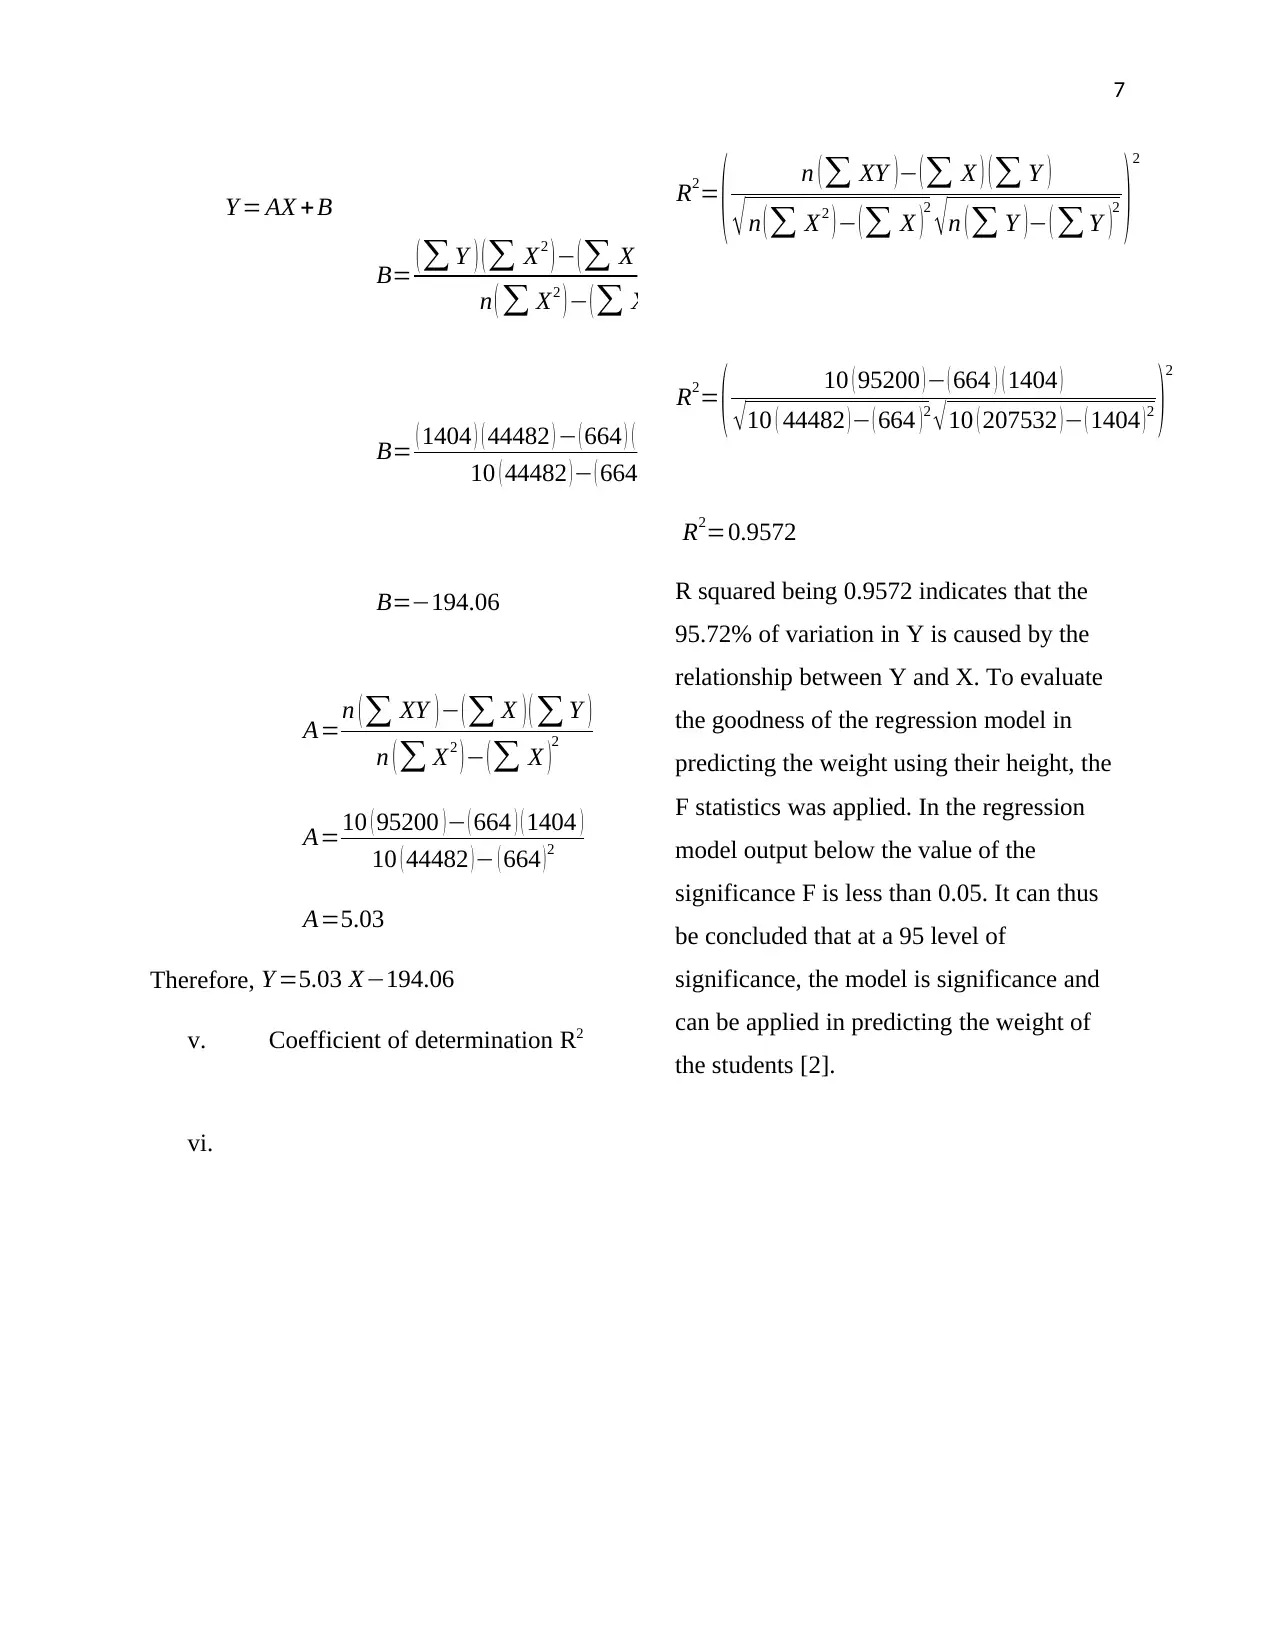
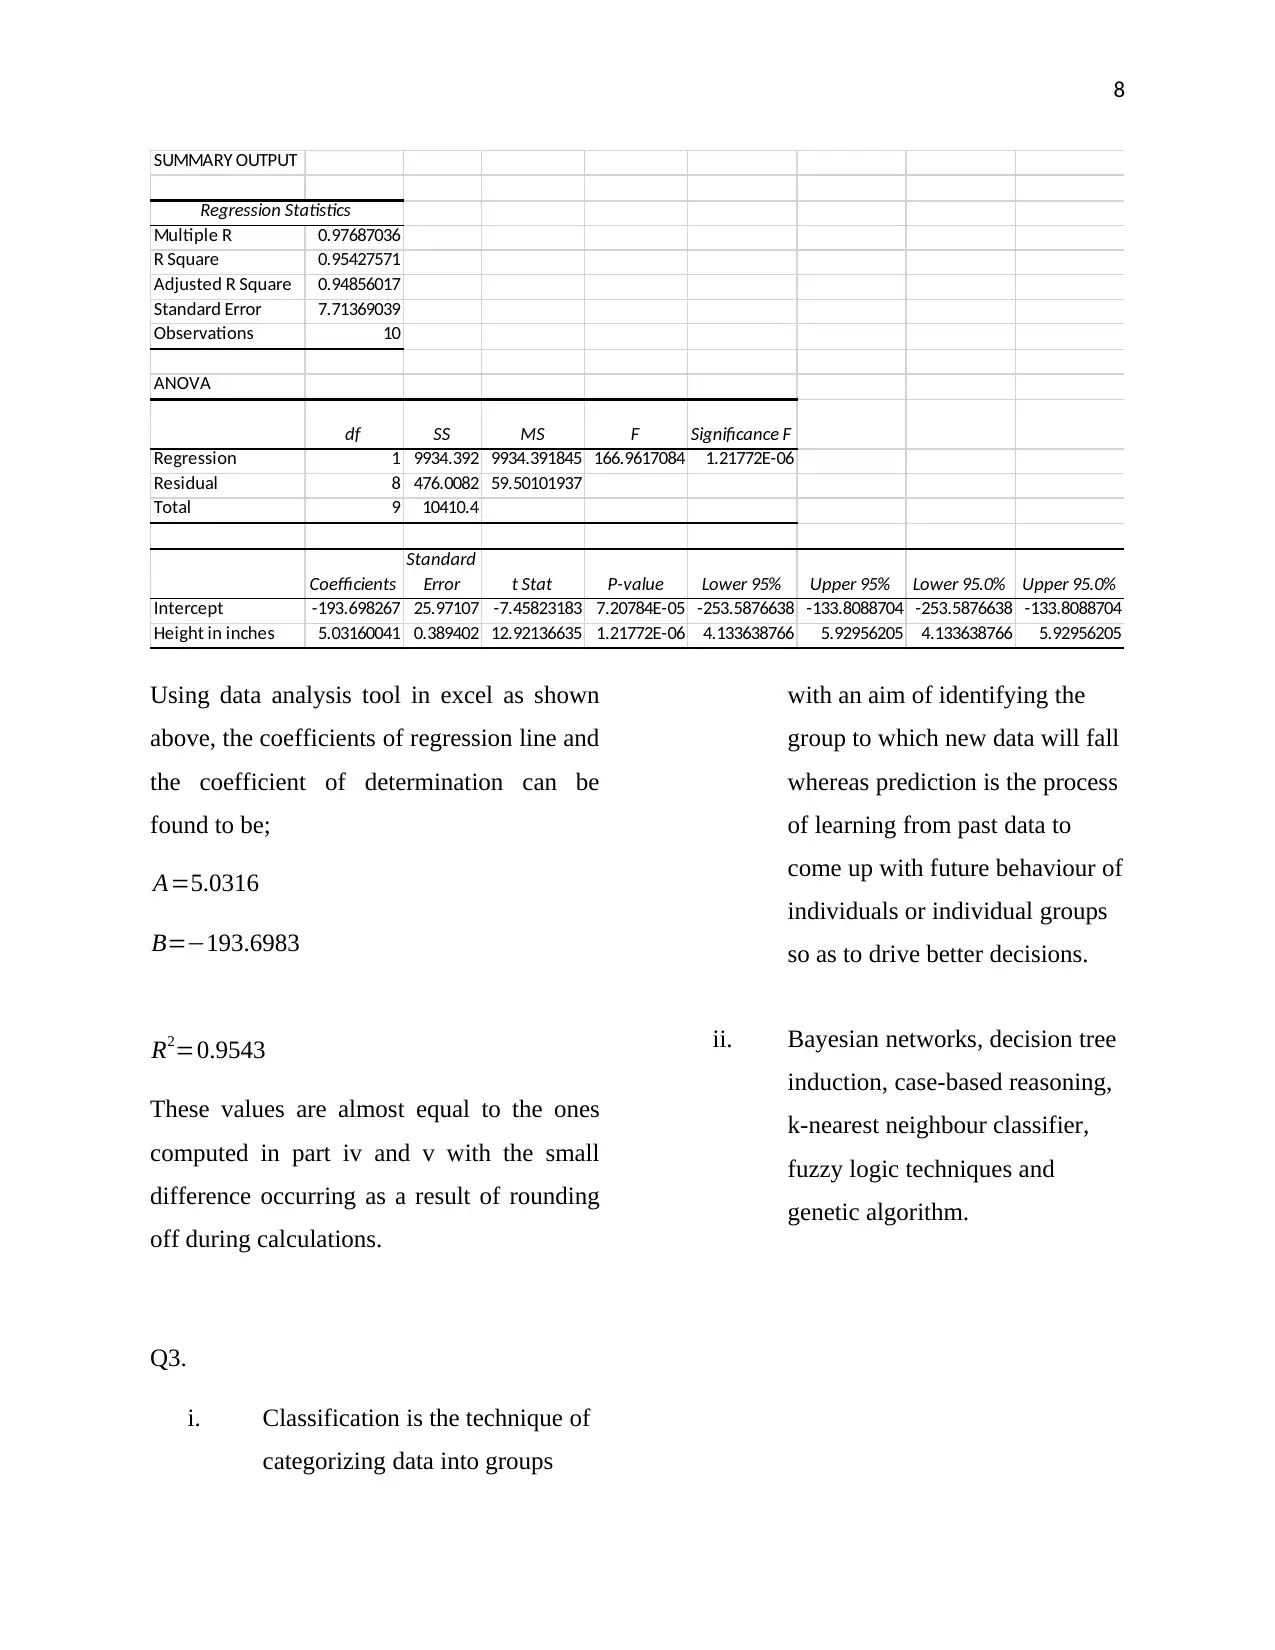
This report provides a comprehensive analysis of the CommBank Retail Business Insights Report FY18, evaluating its overall features, visualization quality, presentability, and information provided. It identifies key information derived from the report and explains its usefulness in decision-making, along with suggested improvements. The report includes a regression analysis example, using height and weight data to compute the regression line equation and R2 value. Additionally, it discusses classification techniques, clustering concepts, and their applications in business analytics, referencing neural networks and data analysis tools. The document concludes with a summary of the findings and relevant references. Desklib offers a wide range of solved assignments for students.
Document Page
1
COMPUTER ANALYTICS
By Student’s Name
Code + Name of Course
Professor’s Name
University
City (State)
Date
tabler-icon-diamond-filled.svg

Paraphrase This Document

Need a fresh take? Get an instant paraphrase of this document with our AI Paraphraser
Document Page
2
Q1.
i. The insight report is simple,
complete and ease to
understand.
Its quality of visualisation is
presented in a more desirable and
meaningful manner. A clear
picture of the retailer’s section is
displayed on the cover page to
give the audience an insight of
how the market looks like on
average. The good quality of
visualisation is also seen by the
colouring used and also the
statistical graphs that give the
audience a summary and
overview of the data. The bar
graphs for instance, are clearly
displayed for ease of
differentiation of the variables
that are used in the graph
plotting. The neural networks do
present the information on
clustering of retailers in a clear
and simple manner too.
The insight report’s
presentability is generally simple
for the audience to understand. It
minimises amount of thinking
required in order to understand
the report as it contains
summaries of the report in
graphical forms. The ideas flow
naturally too as the report allows
transition from one level to
another in an ideological manner.
The insight report provides
useful information to its target
audience as it helps in decision
making. The information
provided in the report is relevant
too because it is easy and simple
to understand and helps in
decision making process by the
target audience. The information
is also complete in the sense that
it contains all the elements
required in a report for it to be
understood easily. It is also clear,
that is; passing of the message to
the target audience is in a way
that makes it easy to understand.
Being unique type of information
is also a good quality of the
report since it is very useful as it
is not a copy of another report,
hence can be compared with
other reports during decision
making process.
ii. Innovation performance on
retailers has fallen behind the
Document Page
3
national average. The activity
is at its highest among multi-
channel retailers. This
therefore requires retailers to
adapt products and services
that make the most of
opportunities.
Even though the average rate
of innovation within the
Australian retain industry has
been steady for the past 12
months, there is moderate
uplift in the presence of
entrepreneurial behaviour and
capabilities that are tasked
with supporting innovation.
Innovation activities are at
their peak among the multi-
channel retailers but this has
experienced a drastic fall
when the pure online
operators are analysed.
Another finding from the
report is that retailers have
embedded the range of
attributes and capabilities that
did foster innovation in the
past years. They are less
responsive to opportunities
that entails incorporating
innovative act ivies among
their staff as well as in the
evaluation process. The
retailers instead have
increased their risk
averseness and are more
relaxed to venture in to
uncertain investments.
The information from the
report is useful in business
decision making as it
identifies some of the market
niches that a business need to
focus on. From the report its
evident that retailers are
shying away rom ventures
that demand innovative
strategies, this means that for
a business that aimed at
successful launch of a new
product, there is a market
opportunity that can be
exploited. Business strategic
decisions are more relevant if
they assist the firm gain a
competitive advantage over
the others. By under taking
innovative steps a retailer is
in a better position to gain
adequate market share and
Document Page
4
prosper in creating a large
consumer base [1].
iii. Due to competitive pressure
and desire to drive
efficiencies within their
businesses, Australian retail
sector appeared to adopt
innovative mindset to ensure
maximisation of available
opportunities. As at 2018
87% of retailers were either
innovation active or
improvers.
While the overall rate of
innovation remained steady over
12 months, there was a moderate
uplift in the presence of
entrepreneurial behaviours and
capabilities that supported
innovation. Despite these,
however, retailers fell behind
national average. For this it was
clear that innovation was at its
highest among multi-channel
retailers.
Retailers were less inclined to
look for and respond to
opportunities as compared to
average of all industries even
though they had further
embedded on a range of
behaviours that enabled
innovation over the year before.
This is because their main focus
was to enhance outcomes for
customers thus raising
competitiveness and internal
processes.
Retailers became the most likely
to invest in innovative sales and
marketing approaches as in line
with increased levels of
marketing activities that occurred
within the industry.
Almost two dollars for every
dollar invested in innovation was
the return for the retailers whom
in most cases expected to realise
a short-term return from the
investment, with one in two
anticipating a payback period of
less than half a year.
iv. The insight report can be
improved by focusing more
on innovation performance
by retailers.
Q2.
tabler-icon-diamond-filled.svg

Paraphrase This Document

Need a fresh take? Get an instant paraphrase of this document with our AI Paraphraser
Document Page
5
i. Regression analysis can be used
in finding the relationship
between student’s performance
and class attendance in a given
semester.
ii.
Height in inches Weight in Ibs
61 114
74 194
60 116
59 106
72 164
76 185
66 130
68 141
70 159
58 95
iii.
Document Page
6
80
100
120
140
160
180
200
55 60 65 70 75 80
Weight in Ibs
Height in Inches
Scatter Plot
As observed from the scatter plot above, the weight has a positive linear relationship with
the height.
iv. Let height be X and weight be Y;
Number X Y X2 Y 2 XY
1 61 114 3721 12996 6954
2 74 194 5476 37636 14356
3 60 116 3600 13456 6960
4 59 106 3481 11236 6254
5 72 164 5184 26896 11808
6 76 185 5776 34225 14060
7 66 130 4356 16900 8580
8 68 141 4624 19881 9588
9 70 159 4900 25281 11130
10 58 95 3364 9025 5510
Total 664 1404 44482 207532 95200
Document Page
7
Y = AX +B
B= ( Y ) ( X2 ) ( X ) ( XY )
n ( X2 ) ( X )
2
B= ( 1404 ) ( 44482 ) ( 664 ) ( 95200 )
10 ( 44482 ) ( 664 ) 2
B=194.06
A=n ( XY ) ( X )( Y )
n ( X2 ) ( X )2
A=10 ( 95200 ) ( 664 ) ( 1404 )
10 ( 44482 ) ( 664 ) 2
A=5.03
Therefore, Y =5.03 X194.06
v. Coefficient of determination R2
R2= ( n ( XY ) ( X ) ( Y )
n ( X2 ) ( X )2
n ( Y ) ( Y )2 )2
R2= ( 10 ( 95200 ) ( 664 ) ( 1404 )
10 ( 44482 ) ( 664 )2 10 ( 207532 ) ( 1404 )2 )2
R2=0.9572
R squared being 0.9572 indicates that the
95.72% of variation in Y is caused by the
relationship between Y and X. To evaluate
the goodness of the regression model in
predicting the weight using their height, the
F statistics was applied. In the regression
model output below the value of the
significance F is less than 0.05. It can thus
be concluded that at a 95 level of
significance, the model is significance and
can be applied in predicting the weight of
the students [2].
vi.
tabler-icon-diamond-filled.svg

Paraphrase This Document

Need a fresh take? Get an instant paraphrase of this document with our AI Paraphraser
Document Page
8
SUMMARY OUTPUT
Regression Statistics
Multiple R 0.97687036
R Square 0.95427571
Adjusted R Square 0.94856017
Standard Error 7.71369039
Observations 10
ANOVA
df SS MS F Significance F
Regression 1 9934.392 9934.391845 166.9617084 1.21772E-06
Residual 8 476.0082 59.50101937
Total 9 10410.4
Coefficients
Standard
Error t Stat P-value Lower 95% Upper 95% Lower 95.0% Upper 95.0%
Intercept -193.698267 25.97107 -7.45823183 7.20784E-05 -253.5876638 -133.8088704 -253.5876638 -133.8088704
Height in inches 5.03160041 0.389402 12.92136635 1.21772E-06 4.133638766 5.92956205 4.133638766 5.92956205
Using data analysis tool in excel as shown
above, the coefficients of regression line and
the coefficient of determination can be
found to be;
A=5.0316
B=193.6983
R2=0.9543
These values are almost equal to the ones
computed in part iv and v with the small
difference occurring as a result of rounding
off during calculations.
Q3.
i. Classification is the technique of
categorizing data into groups
with an aim of identifying the
group to which new data will fall
whereas prediction is the process
of learning from past data to
come up with future behaviour of
individuals or individual groups
so as to drive better decisions.
ii. Bayesian networks, decision tree
induction, case-based reasoning,
k-nearest neighbour classifier,
fuzzy logic techniques and
genetic algorithm.
Document Page
9
iii. y1=σ ( w5 h1 +w6 h2 ), where
h1=σ ( w1 i1+w3 i2+b1 )
h2 =σ ( w2 i1+w4 i2 +b2 )
Therefore,
y1=σ ( w5 ( σ ( w1 i1+ w3 i2+ b1 ) )+ w6 (σ ( w2 i1 + w4 i2+ b2 ) ) )
y1=σ2 ( w5 w1 i1+ w5 w3 i2+ w5 b1 +w6 w2 i1 +w6 w4 i2 +w6 b2 )
Neural networks are a set of algorithms
which are loosely modelled in resemblance
of the human brain and that are designed to
establish patterns. These networks interpret
sensory data using a kind of machine
perception that clusters raw input. The
recognized patterns are numerical and
contained in vector form into which all real-
world data must be translated, that is; sound,
images, text or time series.
iv.
Clustering is a concept applied in
databases to refer to the ability of a number
of servers to connect to for a unified
database. For instance, memory collection
and processes that interact with each other to
form unified database which is a set of
physical files that are meant to for data
storage. Clustering can be used for anomaly
detection as in identifying fraud
transactions. For a sample of say good
transactions only in a business, cluster
detection methods can be used to determine
the shape of the “normal” cluster. In this
case when a transaction comes along that
falls outside the cluster for any given reason
then it raises some suspicion.
In business analytics clustering can
often be used to break large set of data into
relatively smaller groups that are susceptible
to other techniques. An example here is
improving logistic regression results by
performing it separately on smaller clusters
that have different behaviours and may also
follow different distributions.
Clustering is also used to perform
customer, product or store segmentation in
business analytics. The three can be
clustered into hierarchical groups basing on
their attributes for instance stores clustered
based on sales, size or customer base;
products based on their use, size, brand or
flavour.
Document Page
10
References
[1] A. Mazzaferro, "Such a Murmur": Innovation, Rebellion, and Sovereignty in William Strachey's
"True Reportor," Early American Literature, vol. 53, no. 1, p. 3–32, 2018.
[2] A. C. Rencher and W. F. Christensen, Methods of Multivariate Analysis, John Wiley & Sons, 2012.
chevron_up_icon
1 out of 10
circle_padding
hide_on_mobile
zoom_out_icon
[object Object]