Analysis of Nestle Milo Supply Chain: MKG 721 Food Marketing Task 2
VerifiedAdded on 2023/06/08
|11
|1043
|308
Report
AI Summary
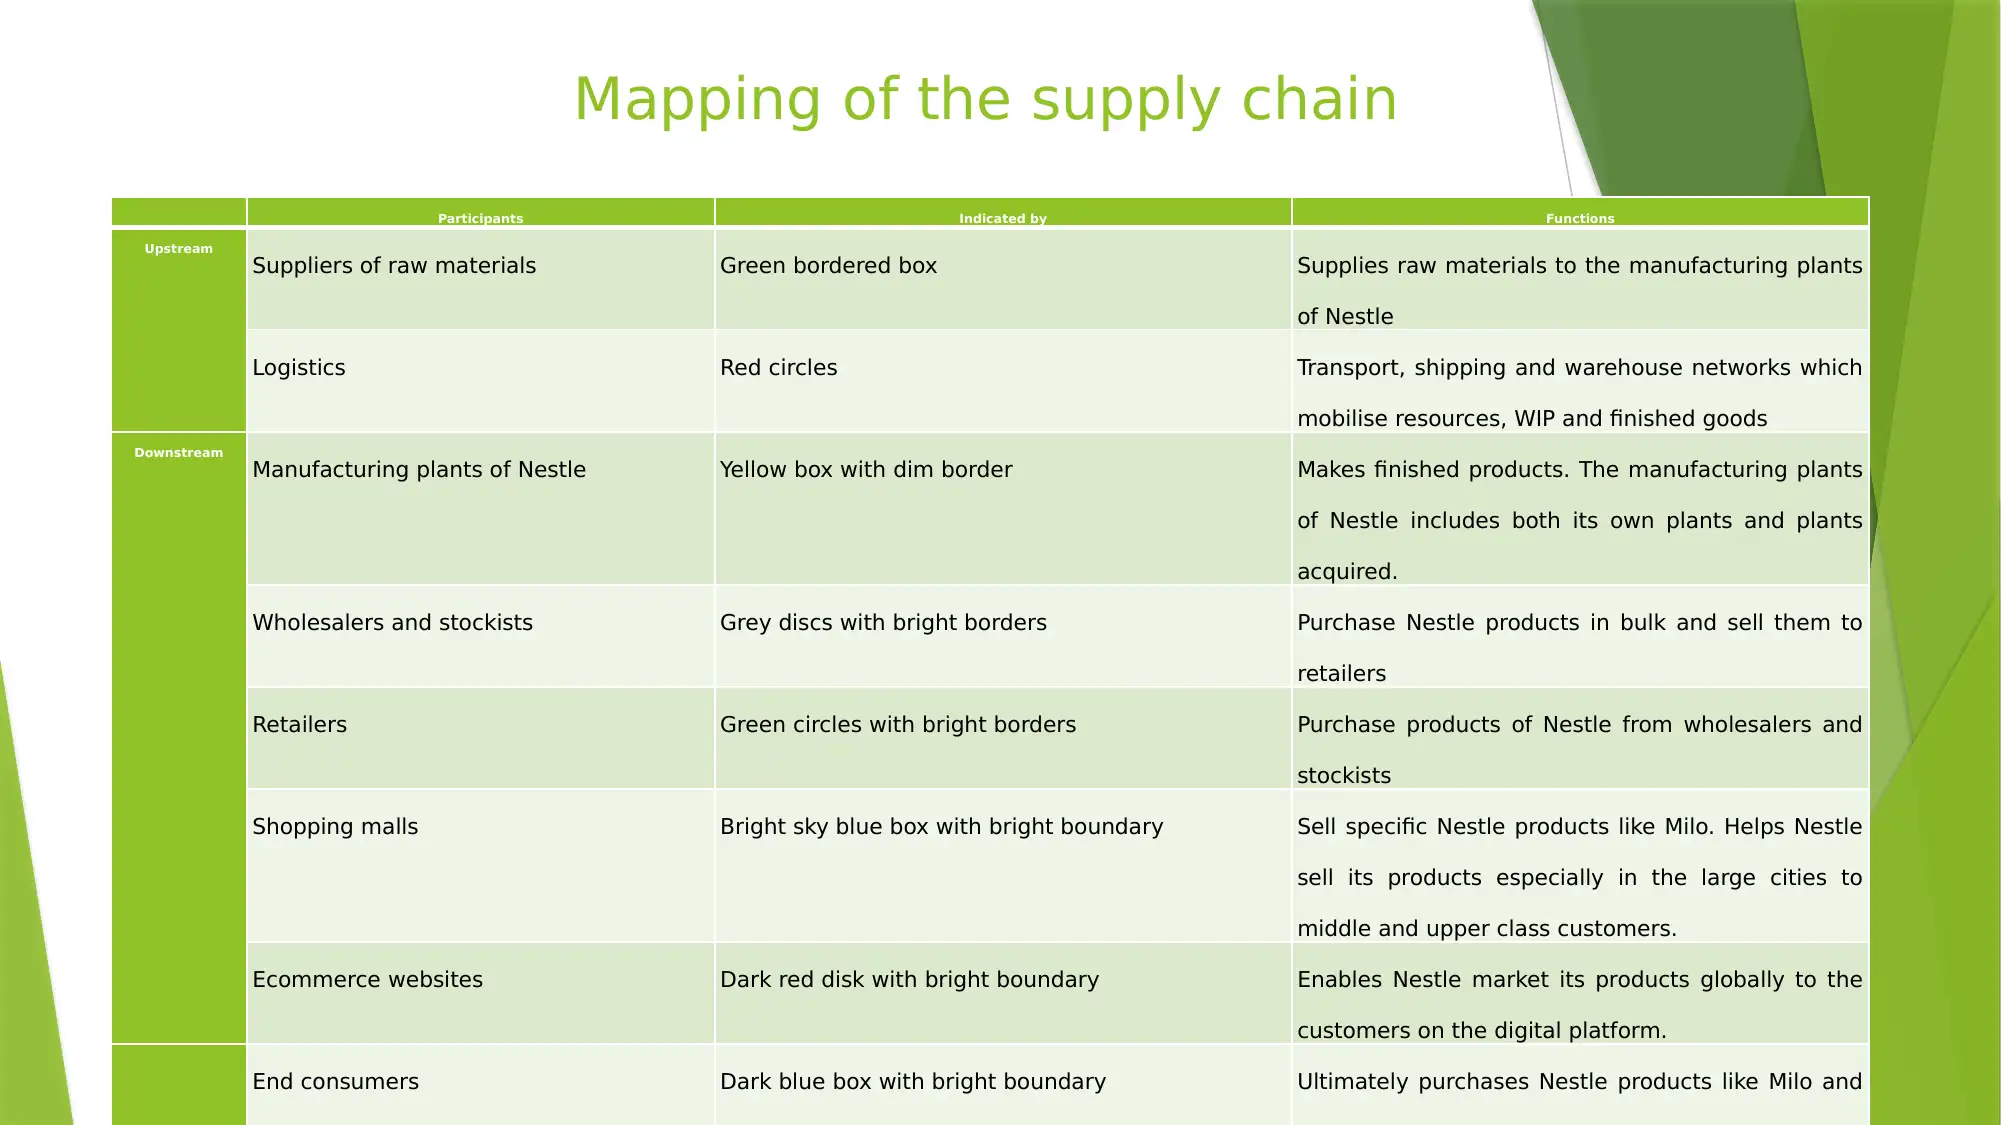
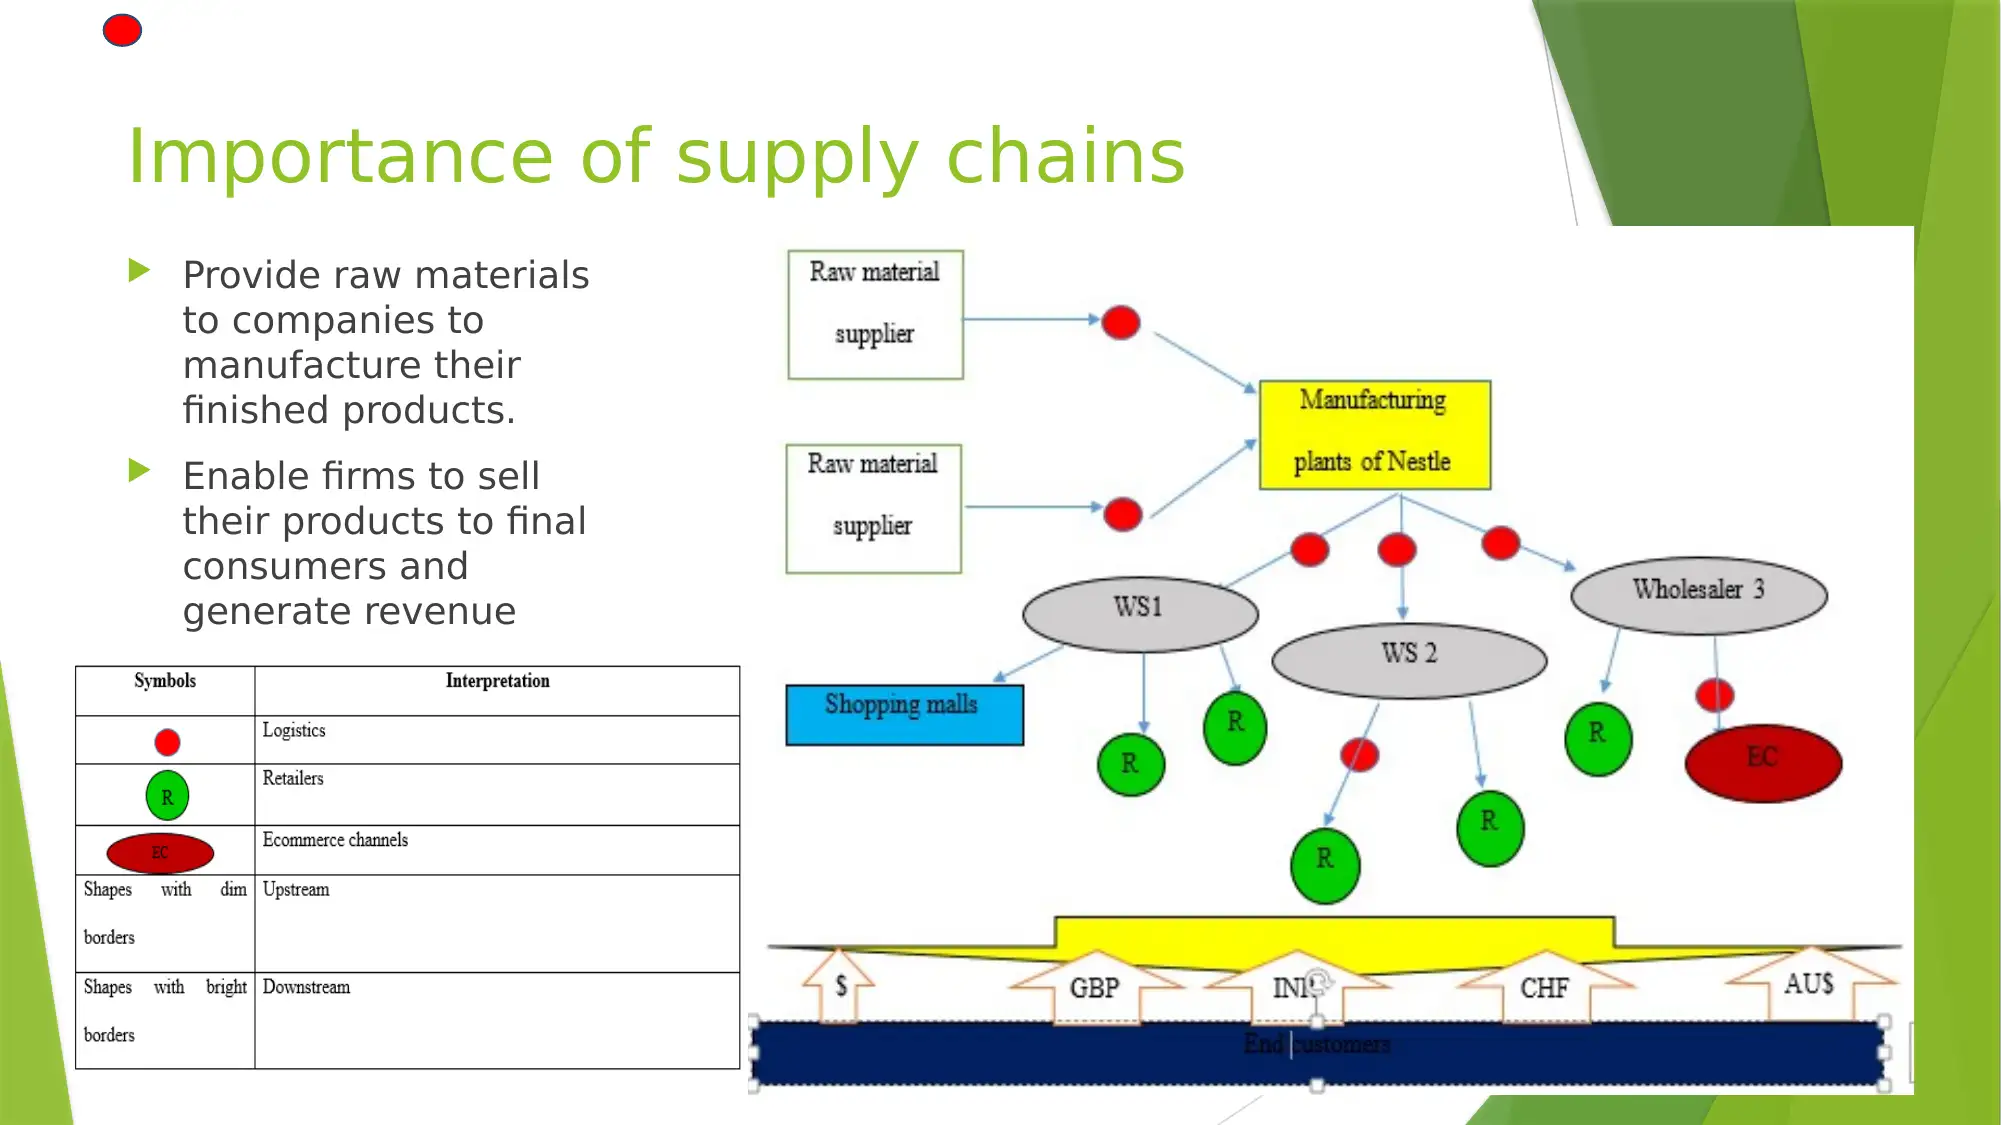
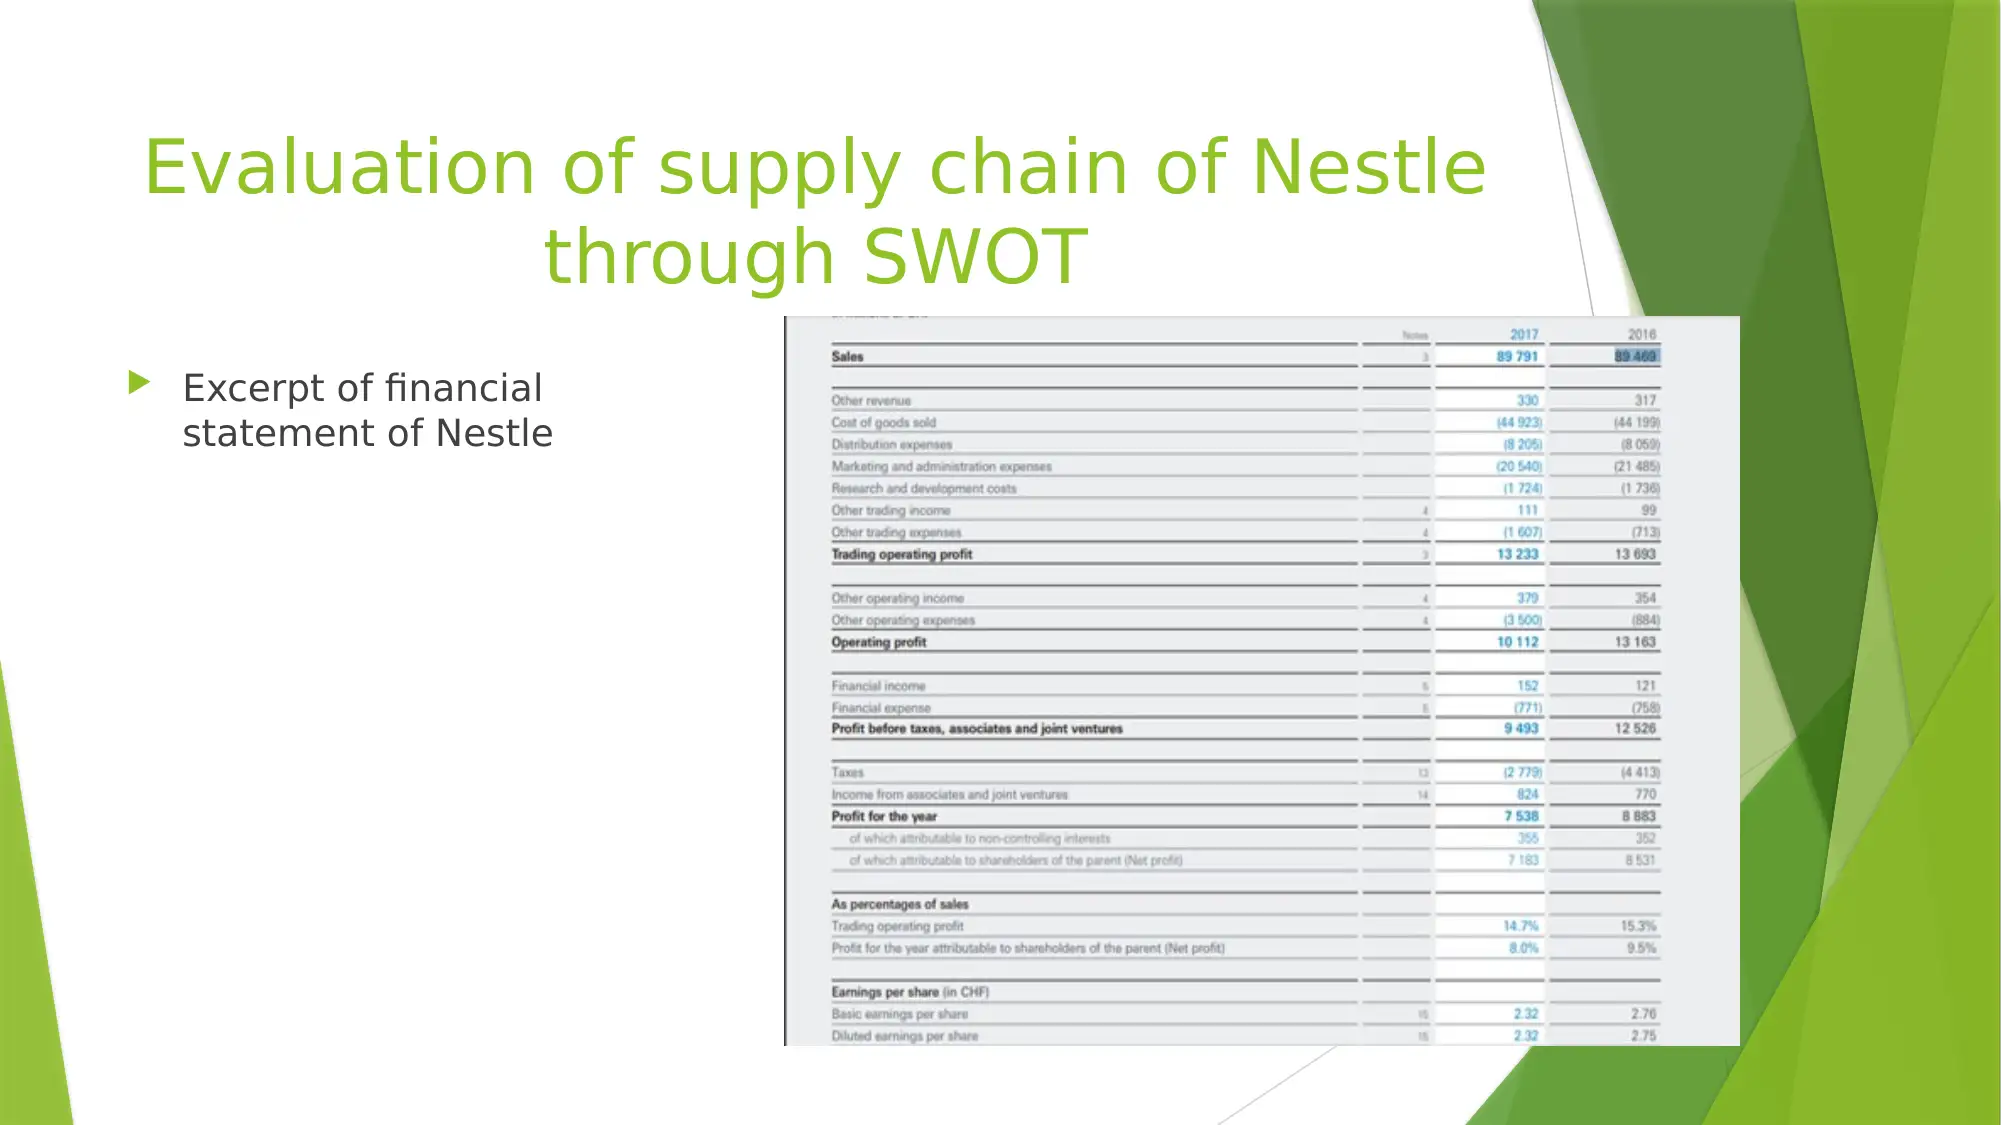
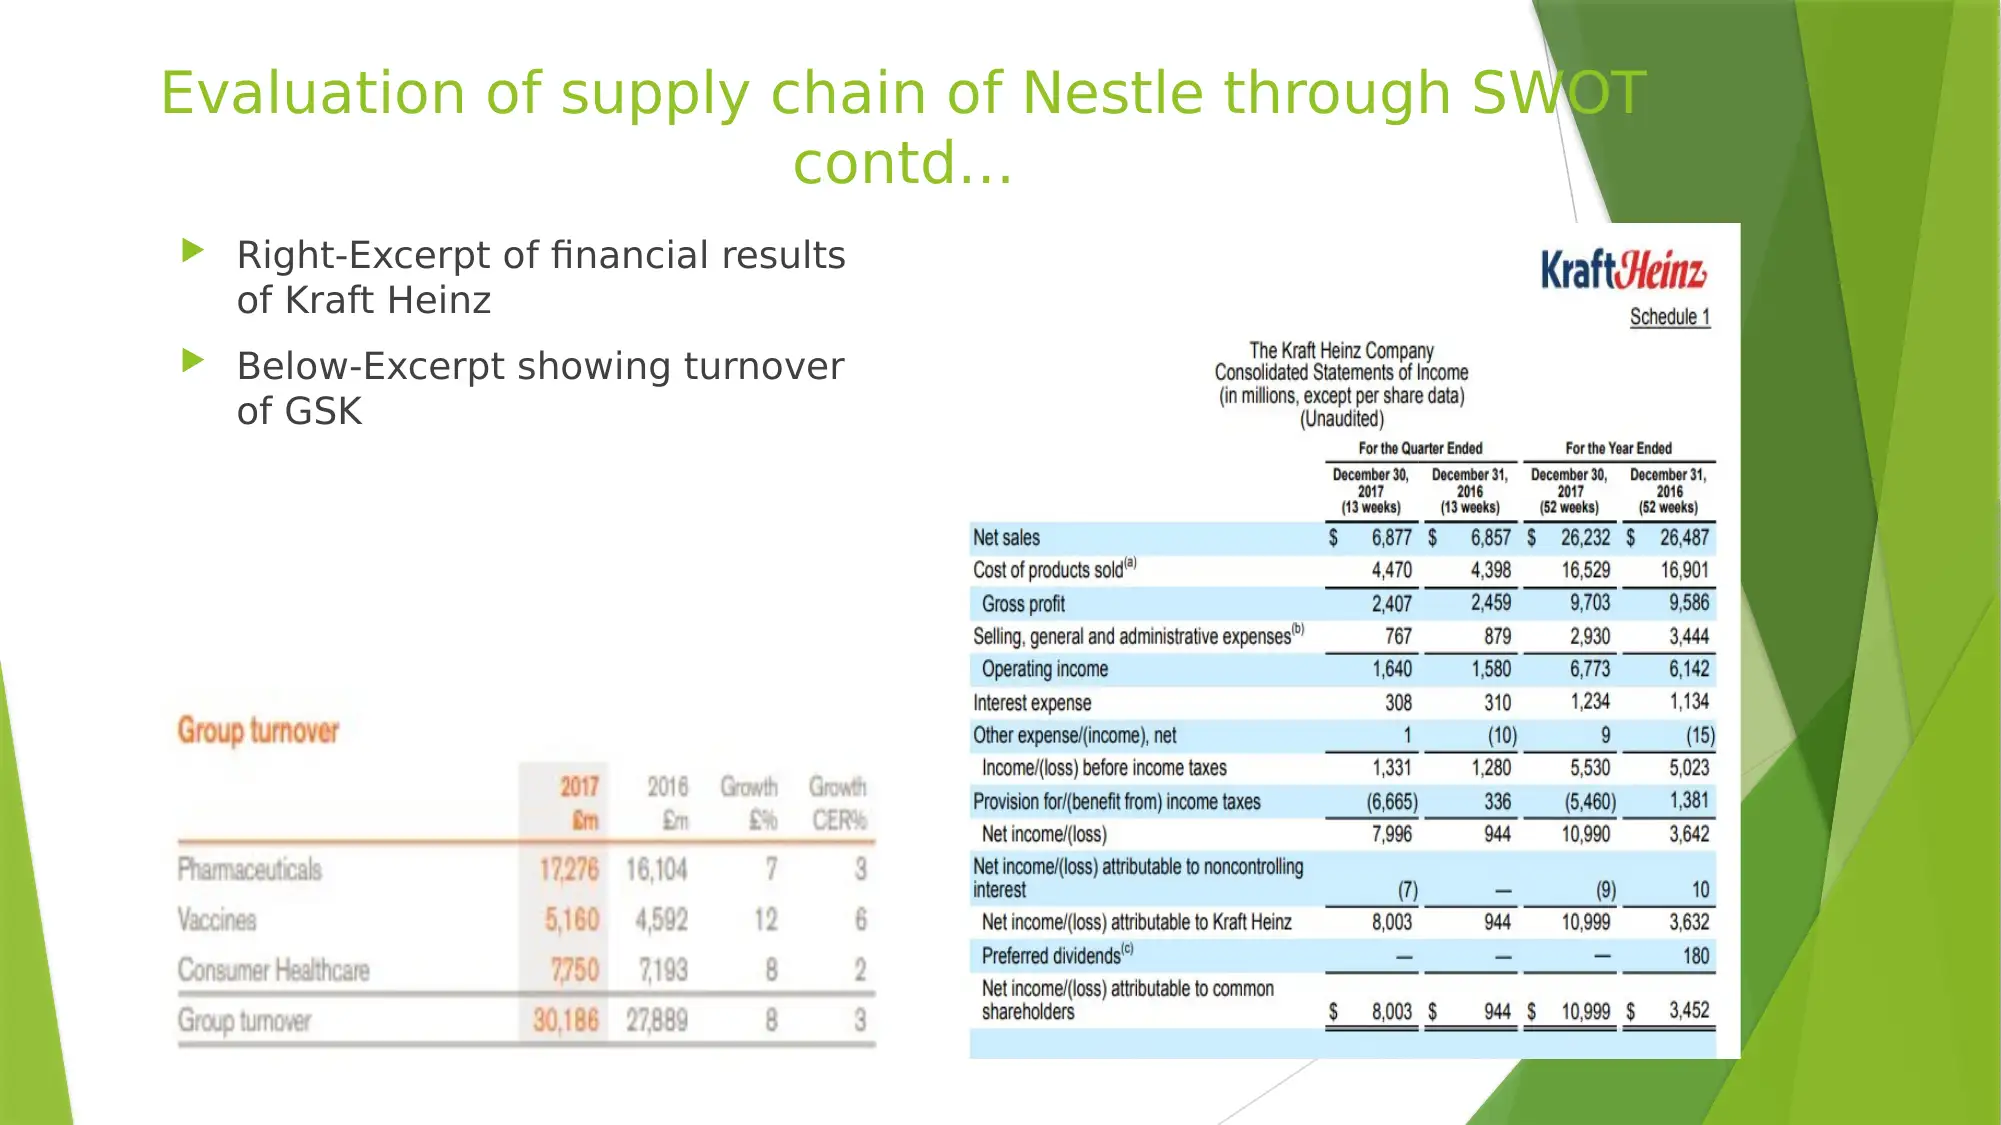
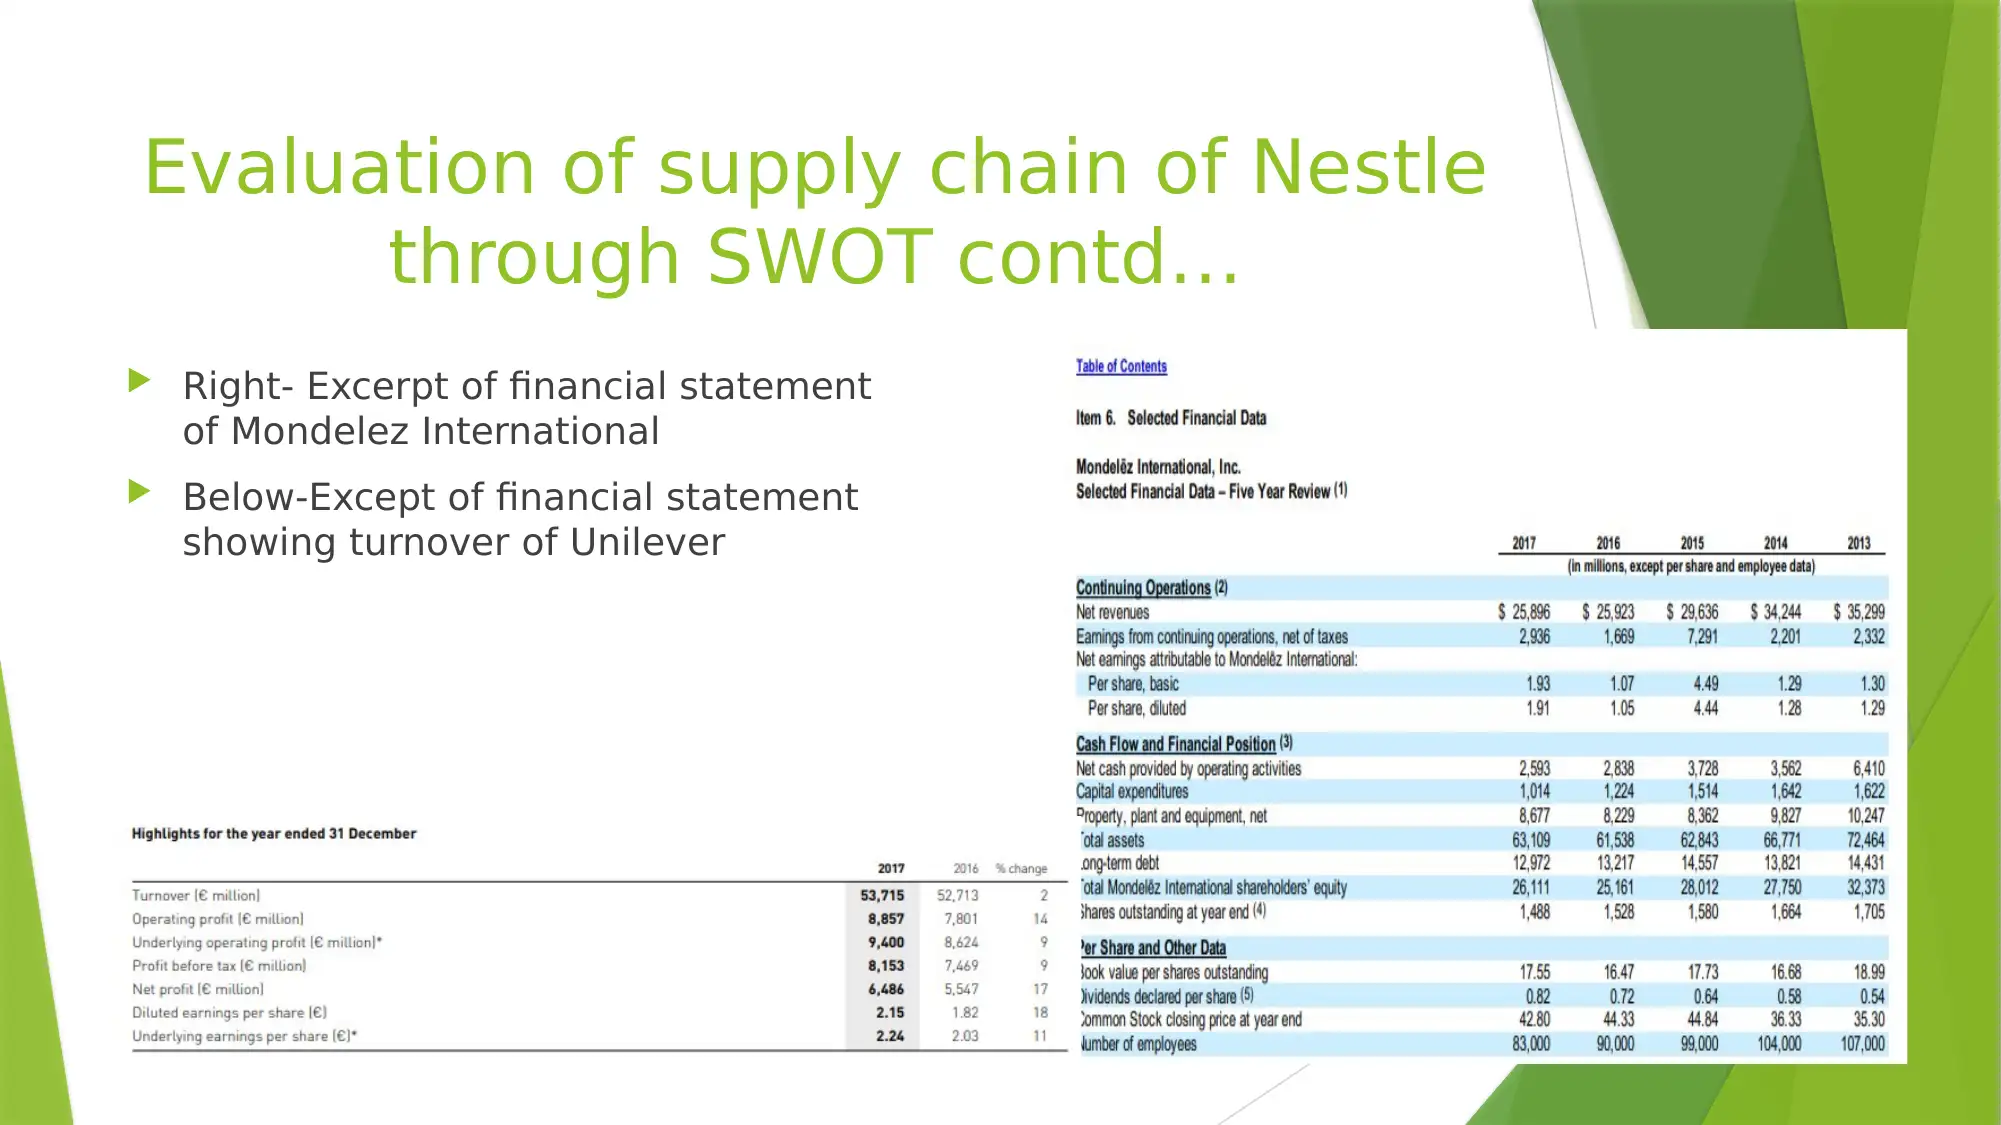
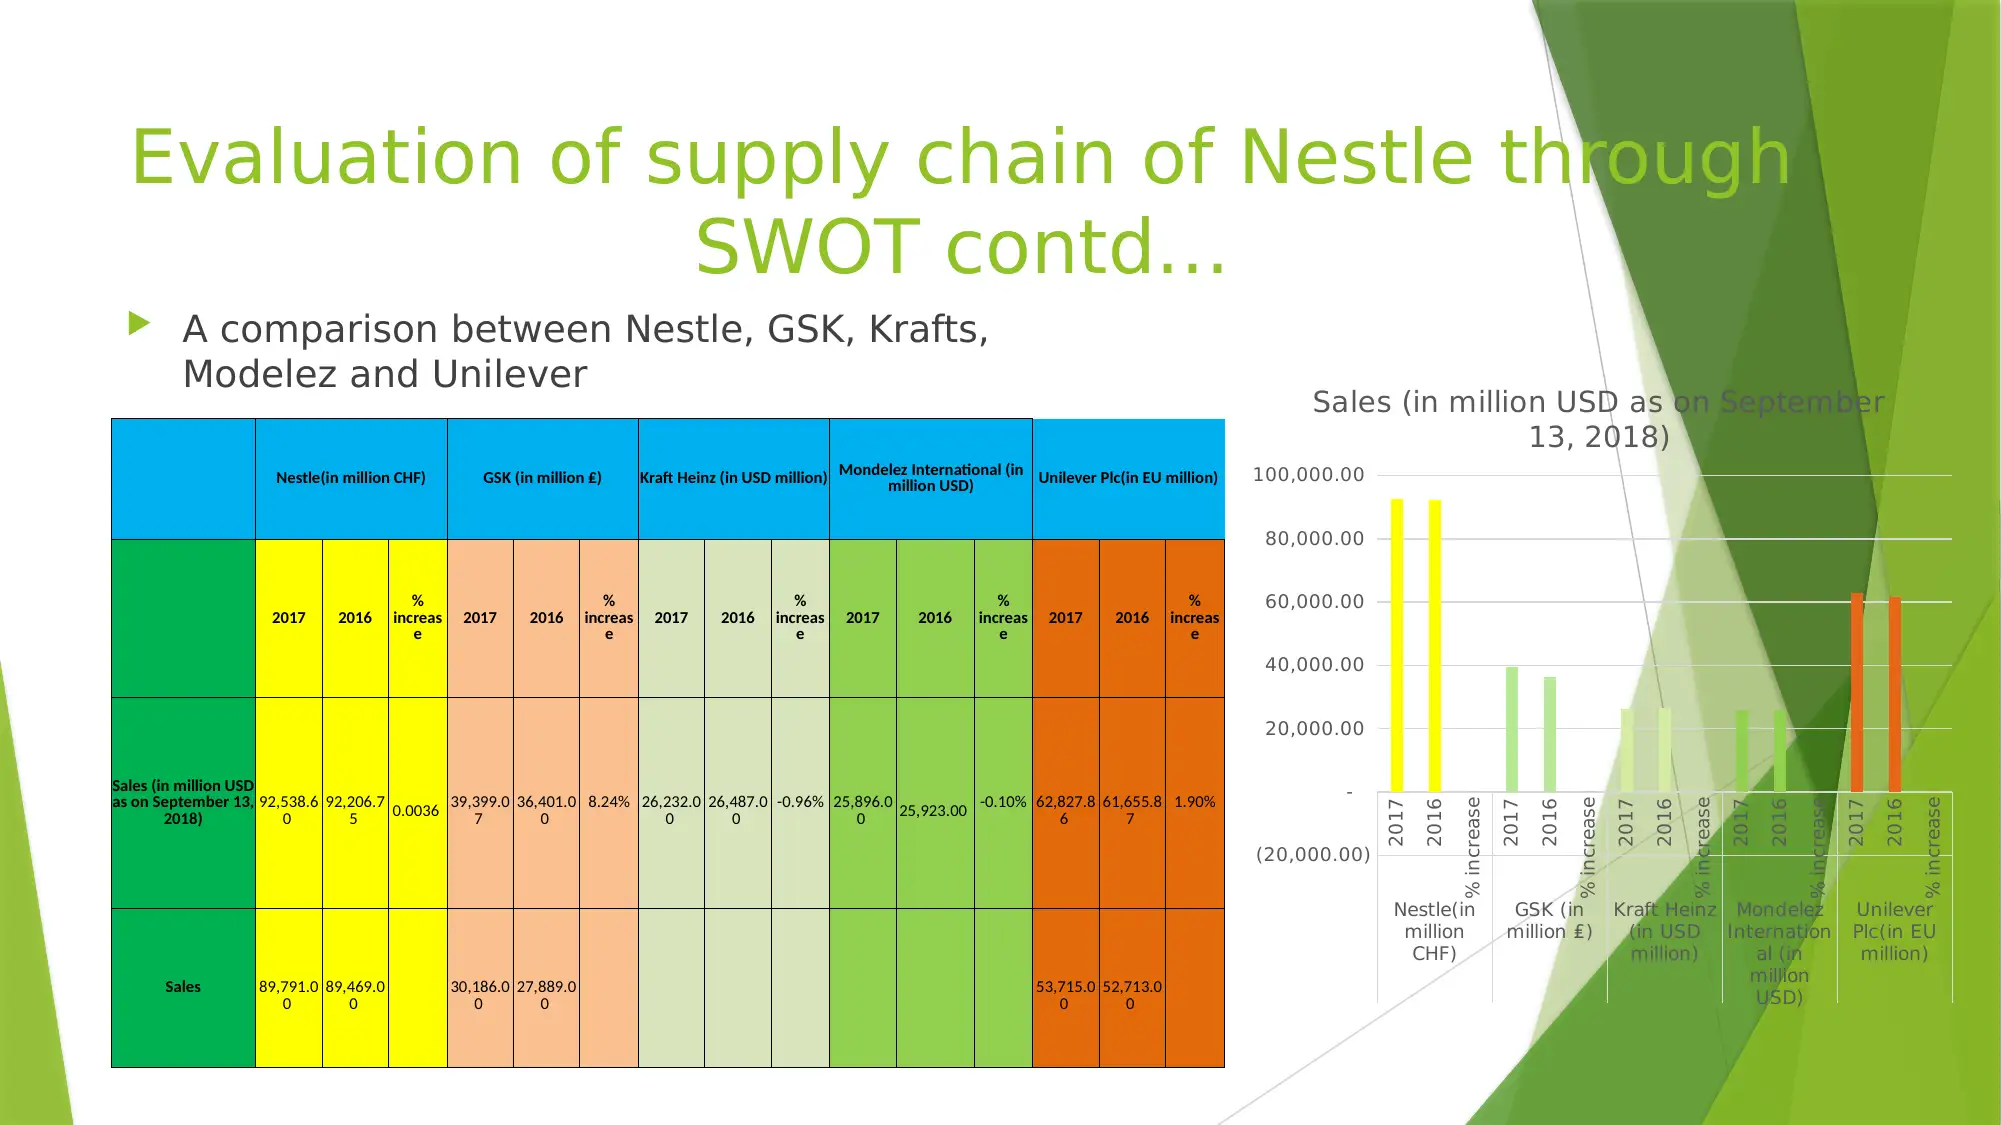
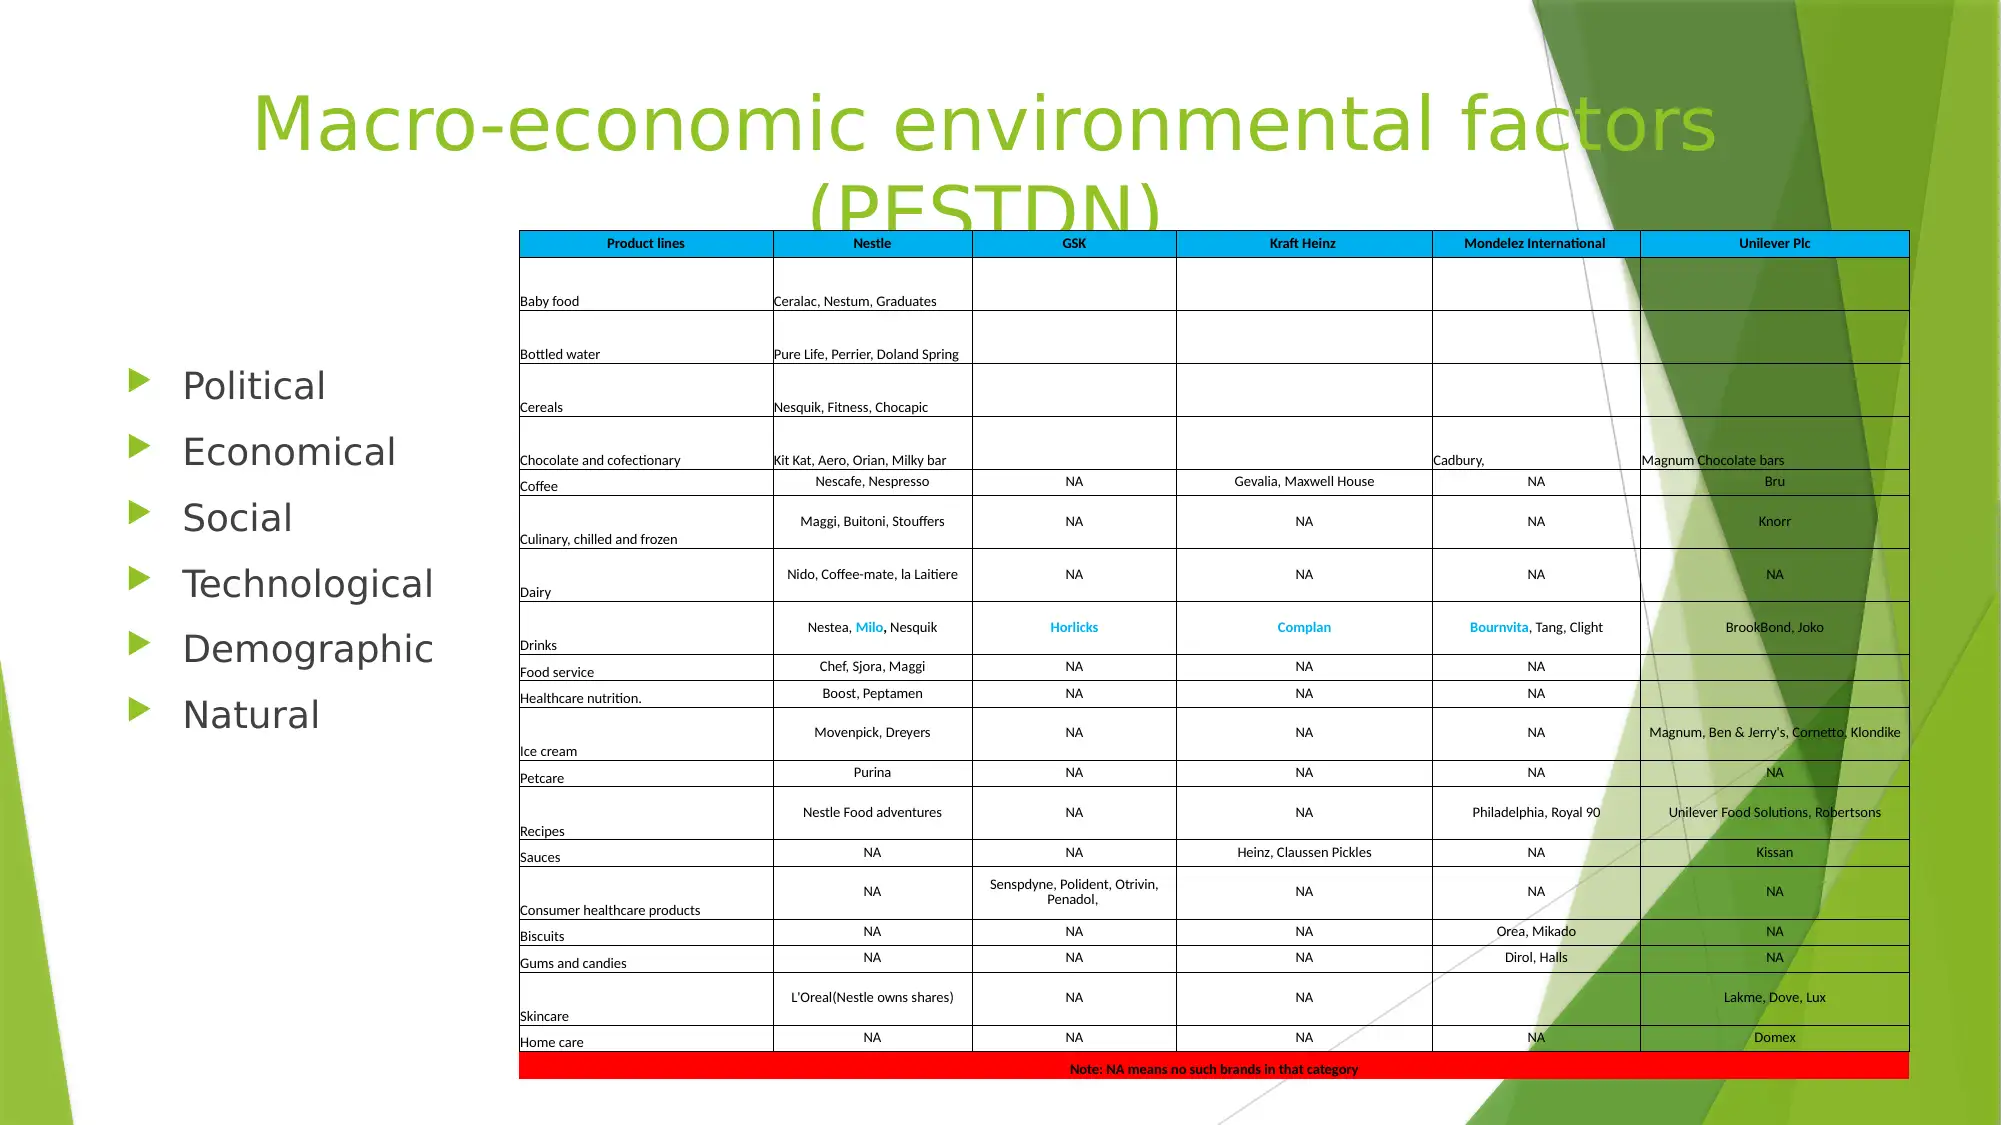
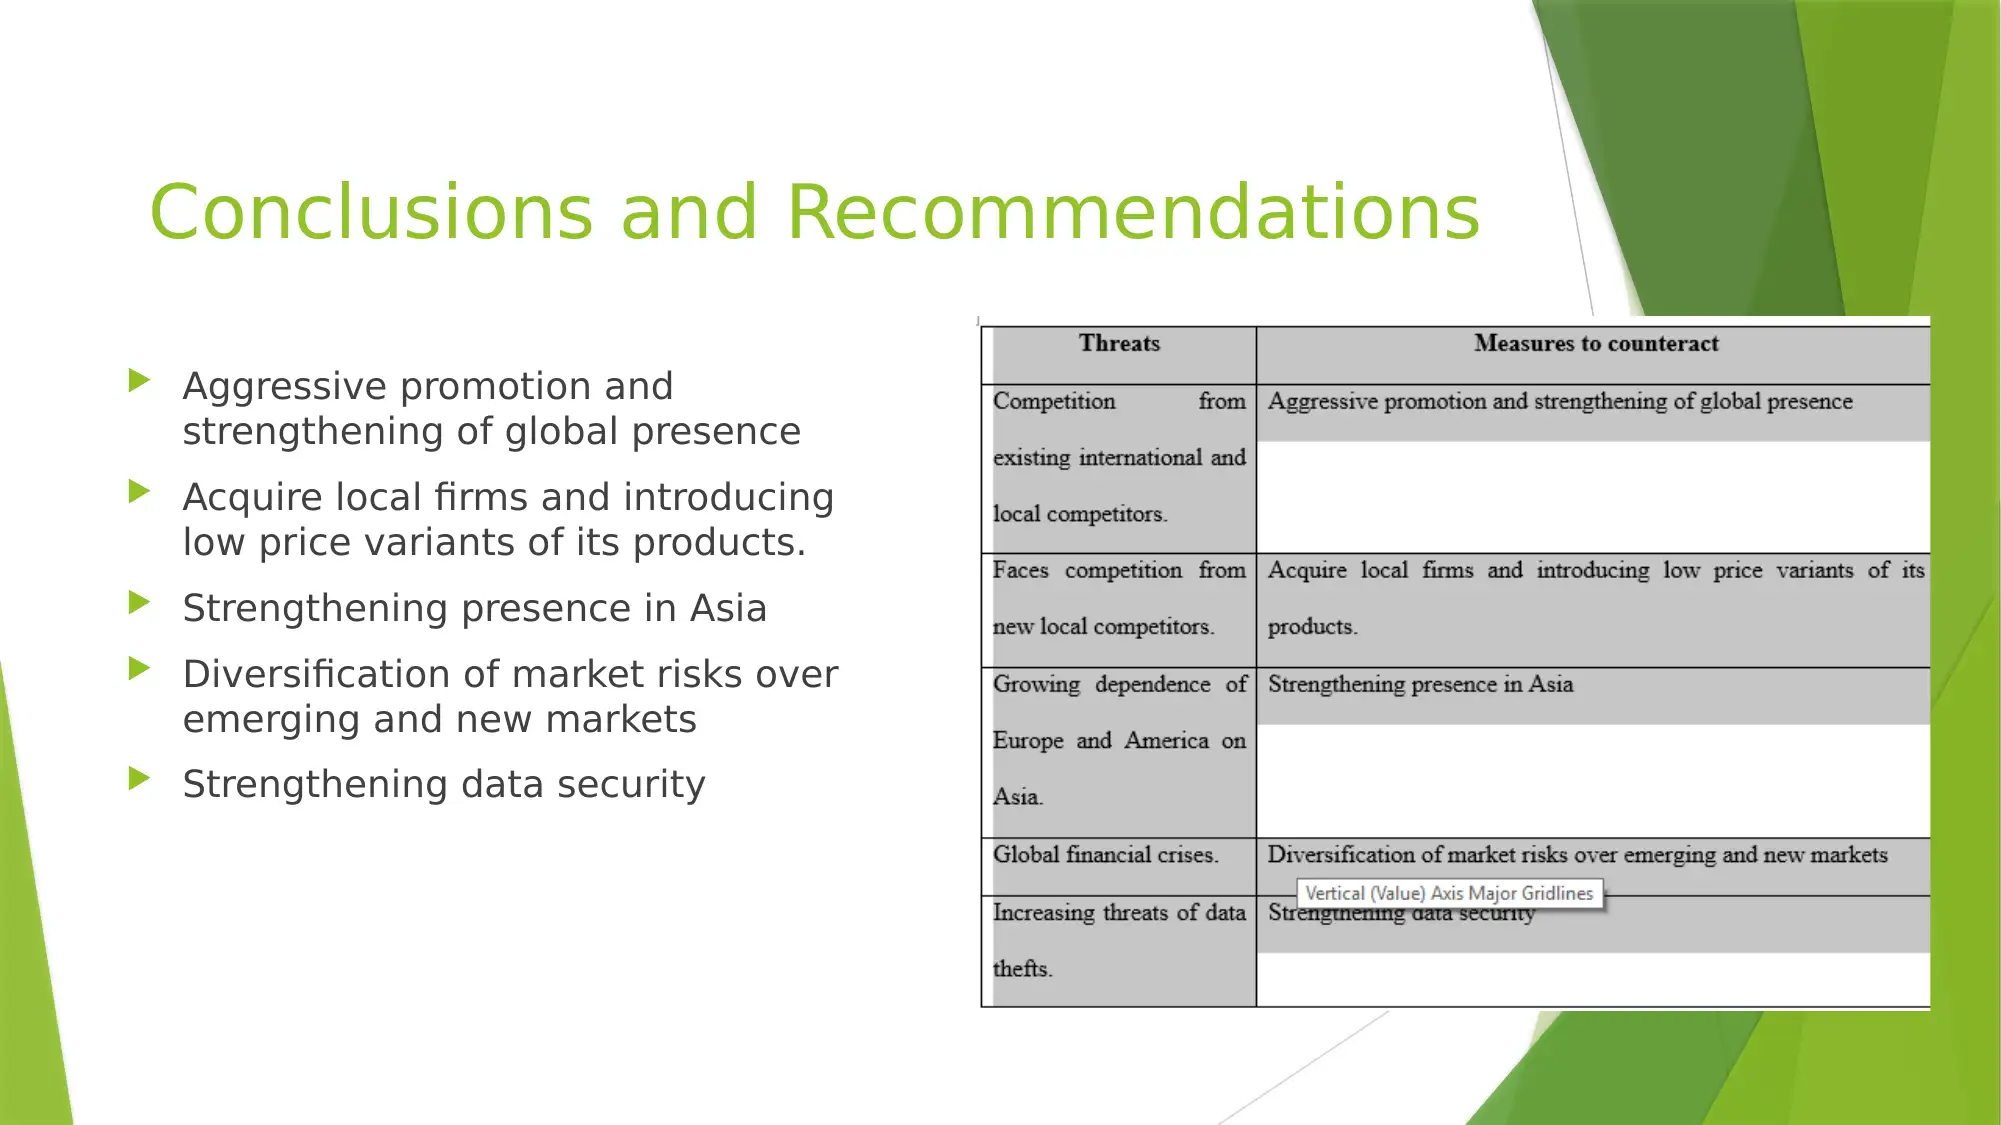
This report provides a comprehensive analysis of the supply chain management of Nestle Milo, mapping its various participants from upstream suppliers to downstream end consumers. It evaluates the supply chain's strengths, weaknesses, opportunities, and threats (SWOT) and considers macro-environmental factors (PESTDN) affecting it. The analysis includes a comparison with other major players in the food industry, such as GSK, Kraft Heinz, Mondelez, and Unilever. The report concludes with recommendations for Nestle to strengthen its global presence, diversify market risks, and enhance data security. References to various sources and financial statements are included to support the analysis, offering insights into the strategic considerations for supply chains in the food sector.
Contribute Materials
Your contribution can guide someone’s learning journey. Share your
documents today.

SUPPLY CHAIN
MANAGEMENT OF
NESTLE MILO
MANAGEMENT OF
NESTLE MILO
Secure Best Marks with AI Grader
Need help grading? Try our AI Grader for instant feedback on your assignments.

Mapping of the supply chain
Participants Indicated by Functions
Upstream
Suppliers of raw materials Green bordered box Supplies raw materials to the manufacturing plants
of Nestle
Logistics Red circles Transport, shipping and warehouse networks which
mobilise resources, WIP and finished goods
Downstream
Manufacturing plants of Nestle Yellow box with dim border Makes finished products. The manufacturing plants
of Nestle includes both its own plants and plants
acquired.
Wholesalers and stockists Grey discs with bright borders Purchase Nestle products in bulk and sell them to
retailers
Retailers Green circles with bright borders Purchase products of Nestle from wholesalers and
stockists
Shopping malls Bright sky blue box with bright boundary Sell specific Nestle products like Milo. Helps Nestle
sell its products especially in the large cities to
middle and upper class customers.
Ecommerce websites Dark red disk with bright boundary Enables Nestle market its products globally to the
customers on the digital platform.
End consumers Dark blue box with bright boundary Ultimately purchases Nestle products like Milo and

Importance of supply chains
Provide raw materials
to companies to
manufacture their
finished products.
Enable firms to sell
their products to final
consumers and
generate revenue
Provide raw materials
to companies to
manufacture their
finished products.
Enable firms to sell
their products to final
consumers and
generate revenue

Evaluation of supply chain of Nestle
through SWOT
Excerpt of financial
statement of Nestle
through SWOT
Excerpt of financial
statement of Nestle
Secure Best Marks with AI Grader
Need help grading? Try our AI Grader for instant feedback on your assignments.

Evaluation of supply chain of Nestle through SWOT
contd…
Right-Excerpt of financial results
of Kraft Heinz
Below-Excerpt showing turnover
of GSK
contd…
Right-Excerpt of financial results
of Kraft Heinz
Below-Excerpt showing turnover
of GSK

Evaluation of supply chain of Nestle
through SWOT contd…
Right- Excerpt of financial statement
of Mondelez International
Below-Except of financial statement
showing turnover of Unilever
through SWOT contd…
Right- Excerpt of financial statement
of Mondelez International
Below-Except of financial statement
showing turnover of Unilever

Evaluation of supply chain of Nestle through
SWOT contd…
A comparison between Nestle, GSK, Krafts,
Modelez and Unilever
2017
2016
% increase
2017
2016
% increase
2017
2016
% increase
2017
2016
% increase
2017
2016
% increase
Nestle(in
million
CHF)
GSK (in
million ₤)
Kraft Heinz
(in USD
million)
Mondelez
Internation
al (in
million
USD)
Unilever
Plc(in EU
million)
(20,000.00)
-
20,000.00
40,000.00
60,000.00
80,000.00
100,000.00
Sales (in million USD as on September
13, 2018)
Nestle(in million CHF) GSK (in million ₤) Kraft Heinz (in USD million) Mondelez International (in
million USD) Unilever Plc(in EU million)
2017 2016
%
increas
e
2017 2016
%
increas
e
2017 2016
%
increas
e
2017 2016
%
increas
e
2017 2016
%
increas
e
Sales (in million USD
as on September 13,
2018) 92,538.6
0 92,206.7
5 0.0036 39,399.0
7 36,401.0
0 8.24% 26,232.0
0 26,487.0
0 -0.96% 25,896.0
0 25,923.00 -0.10% 62,827.8
6 61,655.8
7 1.90%
Sales 89,791.0
0
89,469.0
0
30,186.0
0
27,889.0
0
53,715.0
0
52,713.0
0
Paraphrase This Document
Need a fresh take? Get an instant paraphrase of this document with our AI Paraphraser

Macro-economic environmental factors
(PESTDN)
Political
Economical
Social
Technological
Demographic
Natural
Product lines Nestle GSK Kraft Heinz Mondelez International Unilever Plc
Baby food Ceralac, Nestum, Graduates
Bottled water Pure Life, Perrier, Doland Spring
Cereals Nesquik, Fitness, Chocapic
Chocolate and cofectionary Kit Kat, Aero, Orian, Milky bar Cadbury, Magnum Chocolate bars
Coffee Nescafe, Nespresso NA Gevalia, Maxwell House NA Bru
Culinary, chilled and frozen
Maggi, Buitoni, Stouffers NA NA NA Knorr
Dairy
Nido, Coffee-mate, la Laitiere NA NA NA NA
Drinks
Nestea, Milo, Nesquik Horlicks Complan Bournvita, Tang, Clight BrookBond, Joko
Food service Chef, Sjora, Maggi NA NA NA
Healthcare nutrition. Boost, Peptamen NA NA NA
Ice cream
Movenpick, Dreyers NA NA NA Magnum, Ben & Jerry's, Cornetto, Klondike
Petcare Purina NA NA NA NA
Recipes
Nestle Food adventures NA NA Philadelphia, Royal 90 Unilever Food Solutions, Robertsons
Sauces NA NA Heinz, Claussen Pickles NA Kissan
Consumer healthcare products
NA Senspdyne, Polident, Otrivin,
Penadol, NA NA NA
Biscuits NA NA NA Orea, Mikado NA
Gums and candies NA NA NA Dirol, Halls NA
Skincare
L'Oreal(Nestle owns shares) NA NA Lakme, Dove, Lux
Home care NA NA NA NA Domex
Note: NA means no such brands in that category

Conclusions and Recommendations
Aggressive promotion and
strengthening of global presence
Acquire local firms and introducing
low price variants of its products.
Strengthening presence in Asia
Diversification of market risks over
emerging and new markets
Strengthening data security
Aggressive promotion and
strengthening of global presence
Acquire local firms and introducing
low price variants of its products.
Strengthening presence in Asia
Diversification of market risks over
emerging and new markets
Strengthening data security

References
Dubey, R., Gunasekaran, A., Papadopoulos, T., Childe, S.J., Shibin, K.T. and Wamba, S.F., 2017. Sustainable
supply chain management: framework and further research directions. Journal of Cleaner Production, 142,
pp.1119-1130.
Gsk.com. 2018. gsk.com. [online] Available at: https://www.gsk.com/media/4751/annual-report.pdf [Accessed
13 Sep. 2018].
Hazen, B.T., Boone, C.A., Ezell, J.D. and Jones-Farmer, L.A., 2014. Data quality for data science, predictive
analytics, and big data in supply chain management: An introduction to the problem and suggestions for
research and applications. International Journal of Production Economics, 154, pp.72-80.
Ir.kraftheinzcompany.com. 2018. ir.kraftheinzcompany.com. [online] Available at:
http://ir.kraftheinzcompany.com/static-files/a8517441-f44f-467f-90b1-ee8469ad8189 [Accessed 13 Sep. 2018].
Ir.mondelezinternational.com. 2018. ir.mondelezinternational.com. [online] Available at:
http://ir.mondelezinternational.com/system/files-api?file=migration/secfilings/0001193125-18-037332/
pdf.pdf&file_alias=36196&CIK=1103982&filingID=1193125-18-37332 [Accessed 13 Sep. 2018].
Jacobs, F.R., Chase, R.B. and Lummus, R.R., 2014. Operations and supply chain management (pp. 533-535).
New York, NY: McGraw-Hill/Irwin.
Nestle.com. 2018. nestle.com. [online] Available at:
https://www.nestle.com/asset-library/documents/library/documents/financial_statements/2017-financial-
statements-en.pdf [Accessed 13 Sep. 2018].javascript:void(0);
Unilever.com. 2018. unilever.com. [online] Available at: https://www.unilever.com/Images/unilever-annual-
report-and-accounts-2017_tcm244-516456_en.pdf [Accessed 14 Sep. 2018].
Secure Best Marks with AI Grader
Need help grading? Try our AI Grader for instant feedback on your assignments.

THANK YOU
1 out of 11

Your All-in-One AI-Powered Toolkit for Academic Success.
+13062052269
info@desklib.com
Available 24*7 on WhatsApp / Email
Unlock your academic potential
© 2024 | Zucol Services PVT LTD | All rights reserved.