MKT203 Exam 2: Analysis of Market Segmentation and Pricing Strategies
VerifiedAdded on 2023/05/28
|12
|3032
|421
Homework Assignment
AI Summary
This document presents a comprehensive solution to the MKT203 Exam 2, addressing key marketing concepts. It begins with a market segmentation analysis, identifying and characterizing three segments ("I like it", "Nice and easy", and "Pressed for time") for a new fast-food restaurant and justifying the selection of a target segment based on profitability and brand loyalty. The solution then evaluates the quality of Walmart's online app using the eQUAL framework, assessing site quality and retailer quality across various dimensions. The paper further explores pricing strategies, contrasting price skimming and penetration pricing and recommending penetration pricing for a new fast-food restaurant using fake meat. A statistical analysis of acceptable prices for a combo meal is presented, along with a perceptual map illustrating brand positioning. The document also analyzes Apple's iPhone revenue trends, recommending an offensive marketing strategy and emphasizing brand building through customer service. The solution incorporates tables, figures, and references to support its analysis and recommendations, covering topics from market segmentation to branding and marketing metrics.
Running head: MKT203EXAM 2
MKT203 Exam 2
Name of the Student
Name of the University
MKT203 Exam 2
Name of the Student
Name of the University
Paraphrase This Document
Need a fresh take? Get an instant paraphrase of this document with our AI Paraphraser
1MKT203EXAM 2
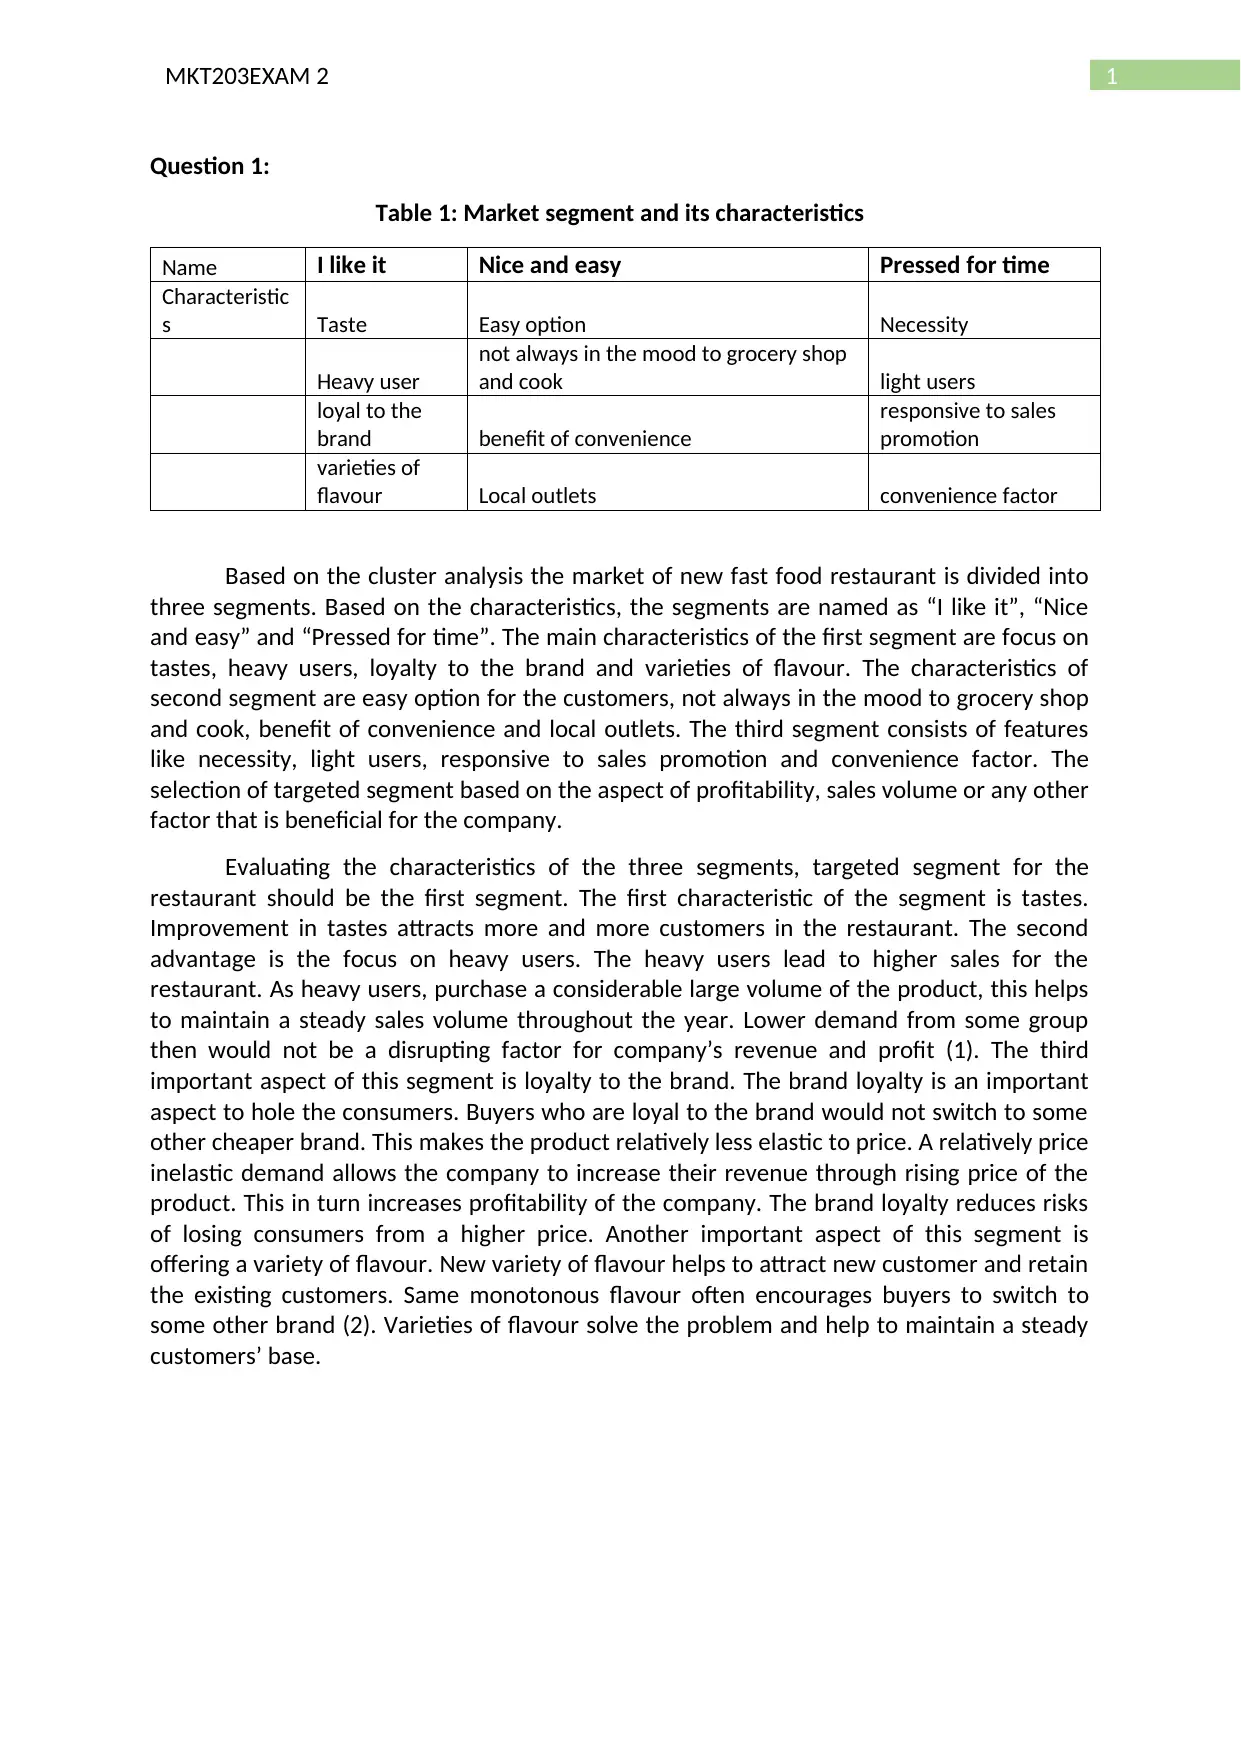
Question 1:
Table 1: Market segment and its characteristics
Name I like it Nice and easy Pressed for time
Characteristic
s Taste Easy option Necessity
Heavy user
not always in the mood to grocery shop
and cook light users
loyal to the
brand benefit of convenience
responsive to sales
promotion
varieties of
flavour Local outlets convenience factor
Based on the cluster analysis the market of new fast food restaurant is divided into
three segments. Based on the characteristics, the segments are named as “I like it”, “Nice
and easy” and “Pressed for time”. The main characteristics of the first segment are focus on
tastes, heavy users, loyalty to the brand and varieties of flavour. The characteristics of
second segment are easy option for the customers, not always in the mood to grocery shop
and cook, benefit of convenience and local outlets. The third segment consists of features
like necessity, light users, responsive to sales promotion and convenience factor. The
selection of targeted segment based on the aspect of profitability, sales volume or any other
factor that is beneficial for the company.
Evaluating the characteristics of the three segments, targeted segment for the
restaurant should be the first segment. The first characteristic of the segment is tastes.
Improvement in tastes attracts more and more customers in the restaurant. The second
advantage is the focus on heavy users. The heavy users lead to higher sales for the
restaurant. As heavy users, purchase a considerable large volume of the product, this helps
to maintain a steady sales volume throughout the year. Lower demand from some group
then would not be a disrupting factor for company’s revenue and profit (1). The third
important aspect of this segment is loyalty to the brand. The brand loyalty is an important
aspect to hole the consumers. Buyers who are loyal to the brand would not switch to some
other cheaper brand. This makes the product relatively less elastic to price. A relatively price
inelastic demand allows the company to increase their revenue through rising price of the
product. This in turn increases profitability of the company. The brand loyalty reduces risks
of losing consumers from a higher price. Another important aspect of this segment is
offering a variety of flavour. New variety of flavour helps to attract new customer and retain
the existing customers. Same monotonous flavour often encourages buyers to switch to
some other brand (2). Varieties of flavour solve the problem and help to maintain a steady
customers’ base.
2MKT203EXAM 2
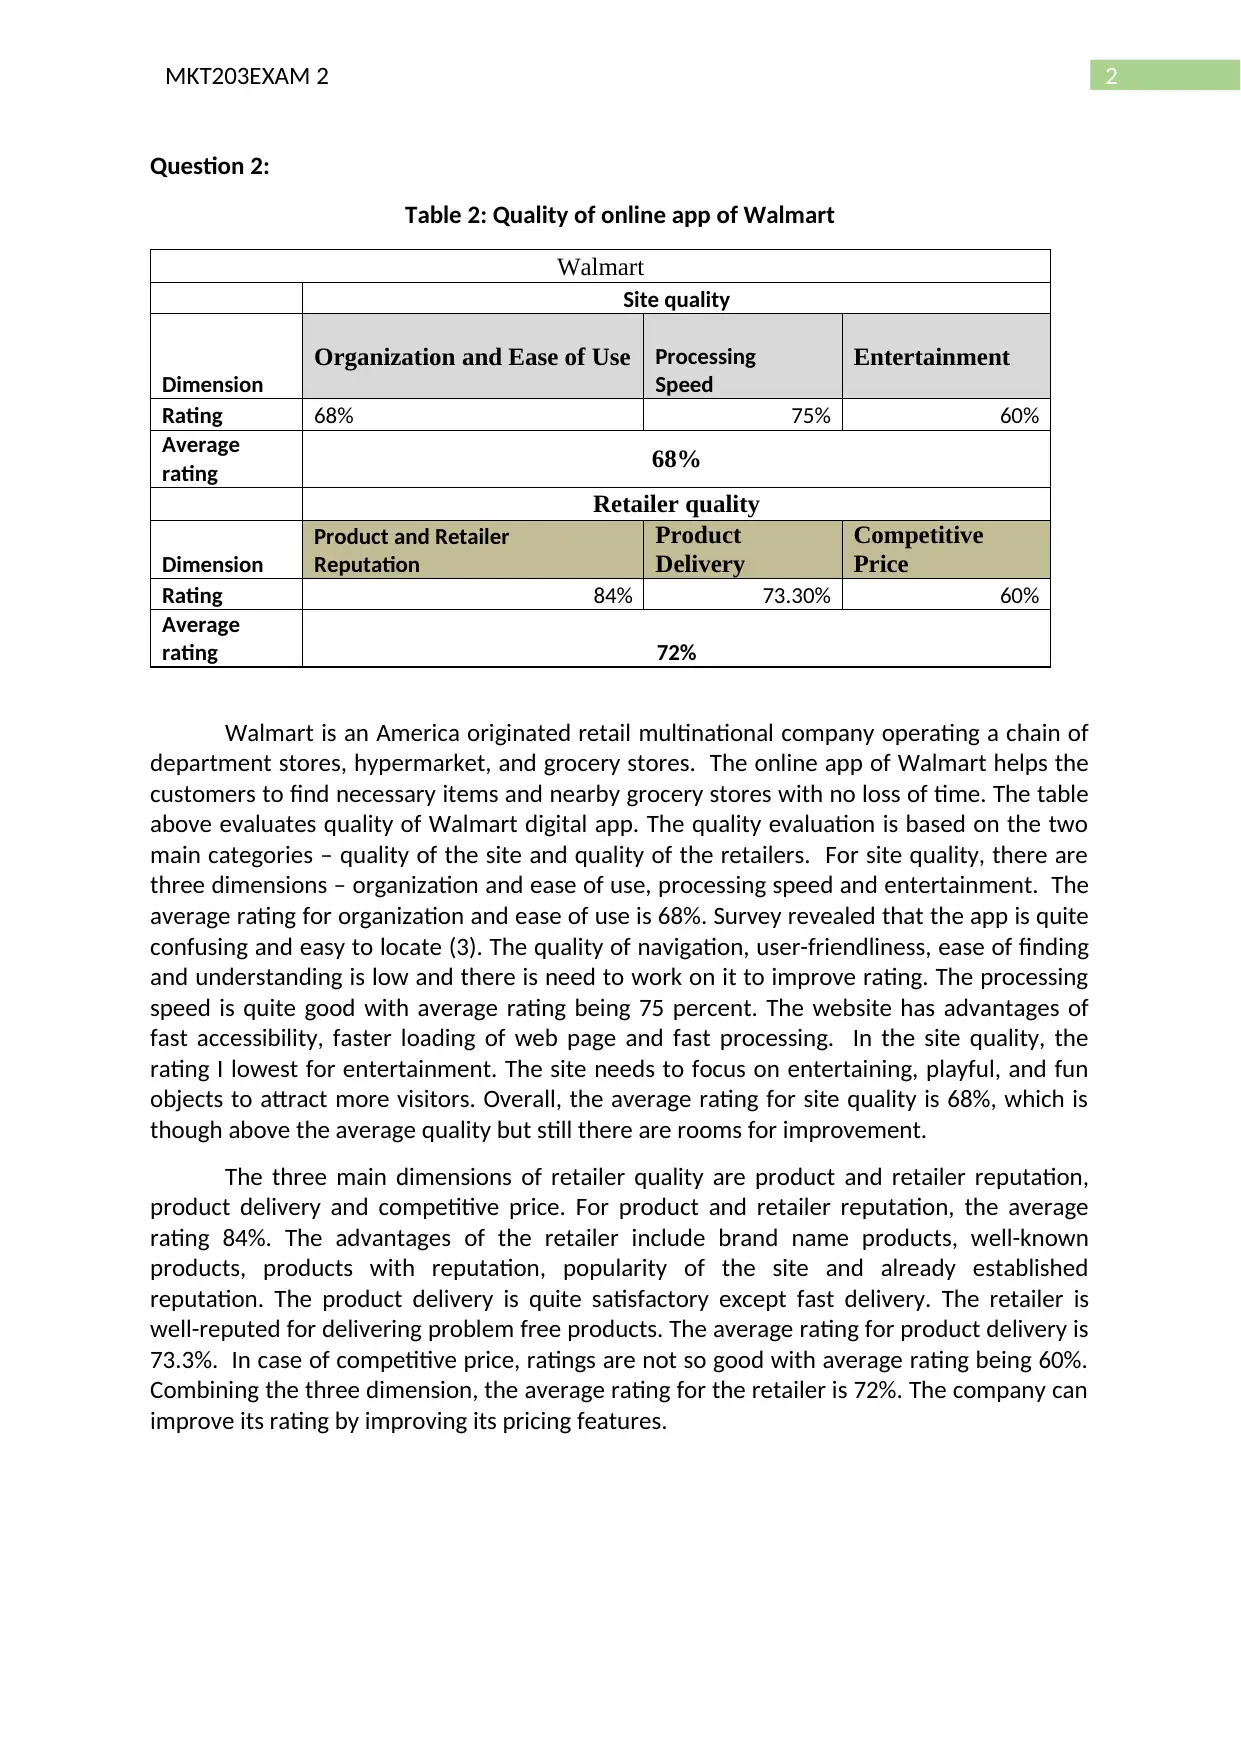
Question 2:
Table 2: Quality of online app of Walmart
Walmart
Site quality
Dimension
Organization and Ease of Use Processing
Speed
Entertainment
Rating 68% 75% 60%
Average
rating 68%
Retailer quality
Dimension
Product and Retailer
Reputation
Product
Delivery
Competitive
Price
Rating 84% 73.30% 60%
Average
rating 72%
Walmart is an America originated retail multinational company operating a chain of
department stores, hypermarket, and grocery stores. The online app of Walmart helps the
customers to find necessary items and nearby grocery stores with no loss of time. The table
above evaluates quality of Walmart digital app. The quality evaluation is based on the two
main categories – quality of the site and quality of the retailers. For site quality, there are
three dimensions – organization and ease of use, processing speed and entertainment. The
average rating for organization and ease of use is 68%. Survey revealed that the app is quite
confusing and easy to locate (3). The quality of navigation, user-friendliness, ease of finding
and understanding is low and there is need to work on it to improve rating. The processing
speed is quite good with average rating being 75 percent. The website has advantages of
fast accessibility, faster loading of web page and fast processing. In the site quality, the
rating I lowest for entertainment. The site needs to focus on entertaining, playful, and fun
objects to attract more visitors. Overall, the average rating for site quality is 68%, which is
though above the average quality but still there are rooms for improvement.
The three main dimensions of retailer quality are product and retailer reputation,
product delivery and competitive price. For product and retailer reputation, the average
rating 84%. The advantages of the retailer include brand name products, well-known
products, products with reputation, popularity of the site and already established
reputation. The product delivery is quite satisfactory except fast delivery. The retailer is
well-reputed for delivering problem free products. The average rating for product delivery is
73.3%. In case of competitive price, ratings are not so good with average rating being 60%.
Combining the three dimension, the average rating for the retailer is 72%. The company can
improve its rating by improving its pricing features.
⊘ This is a preview!⊘
Do you want full access?
Subscribe today to unlock all pages.
Trusted by 1+ million students worldwide
3MKT203EXAM 2
Question 3:
Price skimming refers to a pricing strategy where producers initially set a high price
for a particular product or service and then reduces price overtime. It is a temporary form of
price discrimination allowing firms to recover the sunk cost of production (7). The main
objective of price skimming strategy is to capture the consumer surplus in the market. This
allows firms the position of a monopolist. Price skimming strategy is recommended in a
situation satisfying the following characteristics
Firms are price seekers
The concerned product or service is durable
Firms are guided by profit motive
The market information is poor
There is high quality connotation of price
Low degree of competition and low production capacity
Penetration pricing on the other hand is a strategy where firms initially set a low
price in order to achieve a higher market share in domestic and international market. The
strategy is most commonly related with the objectives of increasing market share and
exploits the economies of scale. In contrast to price skimming, consumers here constitute
price aversion. The particular product is non-durable and main purpose in to increase
market share (8). Some other characteristics of penetration strategy include plentiful market
information, high price elasticity of demand, low price of quality connotation, high
competition followed by high production capacity.
If a new fast food restaurant using fake meat rather than real meat option then it
should adapt penetration strategy. Consumers in the fast food market mostly prefer real
meat option. They are hence price averse. Burgers are nondurable product and hence,
penetration rather than skimming is an appropriate strategy. As revealed from the article,
producers in the fast food industry are facing high degree of competition. The new entrant
thus likely to face high competition. Under this circumstance, firm should focus on
increasing their market share instead of raising profit. Besides, the fake meat burgers face a
high price elasticity of demand. Consumers preferences though are changing toward more
protein-based foods, they still prefer real meat more (4). Consumers tend to substitute fake
meat burger with a real meat one in case found to be relatively cheaper. Producers also
enjoy a high production capacity, as fewer resources are needed to produce cultured meat
compared to conventional meat. Following the market condition such as degree of
competition and other characteristics penetration seems to be more appealing strategy in
the market over price skimming strategy.
Paraphrase This Document
Need a fresh take? Get an instant paraphrase of this document with our AI Paraphraser
4MKT203EXAM 2
Question 4:
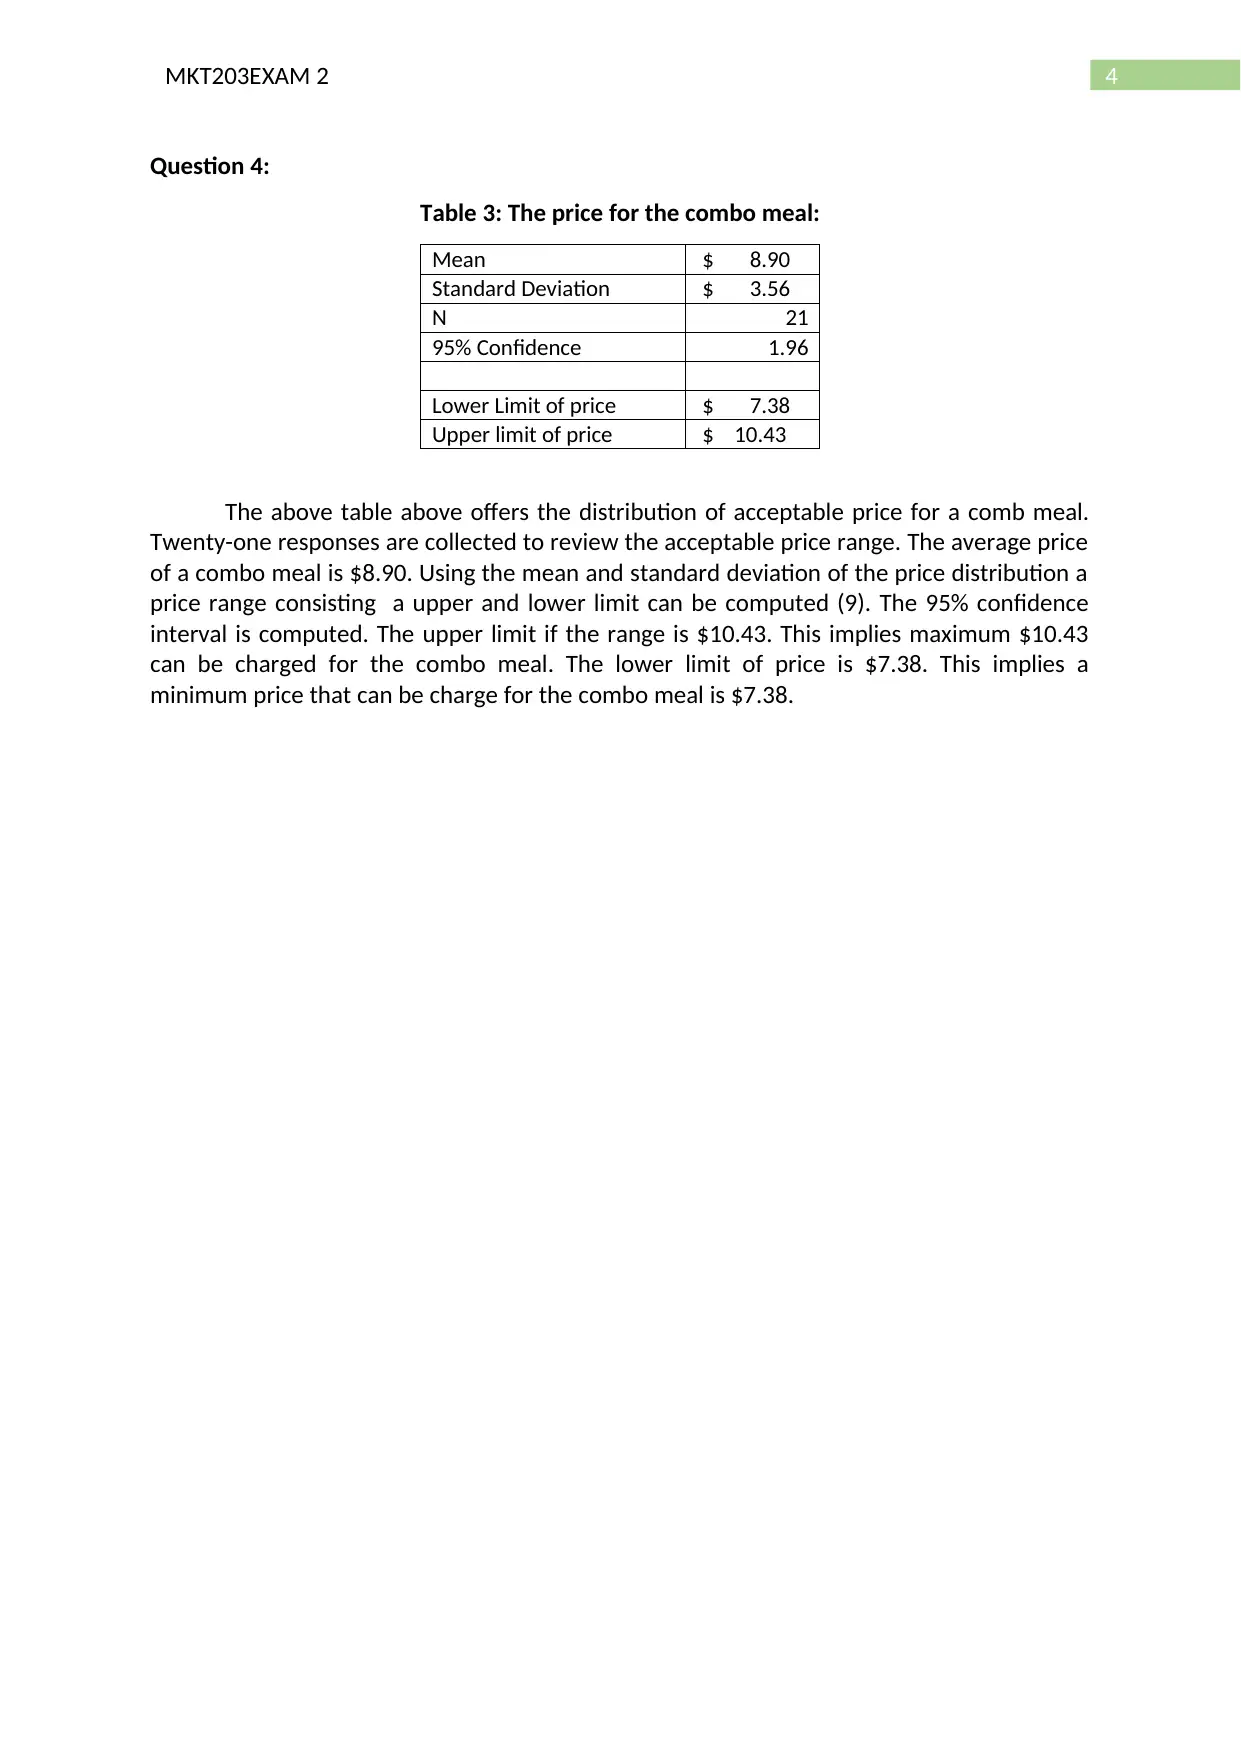
Table 3: The price for the combo meal:
Mean $ 8.90
Standard Deviation $ 3.56
N 21
95% Confidence 1.96
Lower Limit of price $ 7.38
Upper limit of price $ 10.43
The above table above offers the distribution of acceptable price for a comb meal.
Twenty-one responses are collected to review the acceptable price range. The average price
of a combo meal is $8.90. Using the mean and standard deviation of the price distribution a
price range consisting a upper and lower limit can be computed (9). The 95% confidence
interval is computed. The upper limit if the range is $10.43. This implies maximum $10.43
can be charged for the combo meal. The lower limit of price is $7.38. This implies a
minimum price that can be charge for the combo meal is $7.38.
Question 4:
Table 3: The price for the combo meal:
Mean $ 8.90
Standard Deviation $ 3.56
N 21
95% Confidence 1.96
Lower Limit of price $ 7.38
Upper limit of price $ 10.43
The above table above offers the distribution of acceptable price for a comb meal.
Twenty-one responses are collected to review the acceptable price range. The average price
of a combo meal is $8.90. Using the mean and standard deviation of the price distribution a
price range consisting a upper and lower limit can be computed (9). The 95% confidence
interval is computed. The upper limit if the range is $10.43. This implies maximum $10.43
can be charged for the combo meal. The lower limit of price is $7.38. This implies a
minimum price that can be charge for the combo meal is $7.38.
5MKT203EXAM 2
Question 5:
Perceptual Map:
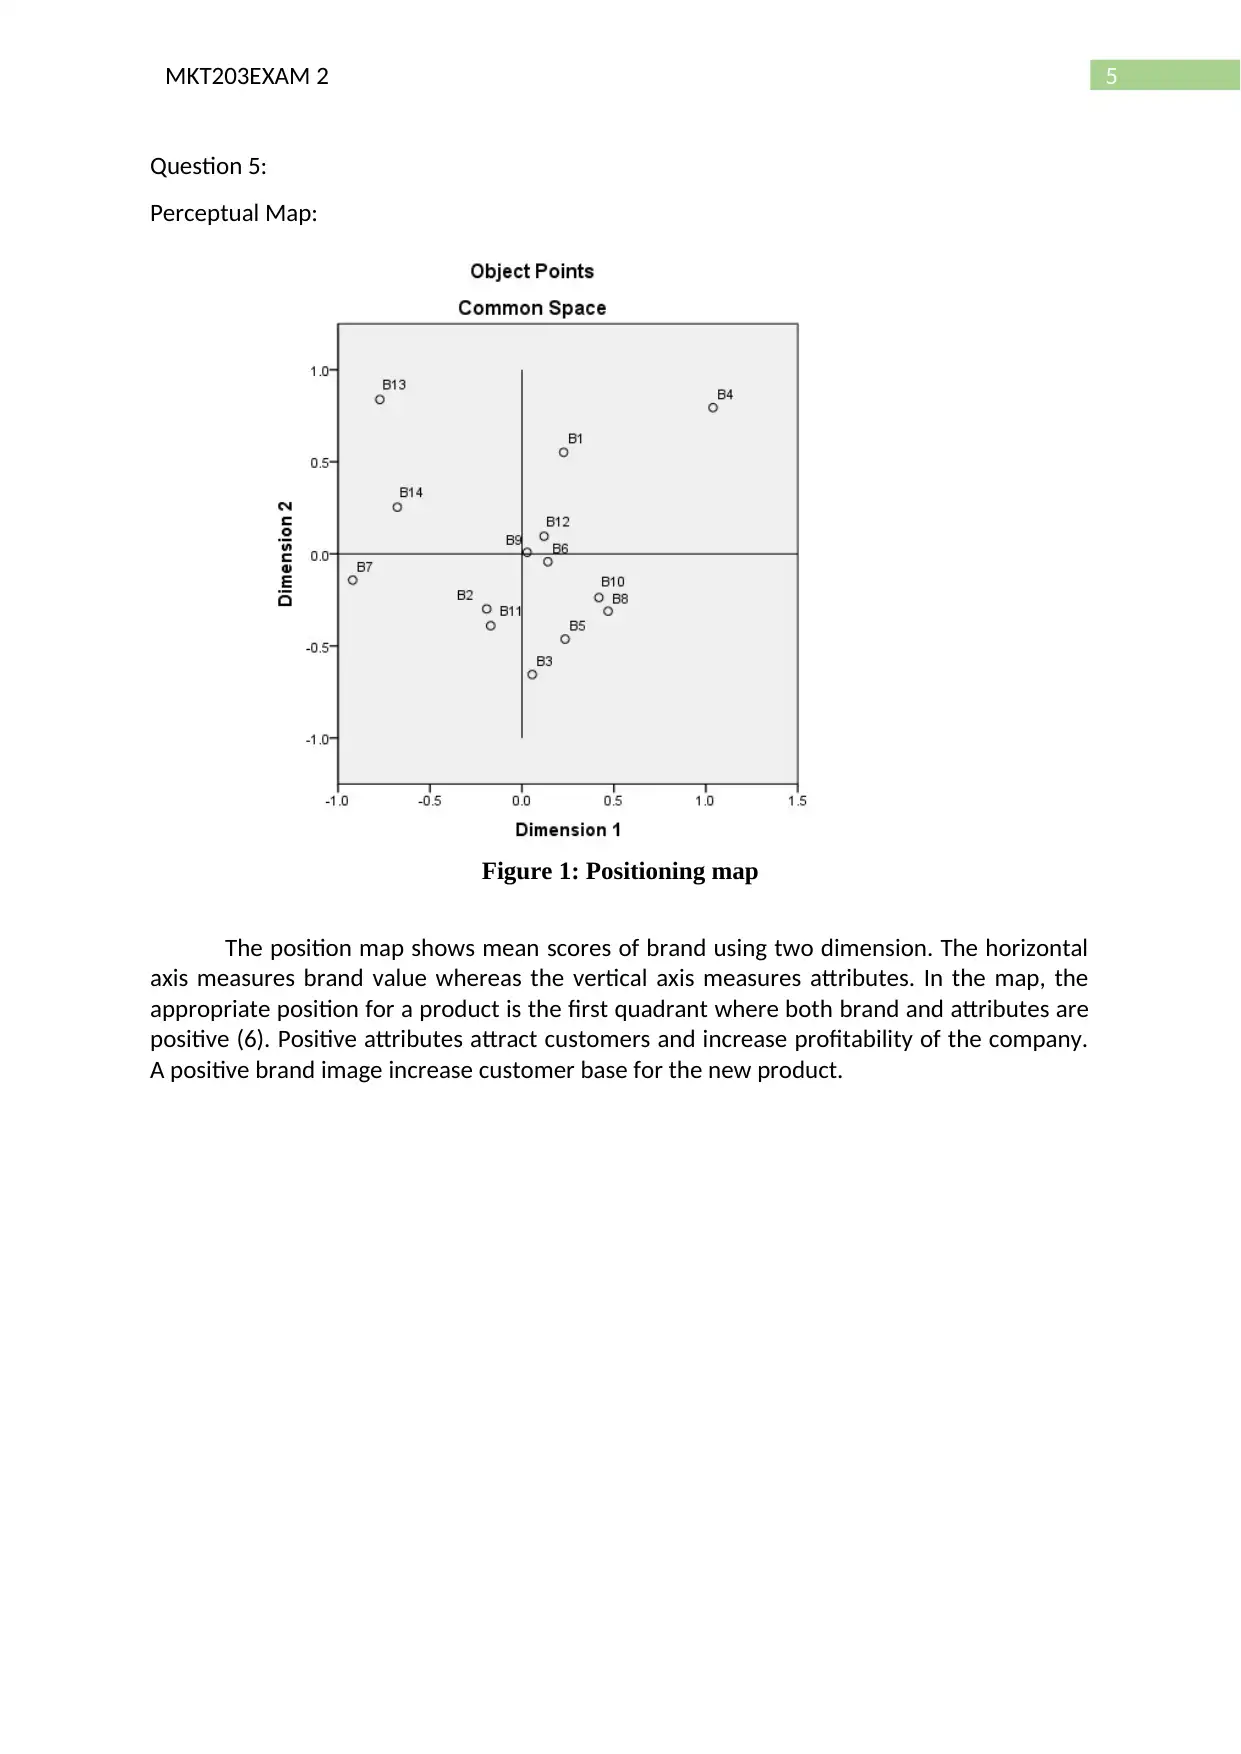
Figure 1: Positioning map
The position map shows mean scores of brand using two dimension. The horizontal
axis measures brand value whereas the vertical axis measures attributes. In the map, the
appropriate position for a product is the first quadrant where both brand and attributes are
positive (6). Positive attributes attract customers and increase profitability of the company.
A positive brand image increase customer base for the new product.
Question 5:
Perceptual Map:
Figure 1: Positioning map
The position map shows mean scores of brand using two dimension. The horizontal
axis measures brand value whereas the vertical axis measures attributes. In the map, the
appropriate position for a product is the first quadrant where both brand and attributes are
positive (6). Positive attributes attract customers and increase profitability of the company.
A positive brand image increase customer base for the new product.
⊘ This is a preview!⊘
Do you want full access?
Subscribe today to unlock all pages.
Trusted by 1+ million students worldwide
6MKT203EXAM 2
Question 6:
Apple i-phone revenue over the years from 1st quarter 2012 to 4th quarter 2018:
Q1, 2 0 12
Q3, 2 0 12
Q1, 2 0 13
Q3, 2 0 13
Q1, 2 0 14
Q3, 2 0 14
Q1, 2 0 15
Q3, 2 0 15
Q1, 2 0 16
Q3, 2 0 16
Q1, 2 0 17
Q3, 2 0 17
Q1, 2 0 18
Q3, 2 0 18
30.00%
35.00%
40.00%
45.00%
50.00%
55.00%
60.00%
65.00%
70.00%
75.00%
i-phone Revenue
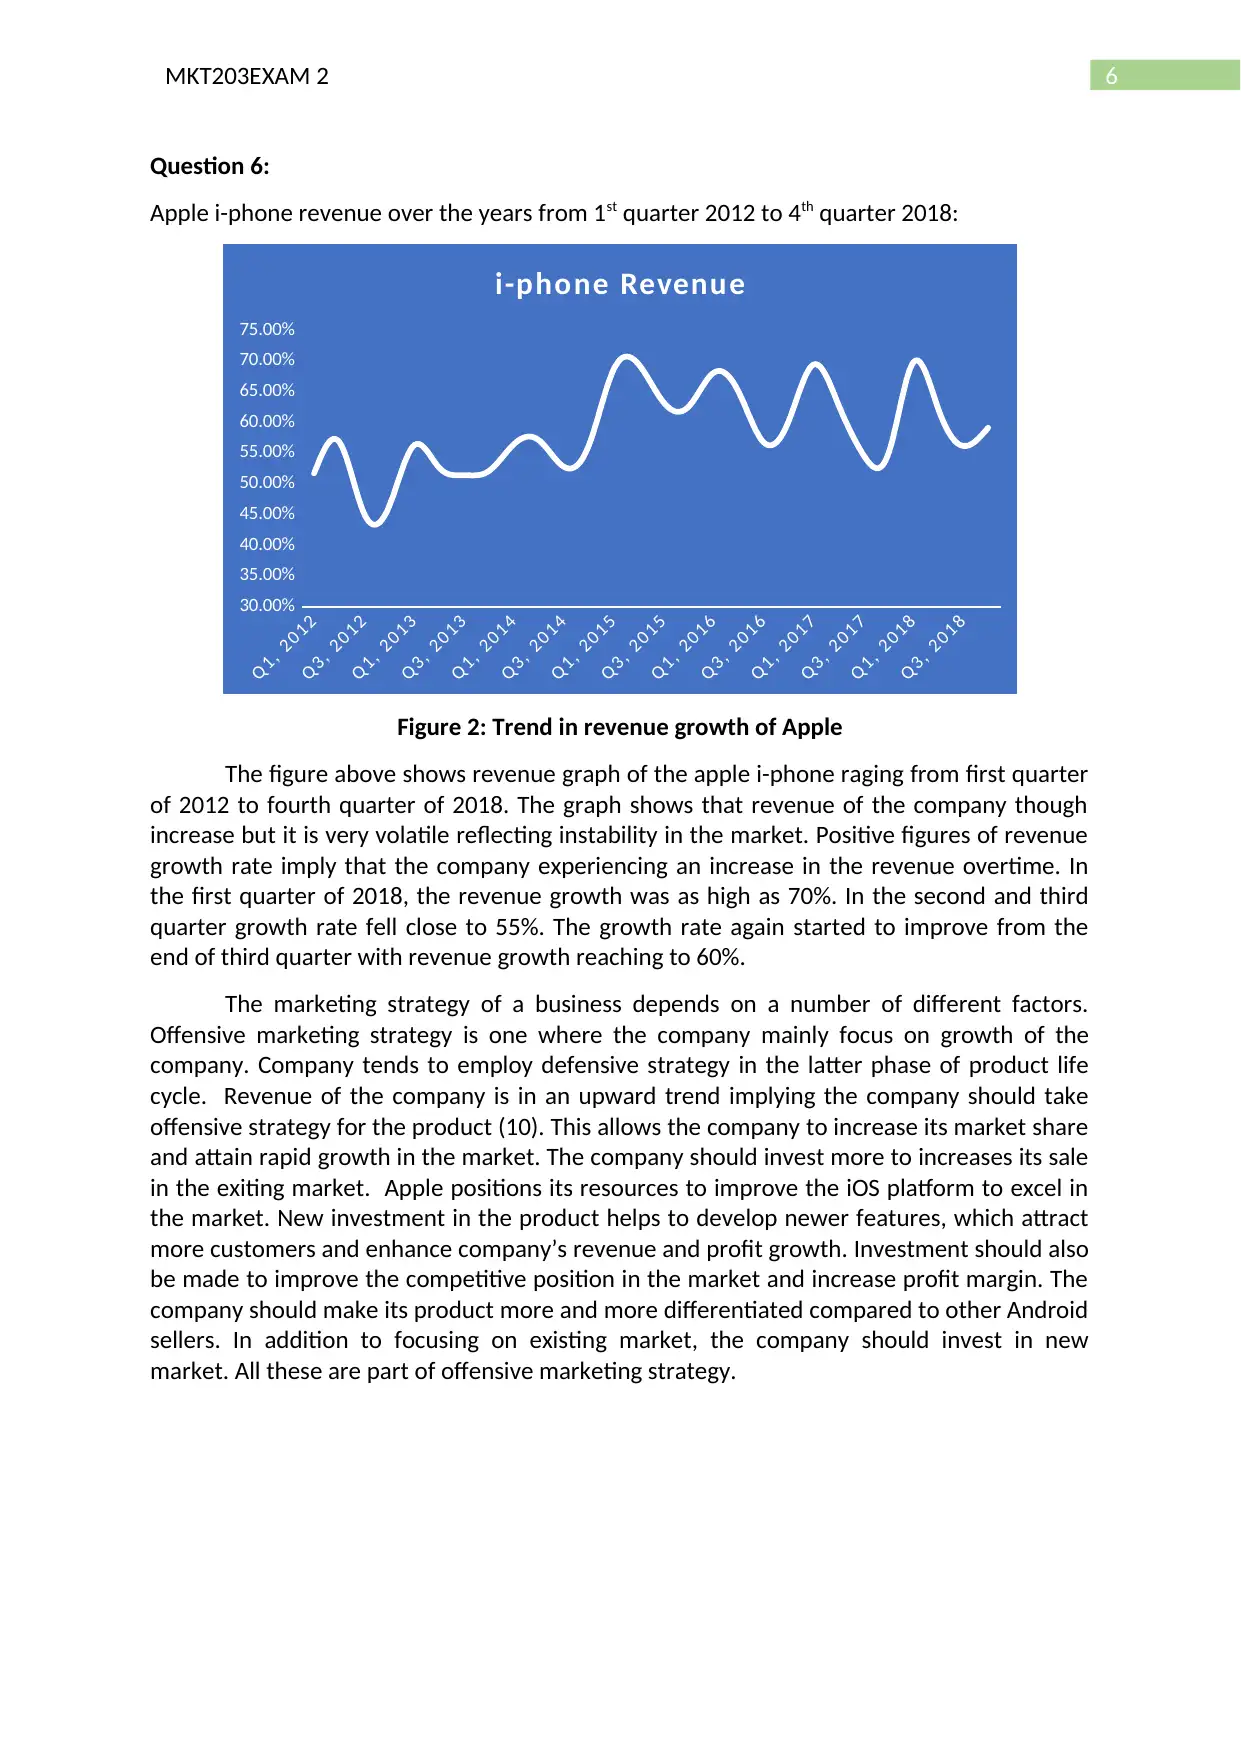
Figure 2: Trend in revenue growth of Apple
The figure above shows revenue graph of the apple i-phone raging from first quarter
of 2012 to fourth quarter of 2018. The graph shows that revenue of the company though
increase but it is very volatile reflecting instability in the market. Positive figures of revenue
growth rate imply that the company experiencing an increase in the revenue overtime. In
the first quarter of 2018, the revenue growth was as high as 70%. In the second and third
quarter growth rate fell close to 55%. The growth rate again started to improve from the
end of third quarter with revenue growth reaching to 60%.
The marketing strategy of a business depends on a number of different factors.
Offensive marketing strategy is one where the company mainly focus on growth of the
company. Company tends to employ defensive strategy in the latter phase of product life
cycle. Revenue of the company is in an upward trend implying the company should take
offensive strategy for the product (10). This allows the company to increase its market share
and attain rapid growth in the market. The company should invest more to increases its sale
in the exiting market. Apple positions its resources to improve the iOS platform to excel in
the market. New investment in the product helps to develop newer features, which attract
more customers and enhance company’s revenue and profit growth. Investment should also
be made to improve the competitive position in the market and increase profit margin. The
company should make its product more and more differentiated compared to other Android
sellers. In addition to focusing on existing market, the company should invest in new
market. All these are part of offensive marketing strategy.
Question 6:
Apple i-phone revenue over the years from 1st quarter 2012 to 4th quarter 2018:
Q1, 2 0 12
Q3, 2 0 12
Q1, 2 0 13
Q3, 2 0 13
Q1, 2 0 14
Q3, 2 0 14
Q1, 2 0 15
Q3, 2 0 15
Q1, 2 0 16
Q3, 2 0 16
Q1, 2 0 17
Q3, 2 0 17
Q1, 2 0 18
Q3, 2 0 18
30.00%
35.00%
40.00%
45.00%
50.00%
55.00%
60.00%
65.00%
70.00%
75.00%
i-phone Revenue
Figure 2: Trend in revenue growth of Apple
The figure above shows revenue graph of the apple i-phone raging from first quarter
of 2012 to fourth quarter of 2018. The graph shows that revenue of the company though
increase but it is very volatile reflecting instability in the market. Positive figures of revenue
growth rate imply that the company experiencing an increase in the revenue overtime. In
the first quarter of 2018, the revenue growth was as high as 70%. In the second and third
quarter growth rate fell close to 55%. The growth rate again started to improve from the
end of third quarter with revenue growth reaching to 60%.
The marketing strategy of a business depends on a number of different factors.
Offensive marketing strategy is one where the company mainly focus on growth of the
company. Company tends to employ defensive strategy in the latter phase of product life
cycle. Revenue of the company is in an upward trend implying the company should take
offensive strategy for the product (10). This allows the company to increase its market share
and attain rapid growth in the market. The company should invest more to increases its sale
in the exiting market. Apple positions its resources to improve the iOS platform to excel in
the market. New investment in the product helps to develop newer features, which attract
more customers and enhance company’s revenue and profit growth. Investment should also
be made to improve the competitive position in the market and increase profit margin. The
company should make its product more and more differentiated compared to other Android
sellers. In addition to focusing on existing market, the company should invest in new
market. All these are part of offensive marketing strategy.
Paraphrase This Document
Need a fresh take? Get an instant paraphrase of this document with our AI Paraphraser
7MKT203EXAM 2
Question 7:
In brand building, other than price, store image, distribution intensity, ad spending
and price deals an important component is brand customer service. A good quality of
customer service contributes in establishing a good brand image.
When company thinks of building a brand, the efforts are associated with marketing
department. However in today’s world customer services has an important role to play in
building brand reputation. Customer service has no become an integral part of company’s
success. In addition to basic components like price, store, distribution and advertising the
company needs to focus on the providing its customer a satisfactory service (8). The
customer service includes both pre and post-sale services. The pre-sale service includes
offering customers product according to their need and offer right information about the
product. The pose sale service is related to warranty related claim and response to customer
complains. Prompt response to customers’ complaint helps to develop customers’ trust
towards the brand.
Poor quality service results in reputation cost for the company. If one customer posts
in any social site about the poor quality service, then the company might lose many
customers due to negative feedback effect. In developing a good brand, company therefore
should focus on good quality of customer service.
8MKT203EXAM 2
Question 8:
Advertising expense generally has a positive influence on brand sales. Attractive
advertisements are used to increase sales. There is however instance showing how a cut in
advertising increase sales. It has been observed that Lingerie brand has experienced 9%
growth in sales when they stopped photo-shopping models. The decision to cut off spending
on models increases public approval and hence, boosts sales. America Eagles specializing in
selling sleepwear recorded an increase in sales of 9 percent (5). The company decided to
leave everything including beauty marks and tattoos from its ad campaign. Victoria’s secret
also faces problem for the awkward messages showed in the perfect body campaign. For
this category, offensive advertising has a negative impact on brand image and sales.
⊘ This is a preview!⊘
Do you want full access?
Subscribe today to unlock all pages.
Trusted by 1+ million students worldwide
9MKT203EXAM 2
Question 9:
Scatter plot of apple between American Customer Satisfaction Index and gross profit margin
over the years 2009 to 2018:
82.5 83 83.5 84 84.5 85 85.5 86 86.5 87 87.5
34
36
38
40
42
44
46
f(x) = 0.334259259259259 x + 11.2648148148148
R² = 0.086225011677867
Apple
American Customer Satisfaction Index
Gross Profit Margin
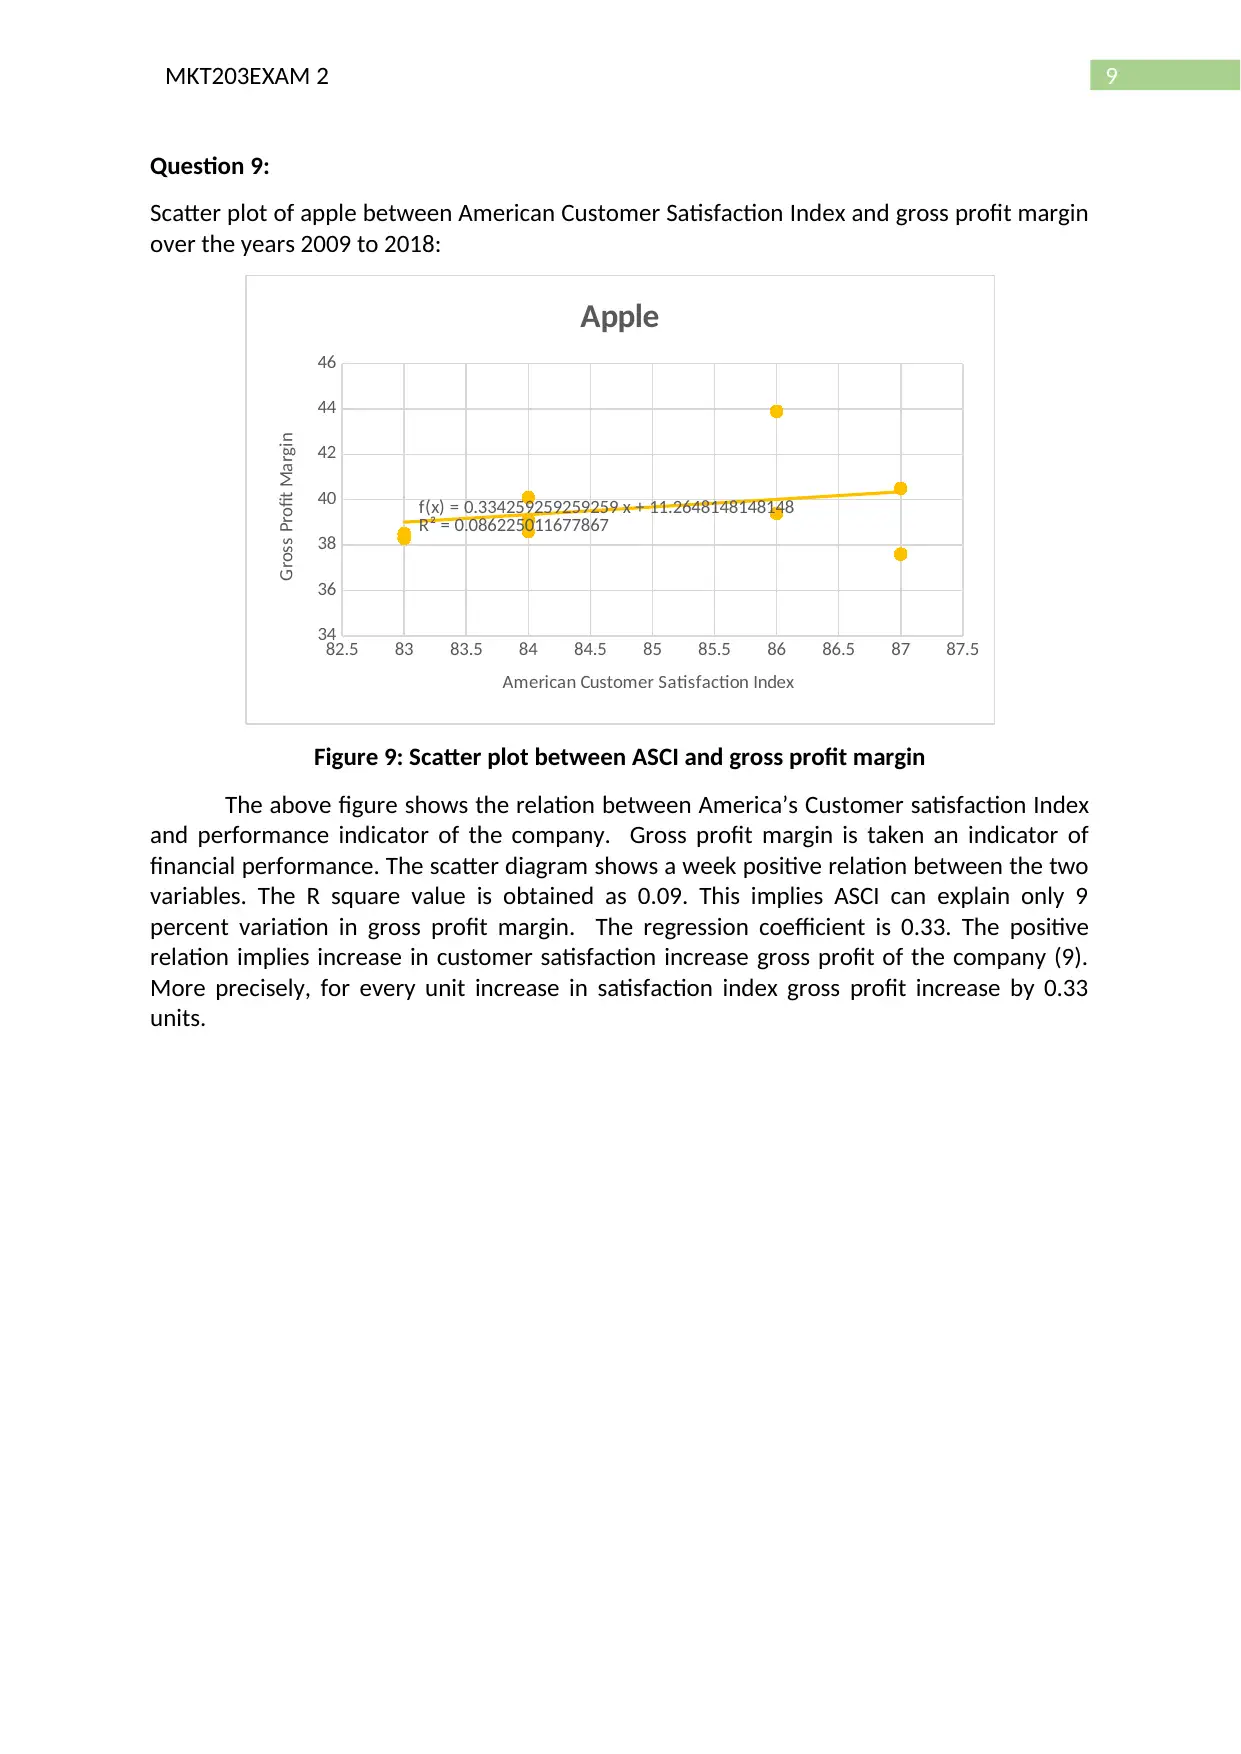
Figure 9: Scatter plot between ASCI and gross profit margin
The above figure shows the relation between America’s Customer satisfaction Index
and performance indicator of the company. Gross profit margin is taken an indicator of
financial performance. The scatter diagram shows a week positive relation between the two
variables. The R square value is obtained as 0.09. This implies ASCI can explain only 9
percent variation in gross profit margin. The regression coefficient is 0.33. The positive
relation implies increase in customer satisfaction increase gross profit of the company (9).
More precisely, for every unit increase in satisfaction index gross profit increase by 0.33
units.
Question 9:
Scatter plot of apple between American Customer Satisfaction Index and gross profit margin
over the years 2009 to 2018:
82.5 83 83.5 84 84.5 85 85.5 86 86.5 87 87.5
34
36
38
40
42
44
46
f(x) = 0.334259259259259 x + 11.2648148148148
R² = 0.086225011677867
Apple
American Customer Satisfaction Index
Gross Profit Margin
Figure 9: Scatter plot between ASCI and gross profit margin
The above figure shows the relation between America’s Customer satisfaction Index
and performance indicator of the company. Gross profit margin is taken an indicator of
financial performance. The scatter diagram shows a week positive relation between the two
variables. The R square value is obtained as 0.09. This implies ASCI can explain only 9
percent variation in gross profit margin. The regression coefficient is 0.33. The positive
relation implies increase in customer satisfaction increase gross profit of the company (9).
More precisely, for every unit increase in satisfaction index gross profit increase by 0.33
units.
Paraphrase This Document
Need a fresh take? Get an instant paraphrase of this document with our AI Paraphraser
10MKT203EXAM 2
Question 10:
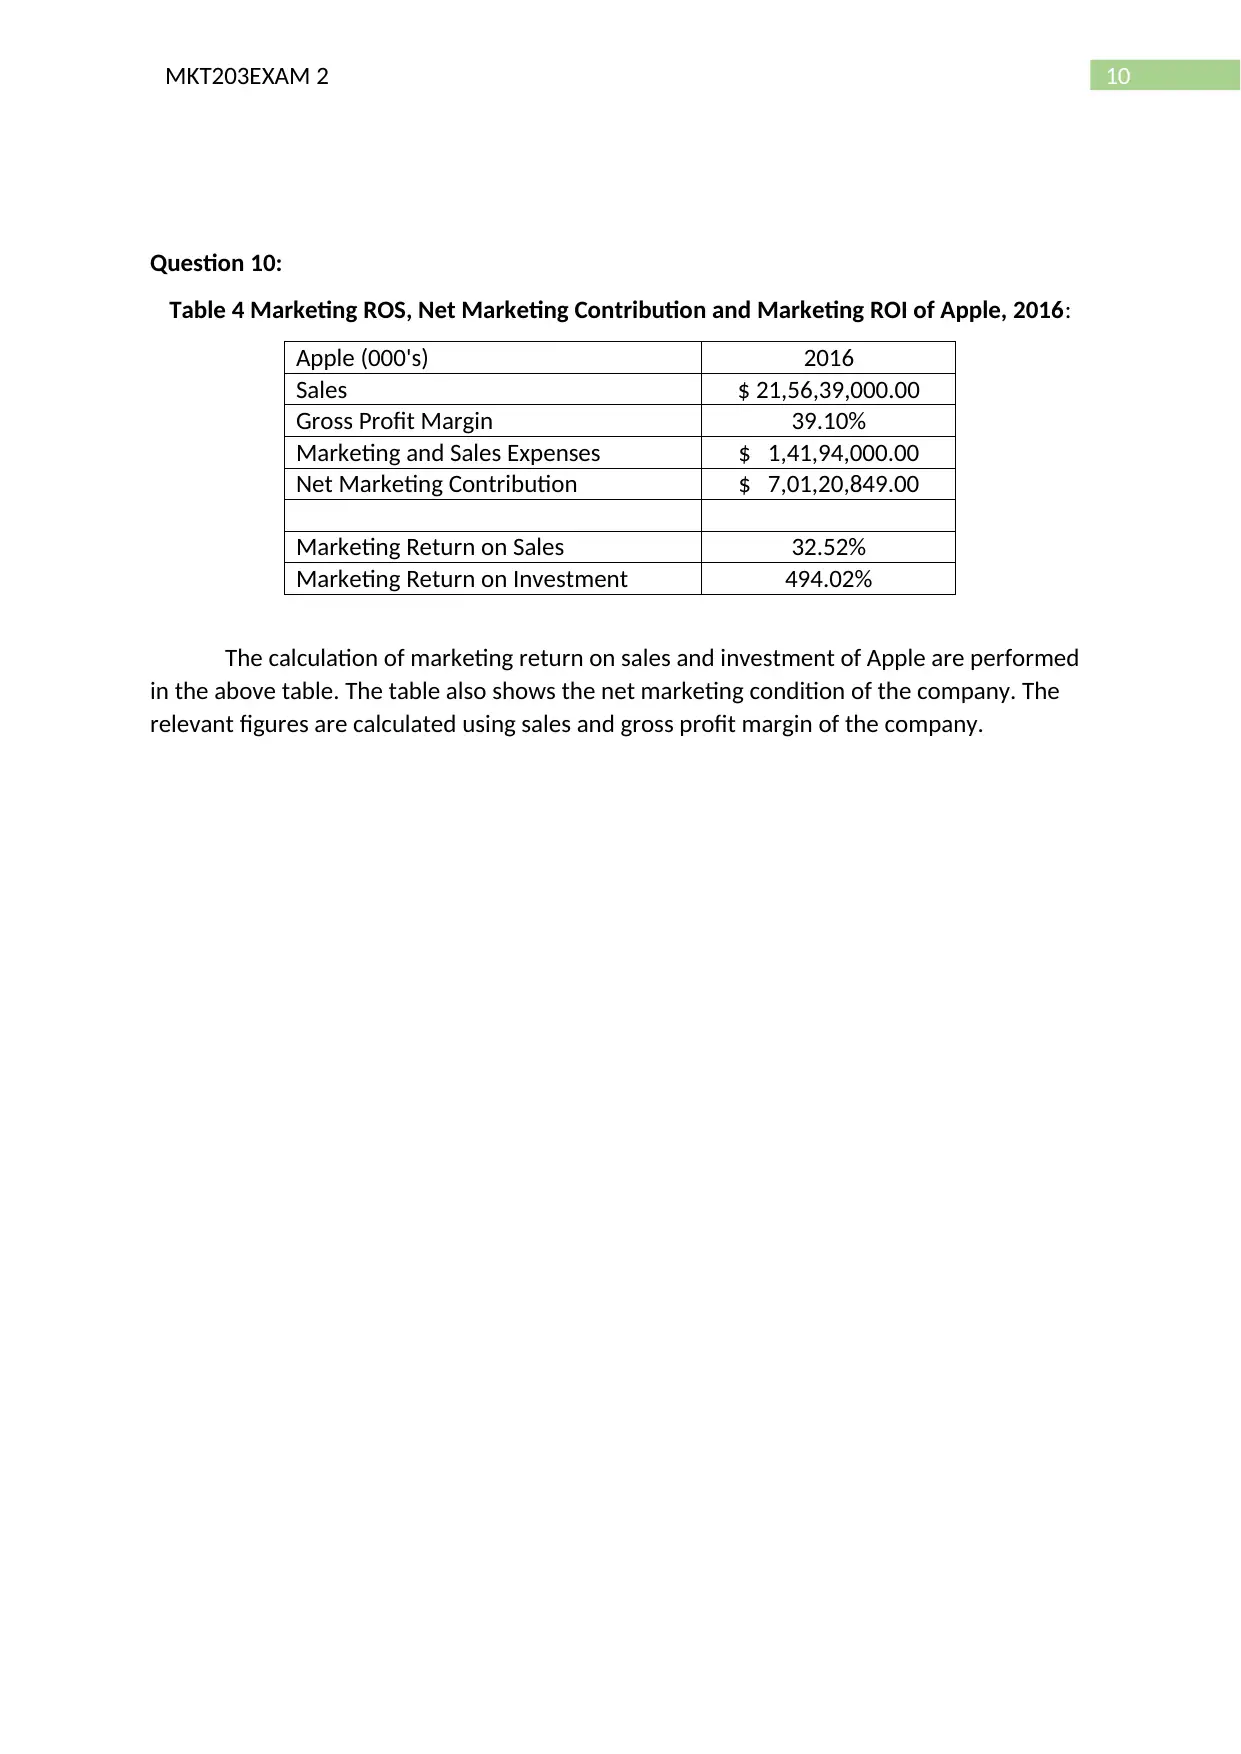
Table 4 Marketing ROS, Net Marketing Contribution and Marketing ROI of Apple, 2016:
Apple (000's) 2016
Sales $ 21,56,39,000.00
Gross Profit Margin 39.10%
Marketing and Sales Expenses $ 1,41,94,000.00
Net Marketing Contribution $ 7,01,20,849.00
Marketing Return on Sales 32.52%
Marketing Return on Investment 494.02%
The calculation of marketing return on sales and investment of Apple are performed
in the above table. The table also shows the net marketing condition of the company. The
relevant figures are calculated using sales and gross profit margin of the company.
Question 10:
Table 4 Marketing ROS, Net Marketing Contribution and Marketing ROI of Apple, 2016:
Apple (000's) 2016
Sales $ 21,56,39,000.00
Gross Profit Margin 39.10%
Marketing and Sales Expenses $ 1,41,94,000.00
Net Marketing Contribution $ 7,01,20,849.00
Marketing Return on Sales 32.52%
Marketing Return on Investment 494.02%
The calculation of marketing return on sales and investment of Apple are performed
in the above table. The table also shows the net marketing condition of the company. The
relevant figures are calculated using sales and gross profit margin of the company.
11MKT203EXAM 2
References
1. Ind N, Iglesias O, Schultz M. Building brands together: Emergence and outcomes of
co-creation. California Management Review. 2013 May;55(3):5-26.
2. Dietrich T, Rundle-Thiele S, Kubacki K. Segmentation in Social Marketing. Singapore:
Springer; 2017.
3. Cross JC, Belich TJ, Rudelius W. How marketing managers use market segmentation:
An exploratory study. InProceedings of the 1990 Academy of Marketing Science
(AMS) Annual Conference 2015 (pp. 531-536). Springer, Cham.
4. D. Newton J, J. Newton F, Turk T, T. Ewing M. Ethical evaluation of audience
segmentation in social marketing. European Journal of Marketing. 2013 Sep
20;47(9):1421-38.
5. Masaryk H, Masaryk H. When This Lingerie Brand Stopped Photoshopping Models,
Sales Shot Up 9%. Adweek.com. https://www.adweek.com/brand-marketing/when-
lingerie-brand-stopped-photoshopping-models-sales-went-through-roof-161224/.
Published 2018. Accessed December 10, 2018.
6. Weinstein A, Cahill DJ. Lifestyle market segmentation. Routledge; 2014 May 12.
7. Venter P, Wright A, Dibb S. Performing market segmentation: a performative
perspective. Journal of Marketing Management. 2015 Jan 2;31(1-2):62-83.
8. Spann M, Fischer M, Tellis GJ. Skimming or penetration? Strategic dynamic pricing
for new products. Marketing Science. 2014 Dec 18;34(2):235-49.
9. Chatterjee S, Hadi AS. Regression analysis by example. John Wiley & Sons; 2015 Feb
25.
10. Jorgensen S, Sigué SP. Defensive, offensive, and generic advertising in a Lanchester
model with market growth. Dynamic Games and Applications. 2015 Dec 1;5(4):523-
39.
⊘ This is a preview!⊘
Do you want full access?
Subscribe today to unlock all pages.
Trusted by 1+ million students worldwide
1 out of 12

Your All-in-One AI-Powered Toolkit for Academic Success.
+13062052269
info@desklib.com
Available 24*7 on WhatsApp / Email
![[object Object]](/_next/static/media/star-bottom.7253800d.svg)
Unlock your academic potential
Copyright © 2020–2026 A2Z Services. All Rights Reserved. Developed and managed by ZUCOL.