Analyzing Twitter Data with Machine Learning in R: A Detailed Report
VerifiedAdded on 2022/10/06
|13
|2705
|17
Report
AI Summary
This report presents an application of machine learning techniques for sentiment analysis of Twitter data using the R programming language. The study explores the use of various algorithms, including decision trees, random forests, Naïve Bayes, logistic regression (supervised learning), and k-means clustering (unsupervised learning), to classify tweets and extract user sentiments. The report details the methodology, including data preprocessing, model development, and performance evaluation using metrics like accuracy, specificity, and sensitivity. The implementation involves converting text data to a CSV format, importing it into R, and building the models using the provided datasets. The results of the models are evaluated using confusion matrices and other relevant metrics. The report also includes a literature review, technical demonstrations, and a conclusion summarizing the findings and limitations of the study. The report is written for a data analytics course, NIT3202, and aims to demonstrate proficiency in applying machine learning algorithms for data analysis purposes.
Application of machine learning in R
Executive summary
With the rapid growth in social media platform, the internet has been recognized as one of the
platform for online studies, sharing and exchange of ideas as well as opinions. Social media
comprises of a lot of data inform of tweets, posts, blogs and status updates etc. In this report, the
most famous social media platform used for blogging called Twitter is discussed. Twitter
comprises of huge quantity sentiments data (tweets) that should be analyzed so as to extract
user’s ideas and suggestions. The main goal of this report is to explore how machine learning
technique can be used to expand data in a sequence of posts putting focus on several trends of
languages used for tweets as well as the tweets volumes. The use of experimental evaluation
indicates that the suggested machine classifiers are better and efficient in terms of specificity,
sensitivity and accuracy. The suggested algorithm is implemented in R-programming software or
R-studio.
Key words –Machine learning, sentiments, Twitter, R-studio.
Introduction
Social media platforms are among the few sources which contain important types of information.
This is because each and every person post their perceptions on several agendas, current issues
are discussed, people complains and shares positive statements for various products used in the
daily life. Data mining or sentimental analysis involves the process of extracting quality
information from a given text (Cordon et al., 2018). Moreover, it’s the process of extracting well
and organized data from the one that is unstructured or not organized, which aid in measuring the
customer’s opinion, product reviews and reports. Unorganized data not only refers to figures
from the company, tables but also comprises of information drawn from the internet such as E-
Paraphrase This Document
Need a fresh take? Get an instant paraphrase of this document with our AI Paraphraser
mails, chats, social media sites, pdfs and word file. The operations can be easily analyzed and
better results obtained using the structured data. However, in the case of unstructured data such
as twitter, E-mail etc it’s not quite easy obtaining output this is due to challenges such as
ununique data and the virtual noise effect (Kumari,Vidya $Karitha,2019). In this report, we focus
on one of the social media platform known all over the world called Twitter. The report consists
of different sections. The first section contains the literature review which involves studying
other authors books, journals based on machine learning. The second section addresses different
machine learning techniques. The third section clearly explains the development of the different
algorithms, for instance in this report we have discussed five different algorithms. The last
section involves the performance of the model and conclusions. All the models will be generated
using both the test and train data sets one and two (Arora et al., 2018). The five models to be
generated include decision tree, random forest, naïve Bayes and logistic regression which are all
supervised types of machine learning and k-means clustering which is an example of
unsupervised types of machine learning.
Literature review
Many researchers have published researches based on the sentiments analysis techniques from
time to time. The data mining techniques improves the results of classifications, features
selection and different data pre-processing steps etc. The research focusses on both supervised
and unsurpevised approach for data minng task. Various researches have define multiple faces of
data mining as opinion oriented and feature extracted (Bowers, Alex & Xiaoliang Zhou, 2019).
Machine learning classifiers such as supervised types need different characteristics for learning
from time to time for better comparison of the output. Different data sets are collected then pre-
processed before conducting the supervised types of machine learning (Bowers, Alex and
Xiaoliang Zhou, 2019). Various classifiers and approaches such as naïve Bayes have been used
from time to time for evaluating the output as preecision, f-measure, recall and accuracy.
Supervised machine learning algorithms and it’s importance
Mjarity of machine learning techniques uses the supervised machine learning methods. In this
case the input and output variables are used to learn an algorithm. The main goal in supervised
machine learning is to come up with a mapping function that can be used to predict the output
variables. The name supervised machine learning is used beacause the process learns from the
the training data set. The algorithm continously make prediction on the training data until the
correct prediction are made. This process stops only after achieving the correct level of
perfomance. There are two methods of supervised machine learning that is classification and
regression. In this report we shall discuss four types of supervised machine learning algorithms
such as decision tree, naïve Bayes, logistic regression and random forest. The decision tree are
trees which classifies through sorting based on characteristics values (Benvenuto et al., 2018). A
In a decision tree, each node represents a characteristics to be classified and the branch
represents the value which can be assumed by the node. Therefore, the decision tree predicts the
model by mapping the observation with the target value. The next type of machine learning is the
Naïve Bayes. It comprises of simple bayesian networks of cyclic graphs with only one
unobserved node (Naghibi et al., 2016). The Naïve Bayes is based on estimation making it
inaccurate as compared to other types of supervised machine learning models. The next type of
machine learing is the logistic regression. In this binomial outcome is used to determine the
classification. Furthermore, the association between the dependent variable and the independent
variable are identified. Logistic regression is considered as one of classifications which are
⊘ This is a preview!⊘
Do you want full access?
Subscribe today to unlock all pages.
Trusted by 1+ million students worldwide
accurate. This is brought by the use of probabilities to make prediction (Arora et al., 2018). It’s
perfomance and evaluation can be tested by the use of confusion matrix, F-measure and AUC.
The last type of supervised machine learning type that will be discussed in this report is the
random forest. This method uses several artificial tree for classification. This can be computed
easily in R-studio using the different in built libraries or packages. It’s perfomance and
evaluation are tested by use of confusion matrix.
Unsupervised machine learning algorithms and it’s importance
In this case we only have the input but no output variables. The main gaol of this method is to
model the structured data inorder to know more from the data (Karatay et al., 2016).
Moreover,the algorithm discovers and presents the intersting data by their own. The
unsupervised machine learning algorithm comprises of clustering and association. In this report
we shall only discuss the k-means or clustering. It classifies data based on the number of clusters
( k clusters) and can be used when the labeled data is inavailable.
Creations of classification models
The data sets provided were in the form of text and this could be opened and viewed in notepad.
First the data was converted from text to a csv file in excel for easy analysis. This because in
machine learning most models can be easily generated using numeric data and not text data. The
text data is mainly used in text and natural language analysis. After conversion into a csv file the
first roe in the excel was used to insert the variables names as given by the JSON format in the
requirement file. Thereafter, the csv file was imported into R-studio then viewed. The data set
consist of defferent variables and it’s in tabulart form. After the data importation, we dig deep
into the models mentioned above and start by the creation of logistic regression model. Before
beginning this creation we first ensure that all the data sets that is both the trained and tested data
Paraphrase This Document
Need a fresh take? Get an instant paraphrase of this document with our AI Paraphraser
sets are imported or loaded into R. There are two data sets provided therefore we will create the
models based on these data sets. We shall use the test data set to make prediction this is because
the model generated shall be judged based on it’s perfomance and evaluation. In each and every
step carried there would be an illustration and explaination involved.
Technical demostration
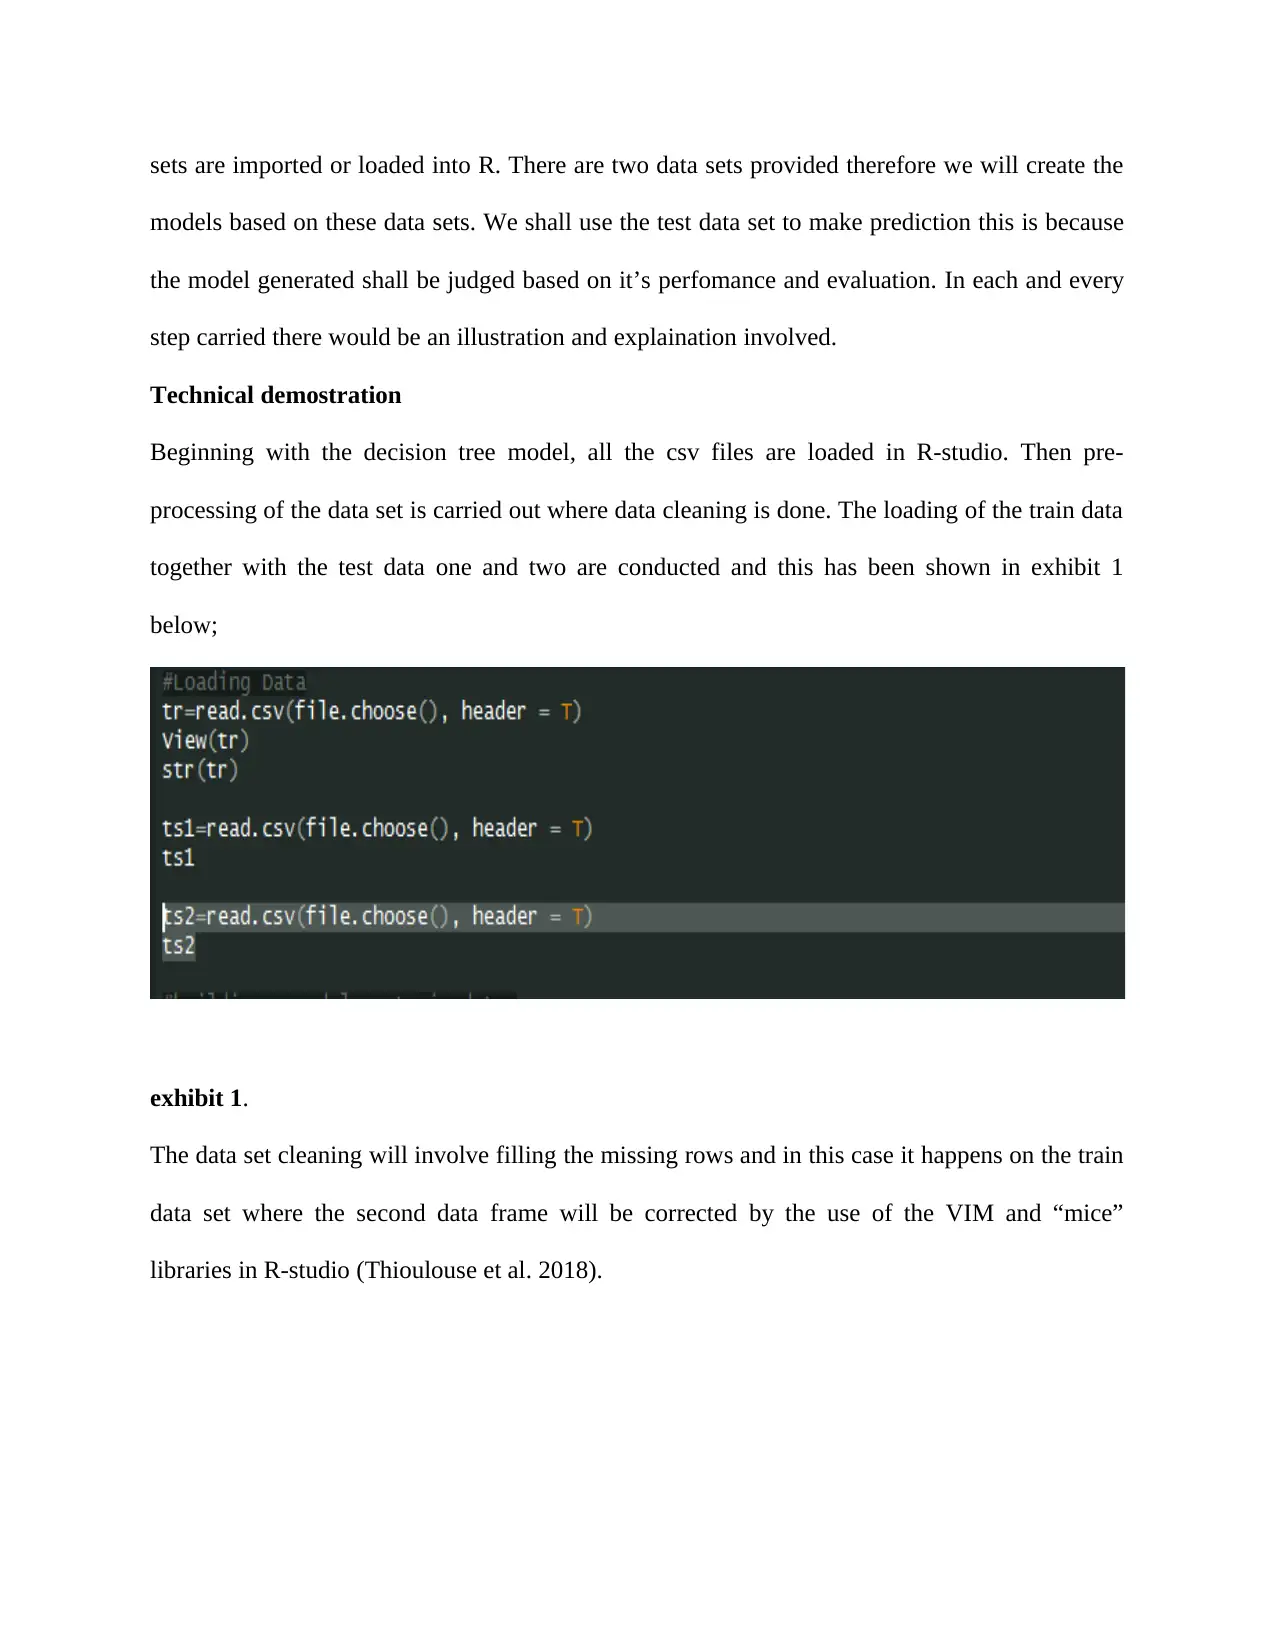
Beginning with the decision tree model, all the csv files are loaded in R-studio. Then pre-
processing of the data set is carried out where data cleaning is done. The loading of the train data
together with the test data one and two are conducted and this has been shown in exhibit 1
below;
exhibit 1.
The data set cleaning will involve filling the missing rows and in this case it happens on the train
data set where the second data frame will be corrected by the use of the VIM and “mice”
libraries in R-studio (Thioulouse et al. 2018).
models based on these data sets. We shall use the test data set to make prediction this is because
the model generated shall be judged based on it’s perfomance and evaluation. In each and every
step carried there would be an illustration and explaination involved.
Technical demostration
Beginning with the decision tree model, all the csv files are loaded in R-studio. Then pre-
processing of the data set is carried out where data cleaning is done. The loading of the train data
together with the test data one and two are conducted and this has been shown in exhibit 1
below;
exhibit 1.
The data set cleaning will involve filling the missing rows and in this case it happens on the train
data set where the second data frame will be corrected by the use of the VIM and “mice”
libraries in R-studio (Thioulouse et al. 2018).
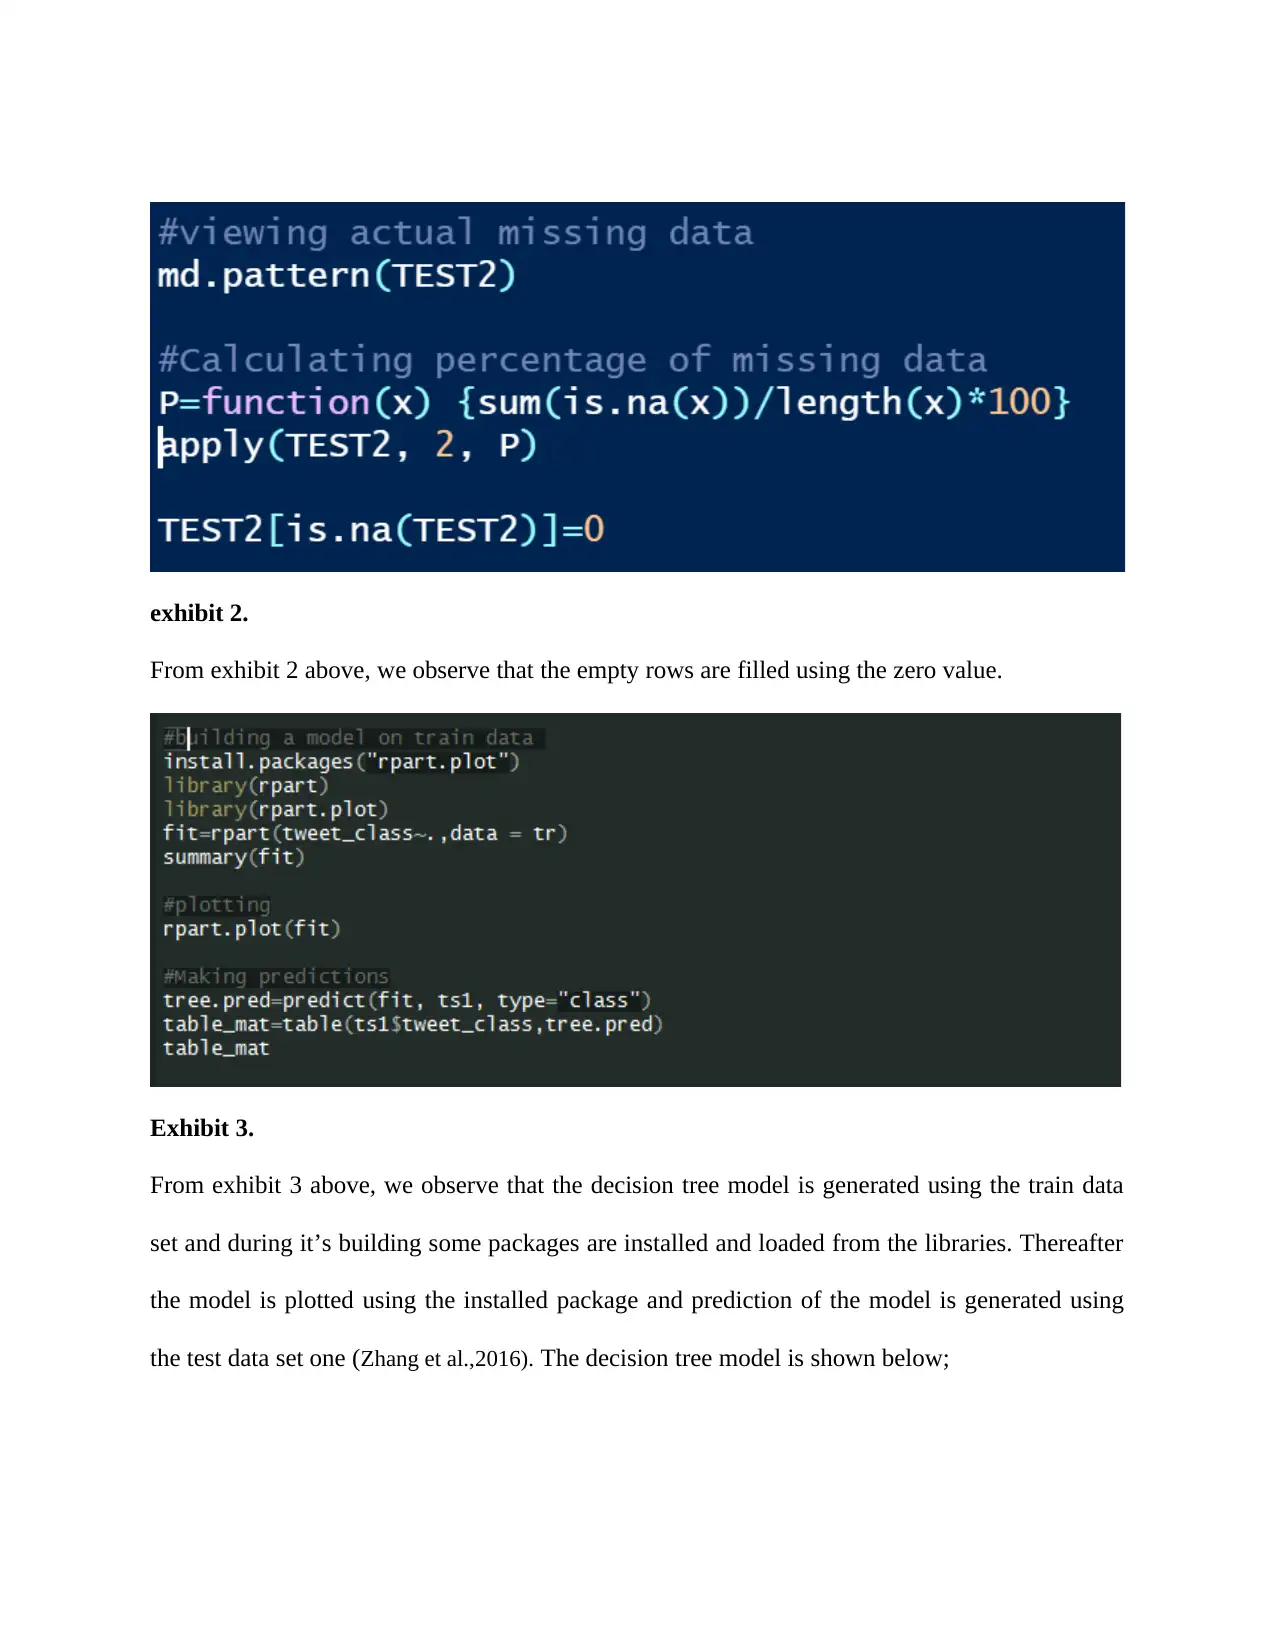
exhibit 2.
From exhibit 2 above, we observe that the empty rows are filled using the zero value.
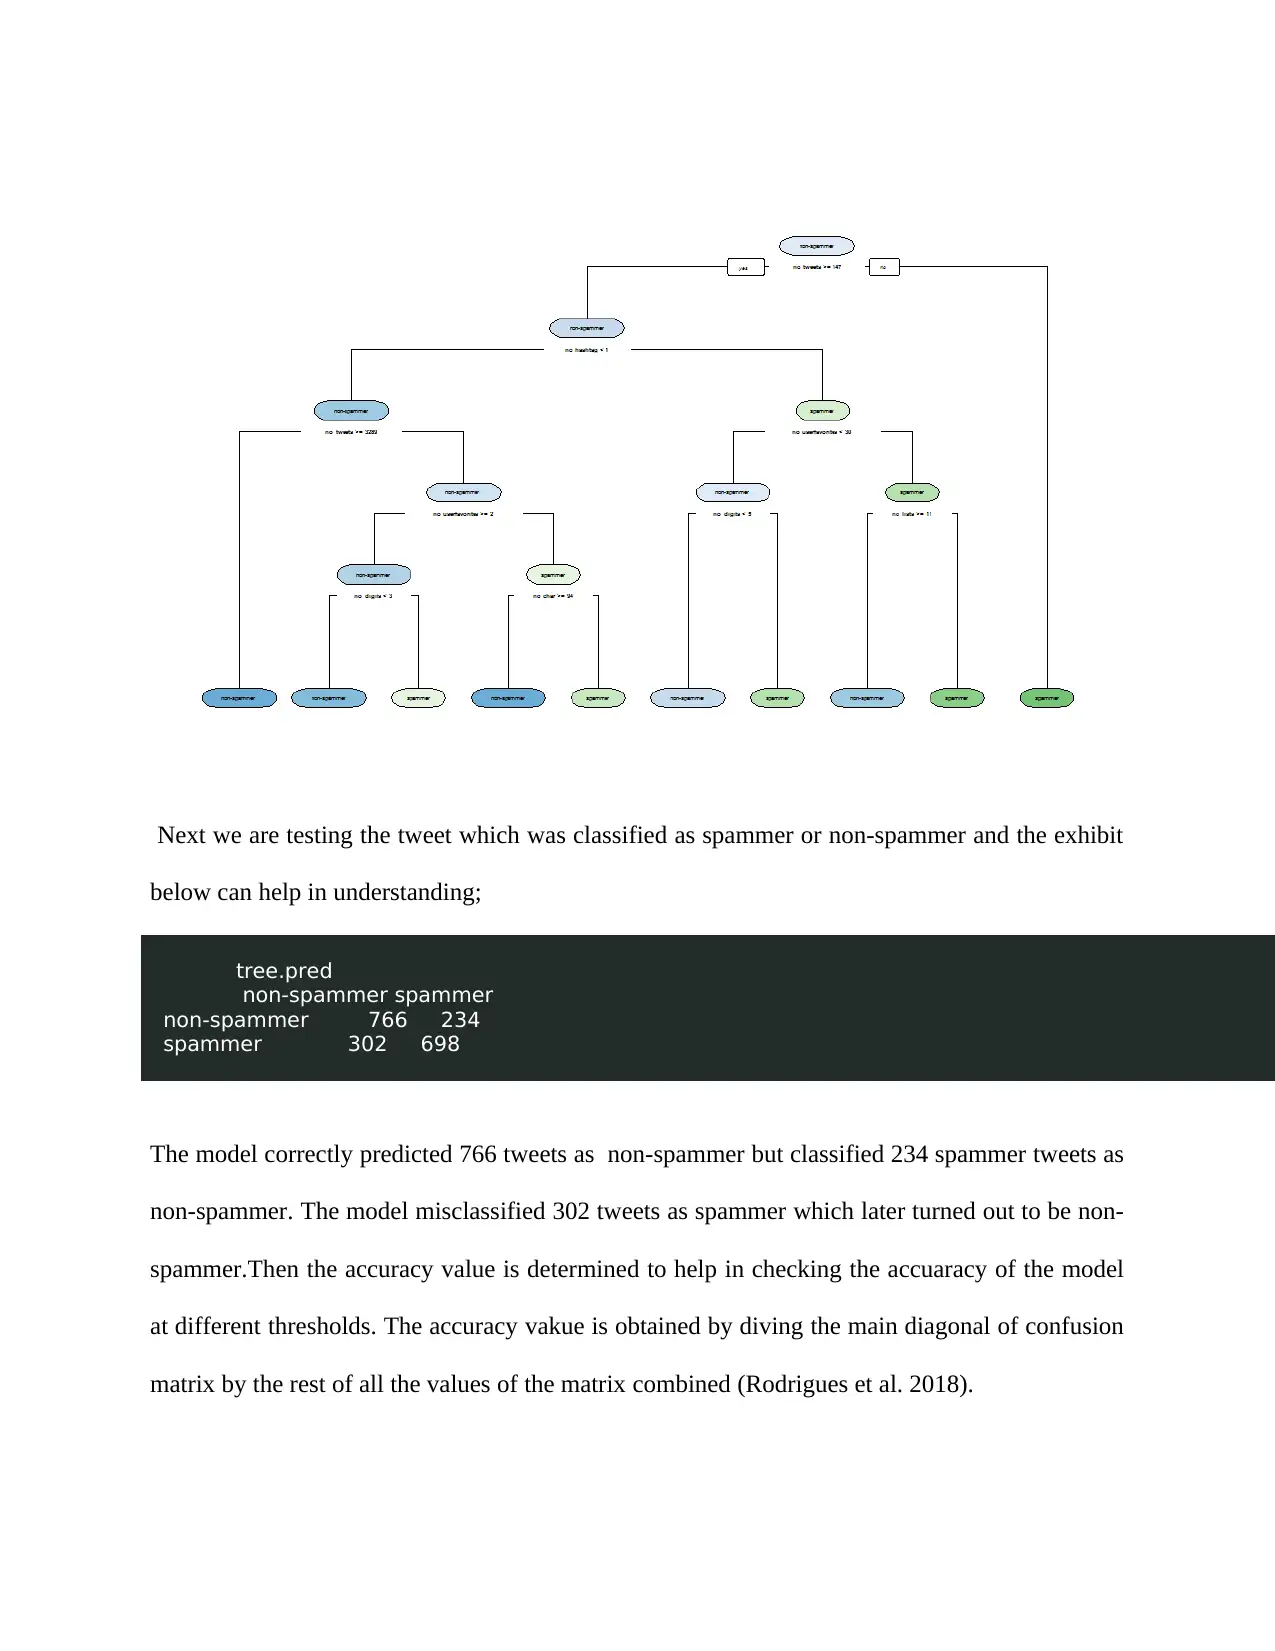
Exhibit 3.
From exhibit 3 above, we observe that the decision tree model is generated using the train data
set and during it’s building some packages are installed and loaded from the libraries. Thereafter
the model is plotted using the installed package and prediction of the model is generated using
the test data set one (Zhang et al.,2016). The decision tree model is shown below;
From exhibit 2 above, we observe that the empty rows are filled using the zero value.
Exhibit 3.
From exhibit 3 above, we observe that the decision tree model is generated using the train data
set and during it’s building some packages are installed and loaded from the libraries. Thereafter
the model is plotted using the installed package and prediction of the model is generated using
the test data set one (Zhang et al.,2016). The decision tree model is shown below;
⊘ This is a preview!⊘
Do you want full access?
Subscribe today to unlock all pages.
Trusted by 1+ million students worldwide
Next we are testing the tweet which was classified as spammer or non-spammer and the exhibit
below can help in understanding;
tree.pred
non-spammer spammer
non-spammer 766 234
spammer 302 698
The model correctly predicted 766 tweets as non-spammer but classified 234 spammer tweets as
non-spammer. The model misclassified 302 tweets as spammer which later turned out to be non-
spammer.Then the accuracy value is determined to help in checking the accuaracy of the model
at different thresholds. The accuracy vakue is obtained by diving the main diagonal of confusion
matrix by the rest of all the values of the matrix combined (Rodrigues et al. 2018).
Paraphrase This Document
Need a fresh take? Get an instant paraphrase of this document with our AI Paraphraser
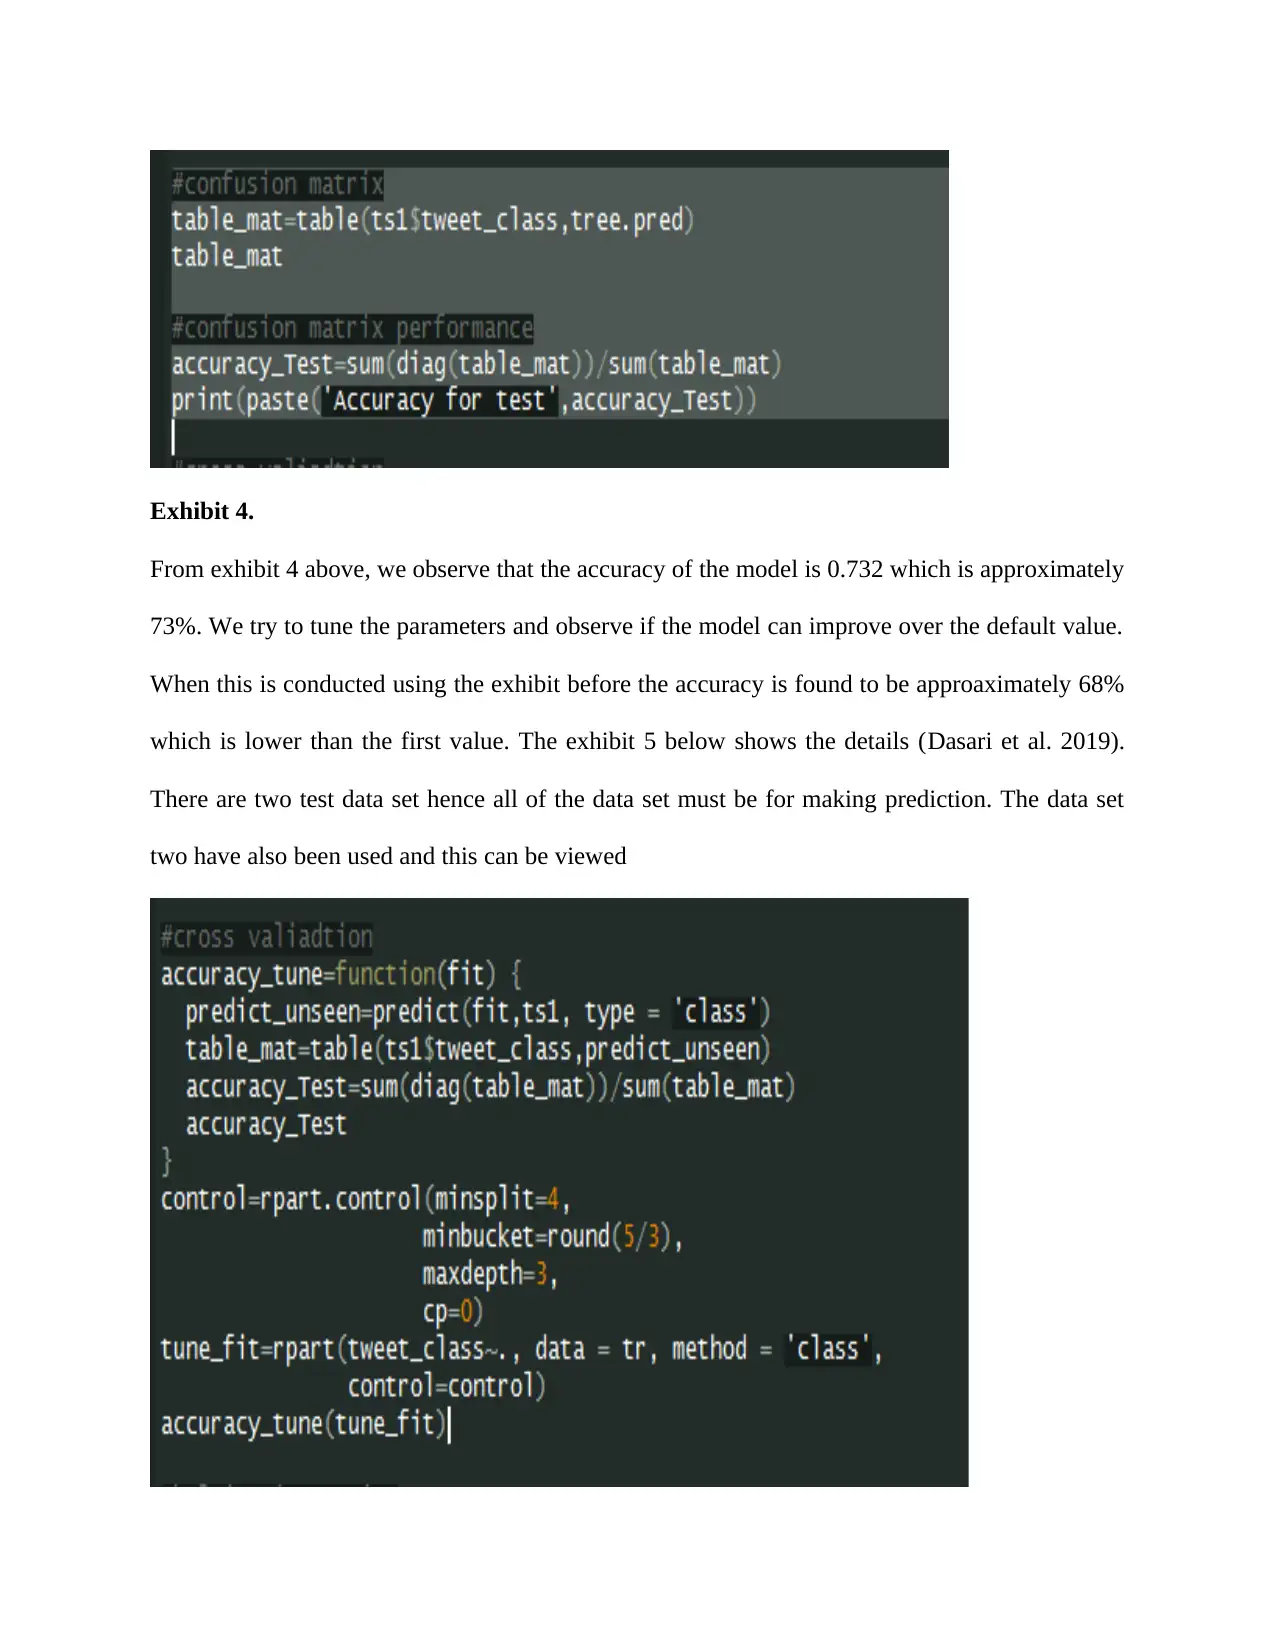
Exhibit 4.
From exhibit 4 above, we observe that the accuracy of the model is 0.732 which is approximately
73%. We try to tune the parameters and observe if the model can improve over the default value.
When this is conducted using the exhibit before the accuracy is found to be approaximately 68%
which is lower than the first value. The exhibit 5 below shows the details (Dasari et al. 2019).
There are two test data set hence all of the data set must be for making prediction. The data set
two have also been used and this can be viewed
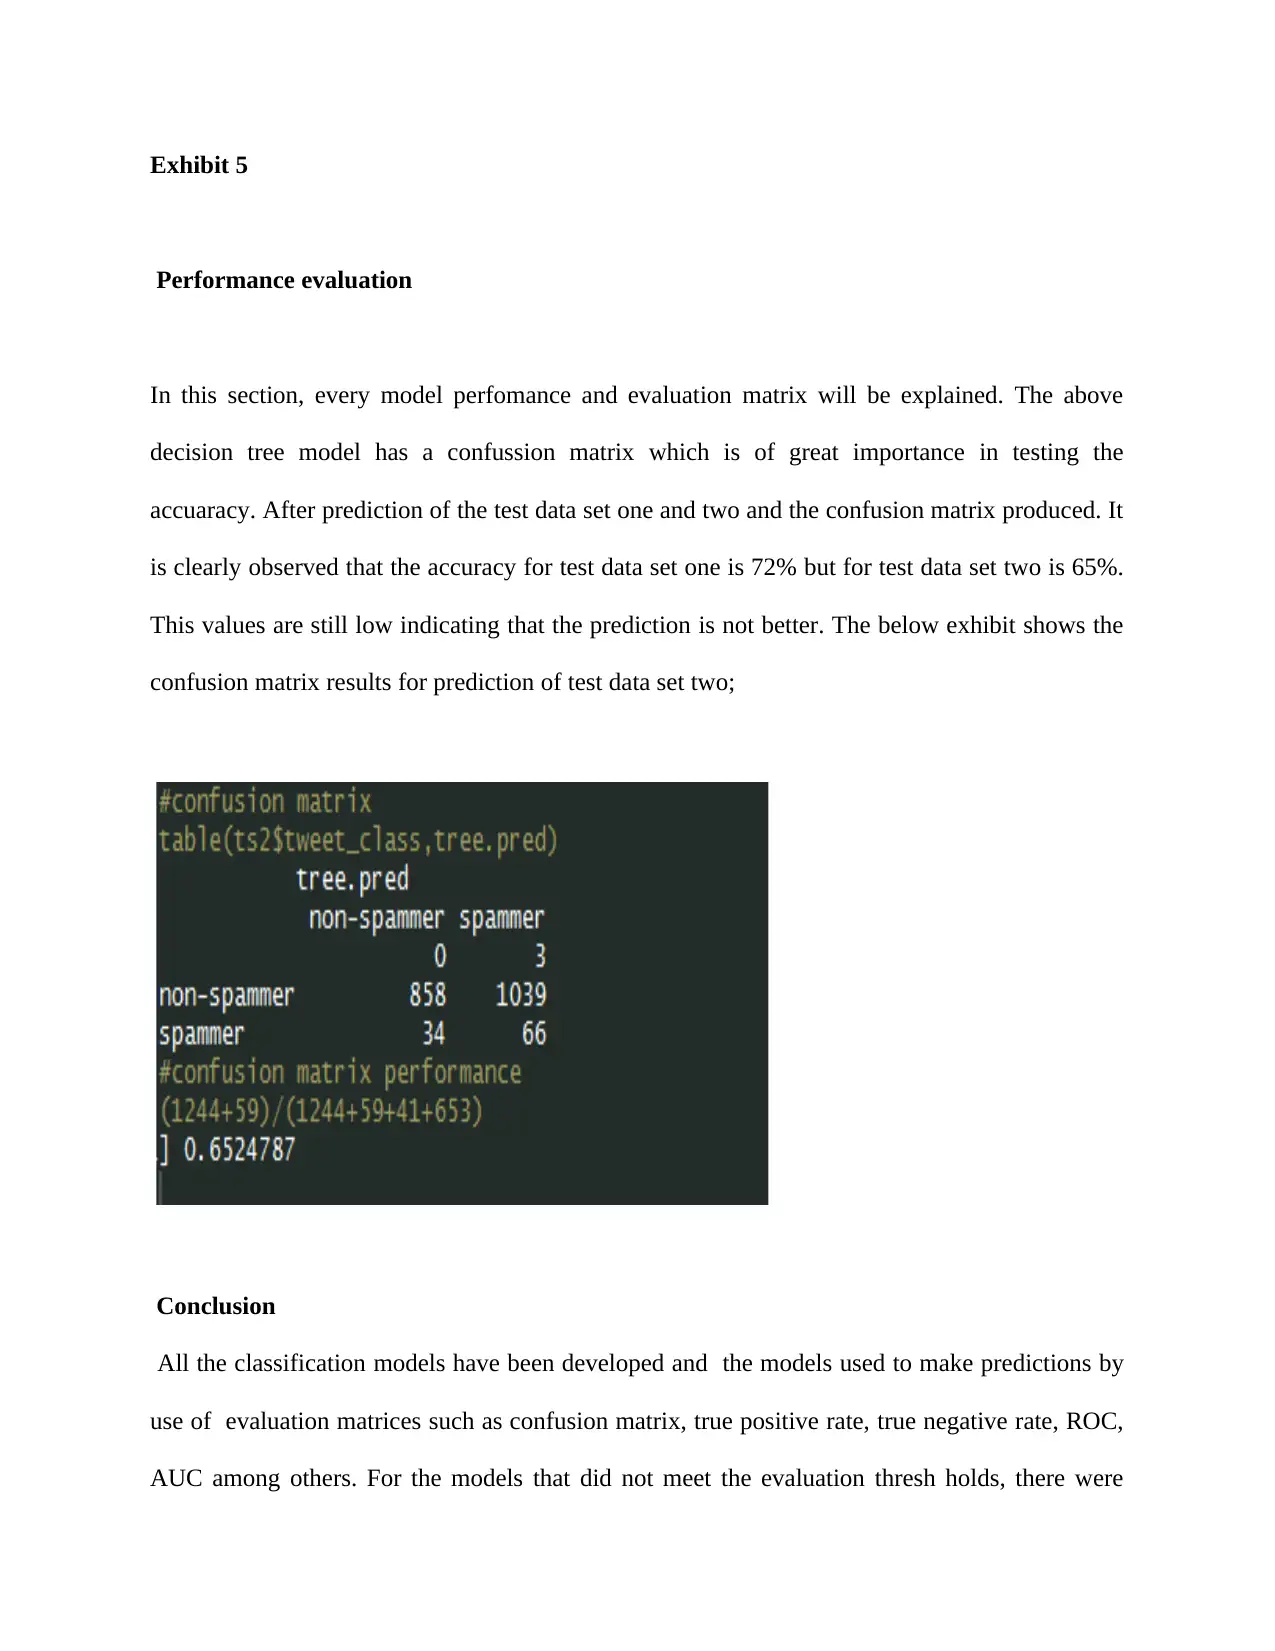
Exhibit 5
Performance evaluation
In this section, every model perfomance and evaluation matrix will be explained. The above
decision tree model has a confussion matrix which is of great importance in testing the
accuaracy. After prediction of the test data set one and two and the confusion matrix produced. It
is clearly observed that the accuracy for test data set one is 72% but for test data set two is 65%.
This values are still low indicating that the prediction is not better. The below exhibit shows the
confusion matrix results for prediction of test data set two;
Conclusion
All the classification models have been developed and the models used to make predictions by
use of evaluation matrices such as confusion matrix, true positive rate, true negative rate, ROC,
AUC among others. For the models that did not meet the evaluation thresh holds, there were
⊘ This is a preview!⊘
Do you want full access?
Subscribe today to unlock all pages.
Trusted by 1+ million students worldwide
respective measures that were taken to make sure that they met the performance threshold. Such
measures included pruning of decision trees, reducing classification trees in a random forest.
When pruning and reduction of trees or sample passed through a model is reduced, then the only
guarantee is that the model is bound to improve a great deal.
measures included pruning of decision trees, reducing classification trees in a random forest.
When pruning and reduction of trees or sample passed through a model is reduced, then the only
guarantee is that the model is bound to improve a great deal.
Paraphrase This Document
Need a fresh take? Get an instant paraphrase of this document with our AI Paraphraser

Bibliography
Karatay, D.U., Zhang, J., Harrison, J.S. and Ginger, D.S., 2016. Classifying force spectroscopy
of DNA pulling measurements using supervised and unsupervised machine learning methods.
Journal of chemical information and modeling, 56(4), pp.621-629.
Arora, Anshul, Sateesh K. Peddoju, Vikas Chouhan, and Ajay Chaudhary. "Poster: Hybrid
Android Malware Detection by Combining Supervised and Unsupervised Learning." In
Proceedings of the 24th Annual International Conference on Mobile Computing and Networking,
pp. 798-800. ACM, 2018.
Bowers, Alex J., and Xiaoliang Zhou. "Receiver operating characteristic (ROC) area under the
curve (AUC): A diagnostic measure for evaluating the accuracy of predictors of education
outcomes." Journal of Education for Students Placed at Risk (JESPAR) 24, no. 1 (2019): 20-46.
Zhang, Y., Lu, S., Zhou, X., Yang, M., Wu, L., Liu, B., Phillips, P. and Wang, S., 2016.
Comparison of machine learning methods for stationary wavelet entropy-based multiple sclerosis
detection: decision tree, k-nearest neighbors, and support vector machine. Simulation, 92(9),
pp.861-871.
Cordón, Ignacio, Salvador García, Alberto Fernández, and Francisco Herrera. "Imbalance:
oversampling algorithms for imbalanced classification in R." Knowledge-Based Systems 161
(2018): 329-341.
Dasari, Bobby VM, James Hodson, Robert P. Sutcliffe, Ravi Marudanayagam, Keith J. Roberts,
Manuel Abradelo, Paolo Muiesan, Darius F. Mirza, and John Isaac. "Developing and validating a
preoperative risk score to predict 90‐day mortality after liver resection." Journal of surgical
oncology 119, no. 4 (2019): 472-478.
Benvenuto, F., Piana, M., Campi, C. and Massone, A.M., 2018. A hybrid
supervised/unsupervised machine learning approach to solar flare prediction. The Astrophysical
Journal, 853(1), p.90.
Kumari, KR Vidya, and C. R. Kavitha. "Spam Detection Using Machine Learning in R." In
International Conference on Computer Networks and Communication Technologies, pp. 55-64.
Springer, Singapore, 2019.
Rodrigues, Mark A., Neshika Samarasekera, Christine Lerpiniere, Catherine Humphreys, Mark
O. McCarron, Philip M. White, James AR Nicoll et al. "The Edinburgh CT and genetic
diagnostic criteria for lobar intracerebral haemorrhage associated with cerebral amyloid
angiopathy: model development and diagnostic test accuracy study." The Lancet Neurology 17,
no. 3 (2018): 232-240.
Naghibi, S.A., Pourghasemi, H.R. and Dixon, B., 2016. GIS-based groundwater potential
mapping using boosted regression tree, classification and regression tree, and random forest
machine learning models in Iran. Environmental monitoring and assessment, 188(1), p.44.
⊘ This is a preview!⊘
Do you want full access?
Subscribe today to unlock all pages.
Trusted by 1+ million students worldwide
1 out of 13
Related Documents


Your All-in-One AI-Powered Toolkit for Academic Success.
+13062052269
info@desklib.com
Available 24*7 on WhatsApp / Email
![[object Object]](/_next/static/media/star-bottom.7253800d.svg)
Unlock your academic potential
Copyright © 2020–2026 A2Z Services. All Rights Reserved. Developed and managed by ZUCOL.