MN4063QA NOV21 Understanding and Managing Data: Detailed Report

Verified

Added on  2023/06/12

|17
|2169
|99
Report
AI Summary
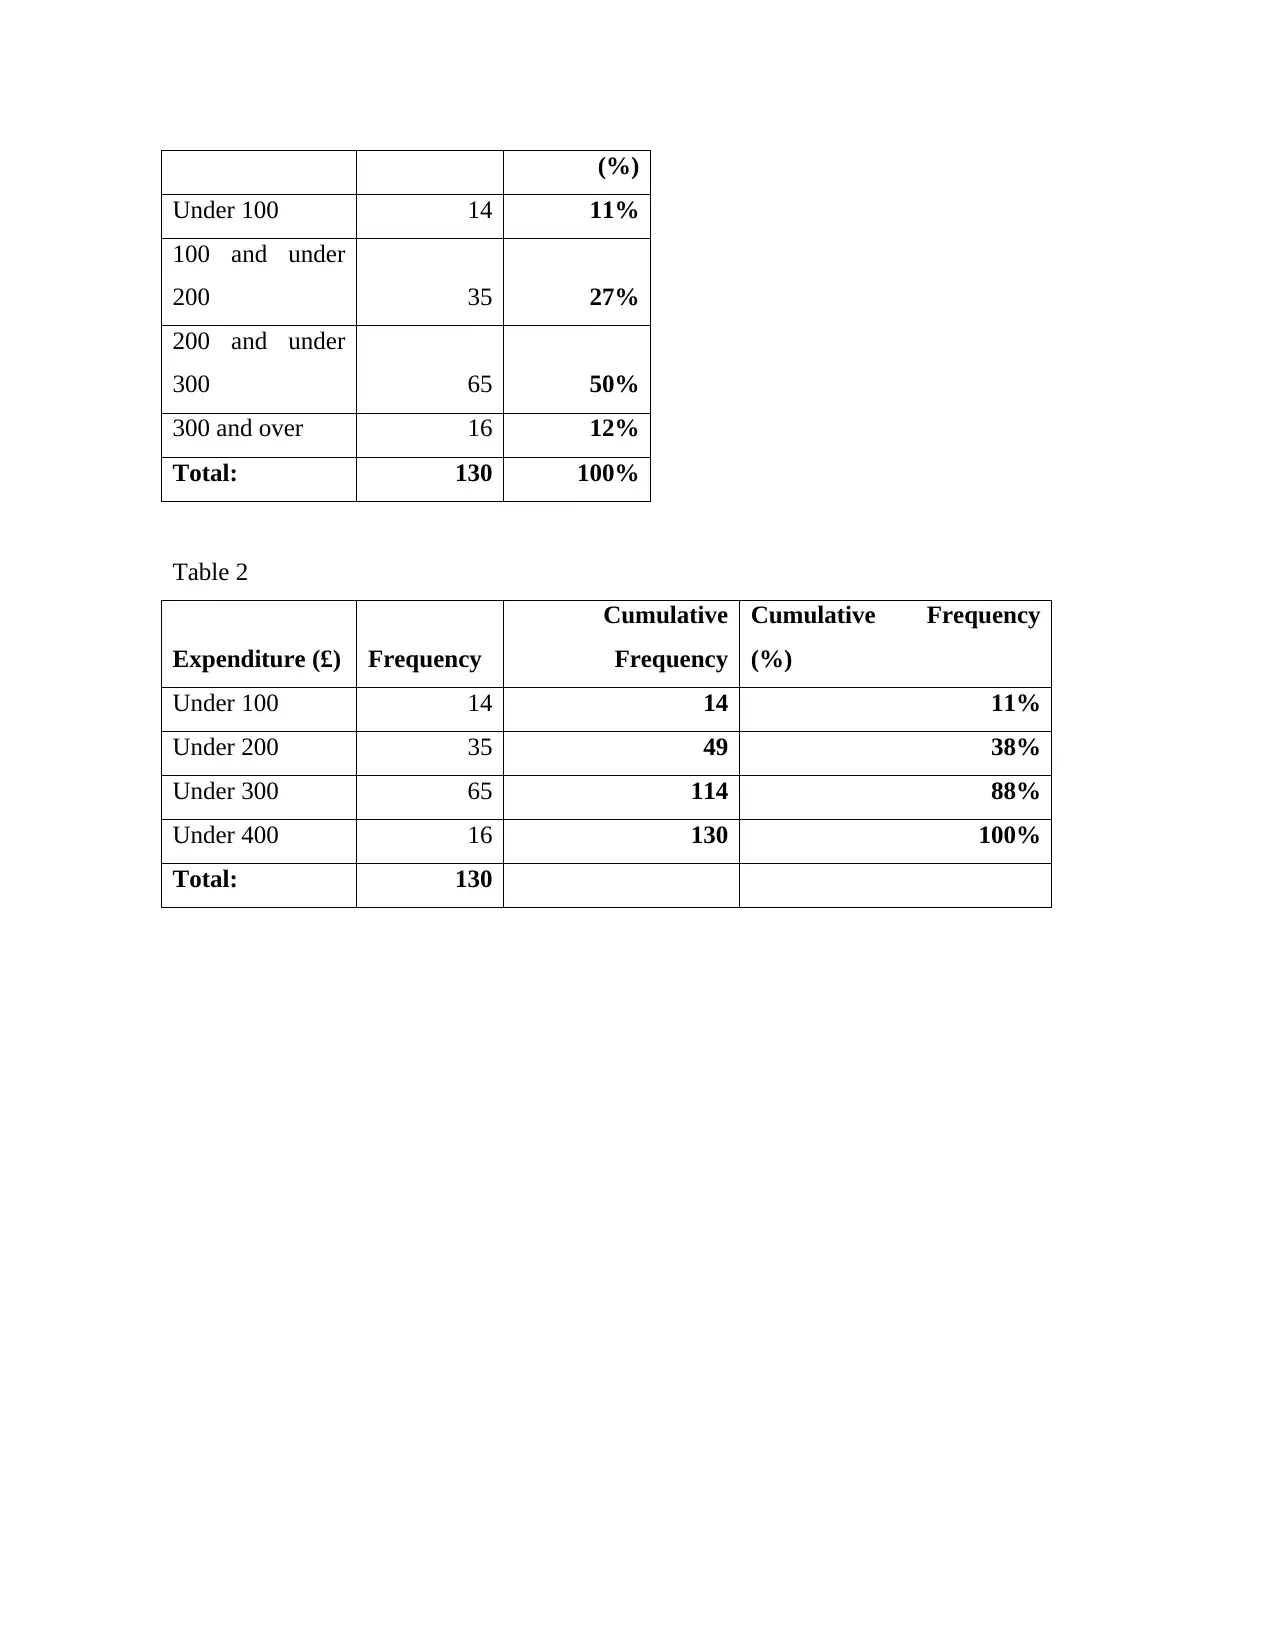
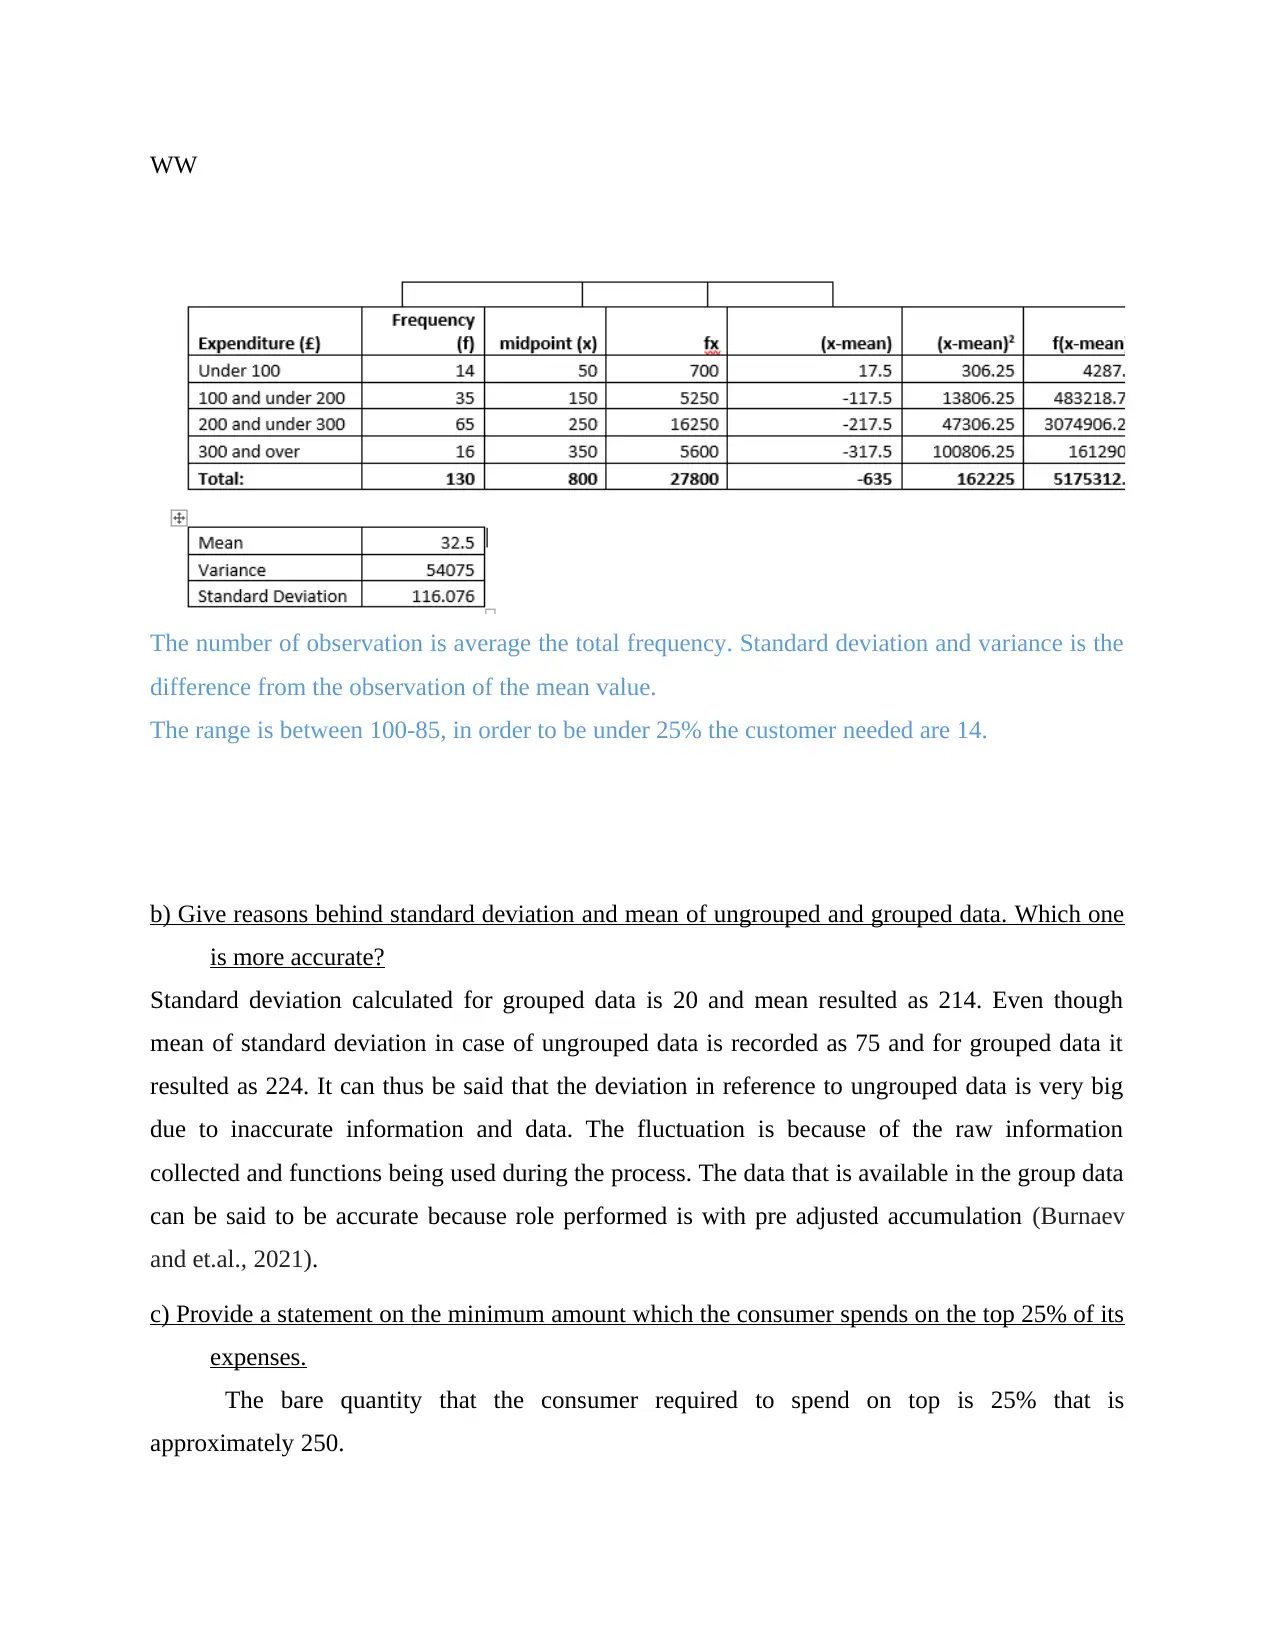
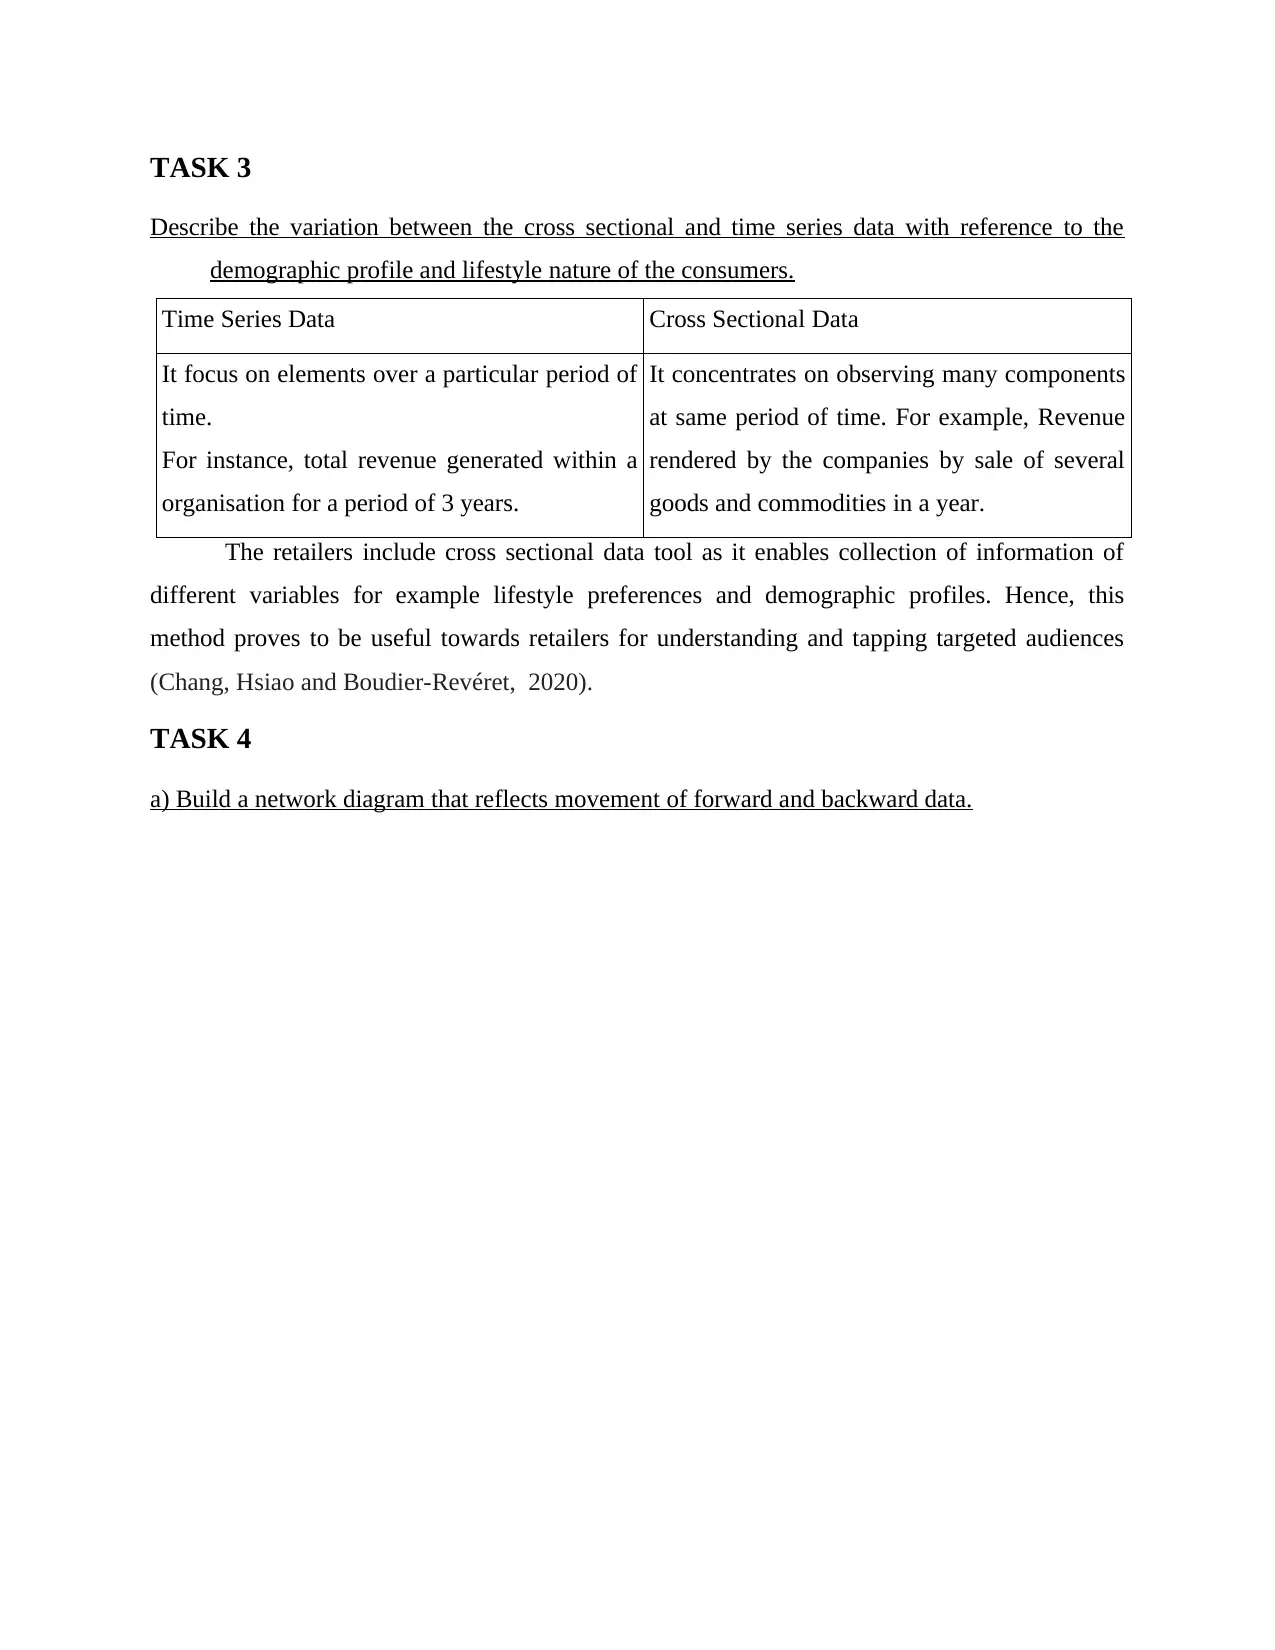
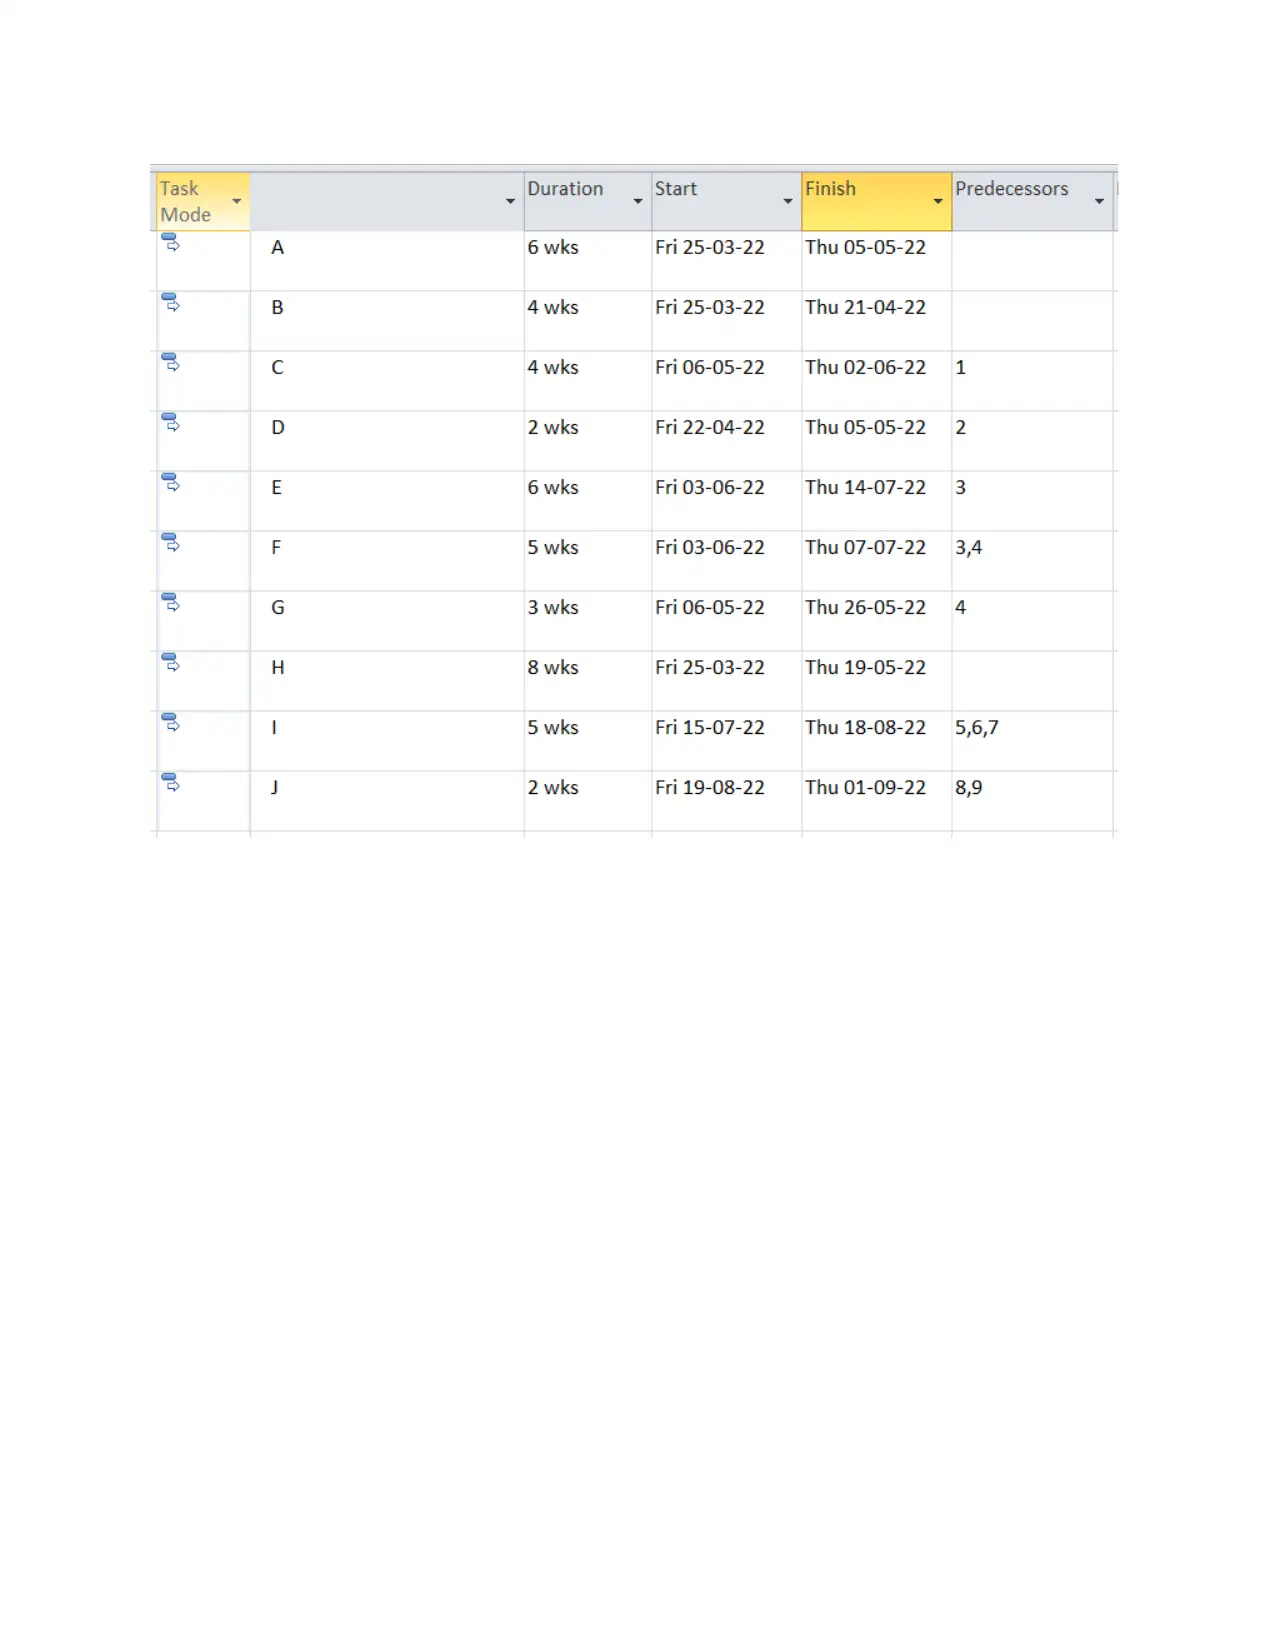
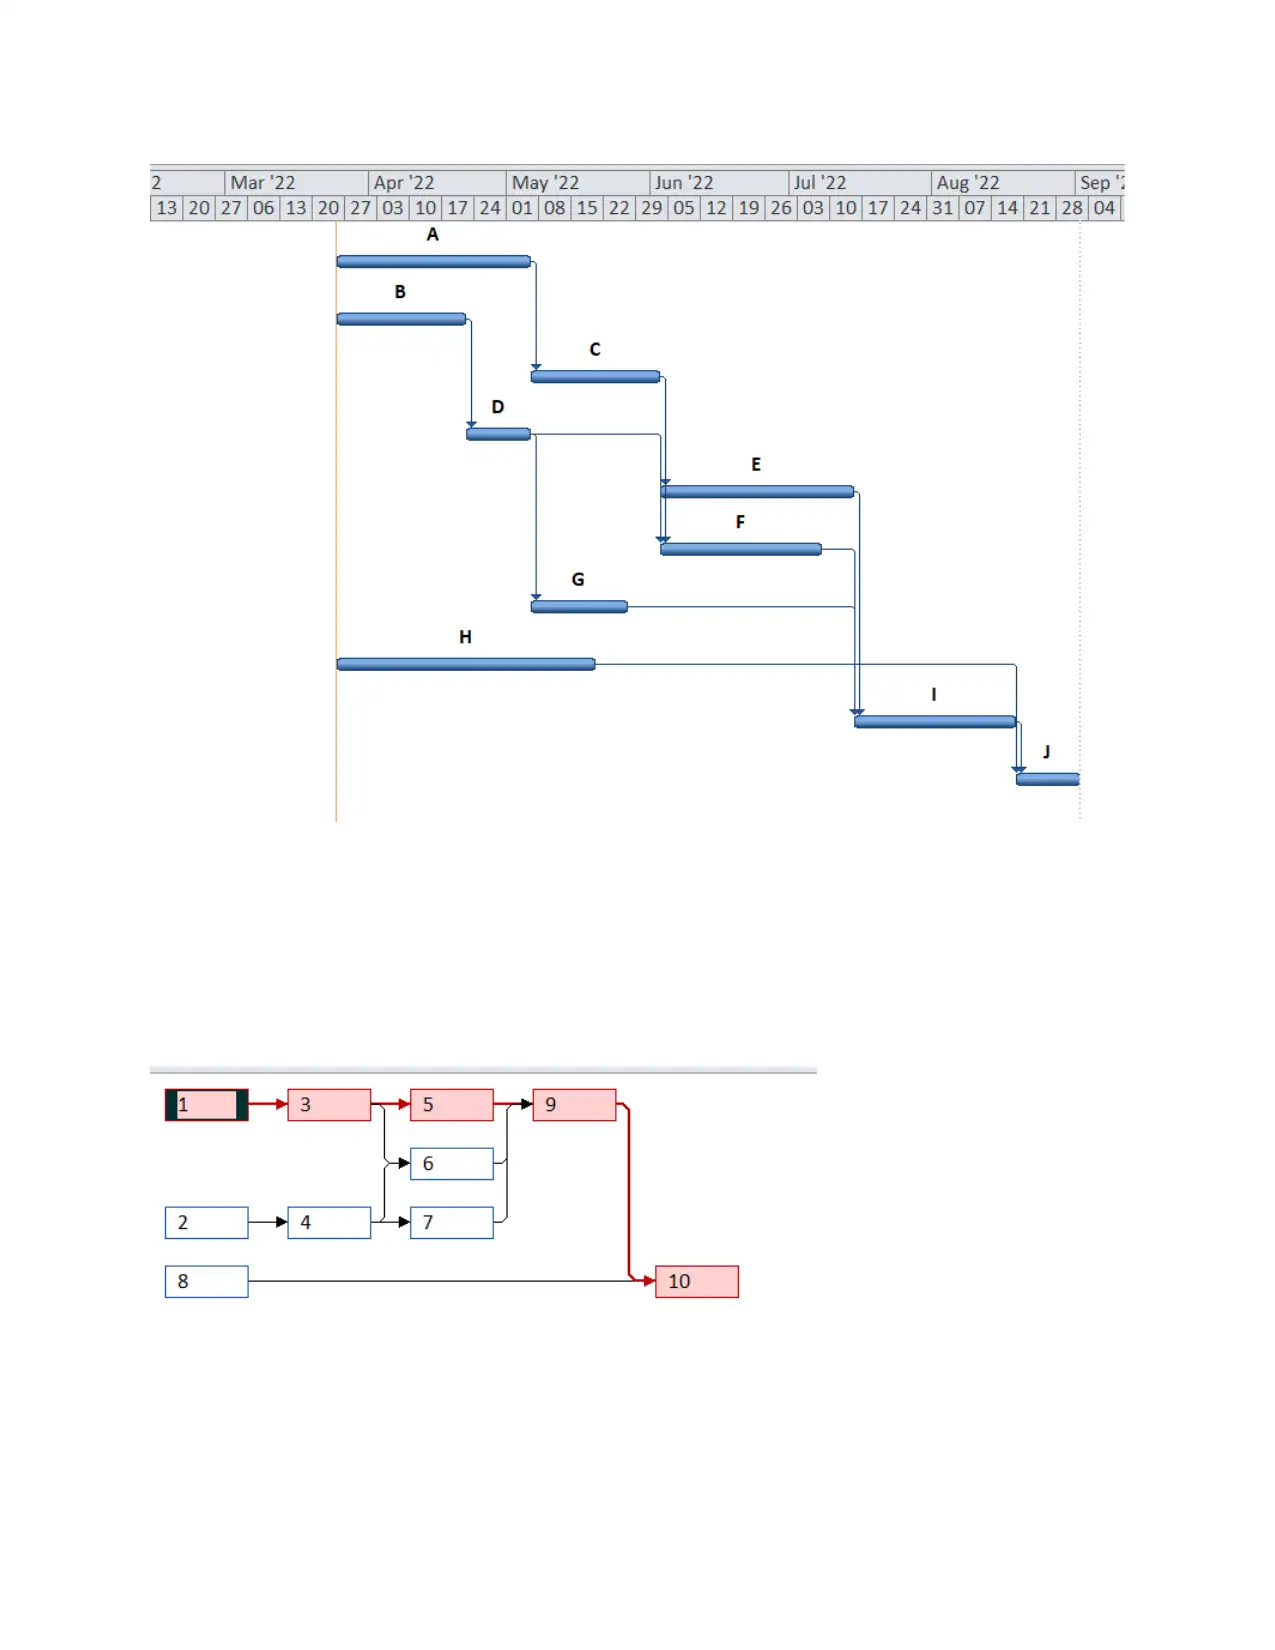
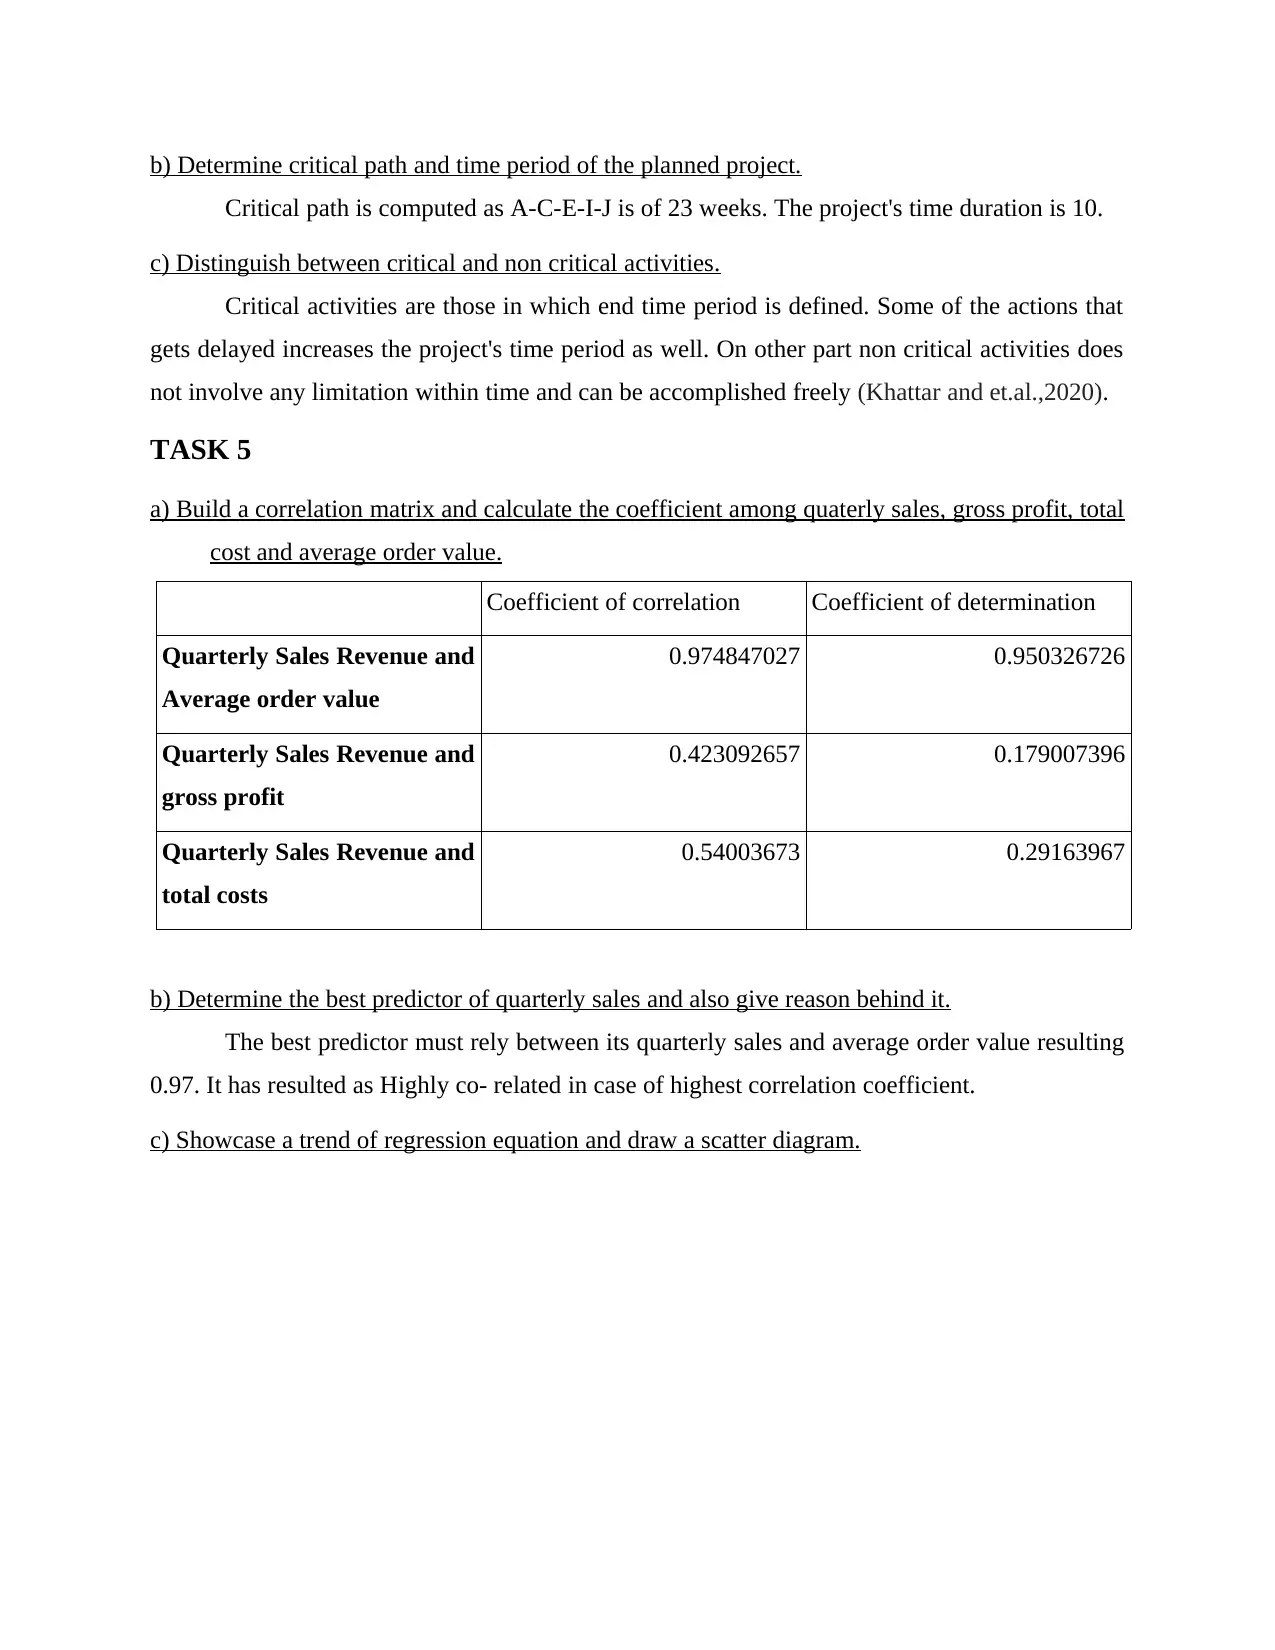
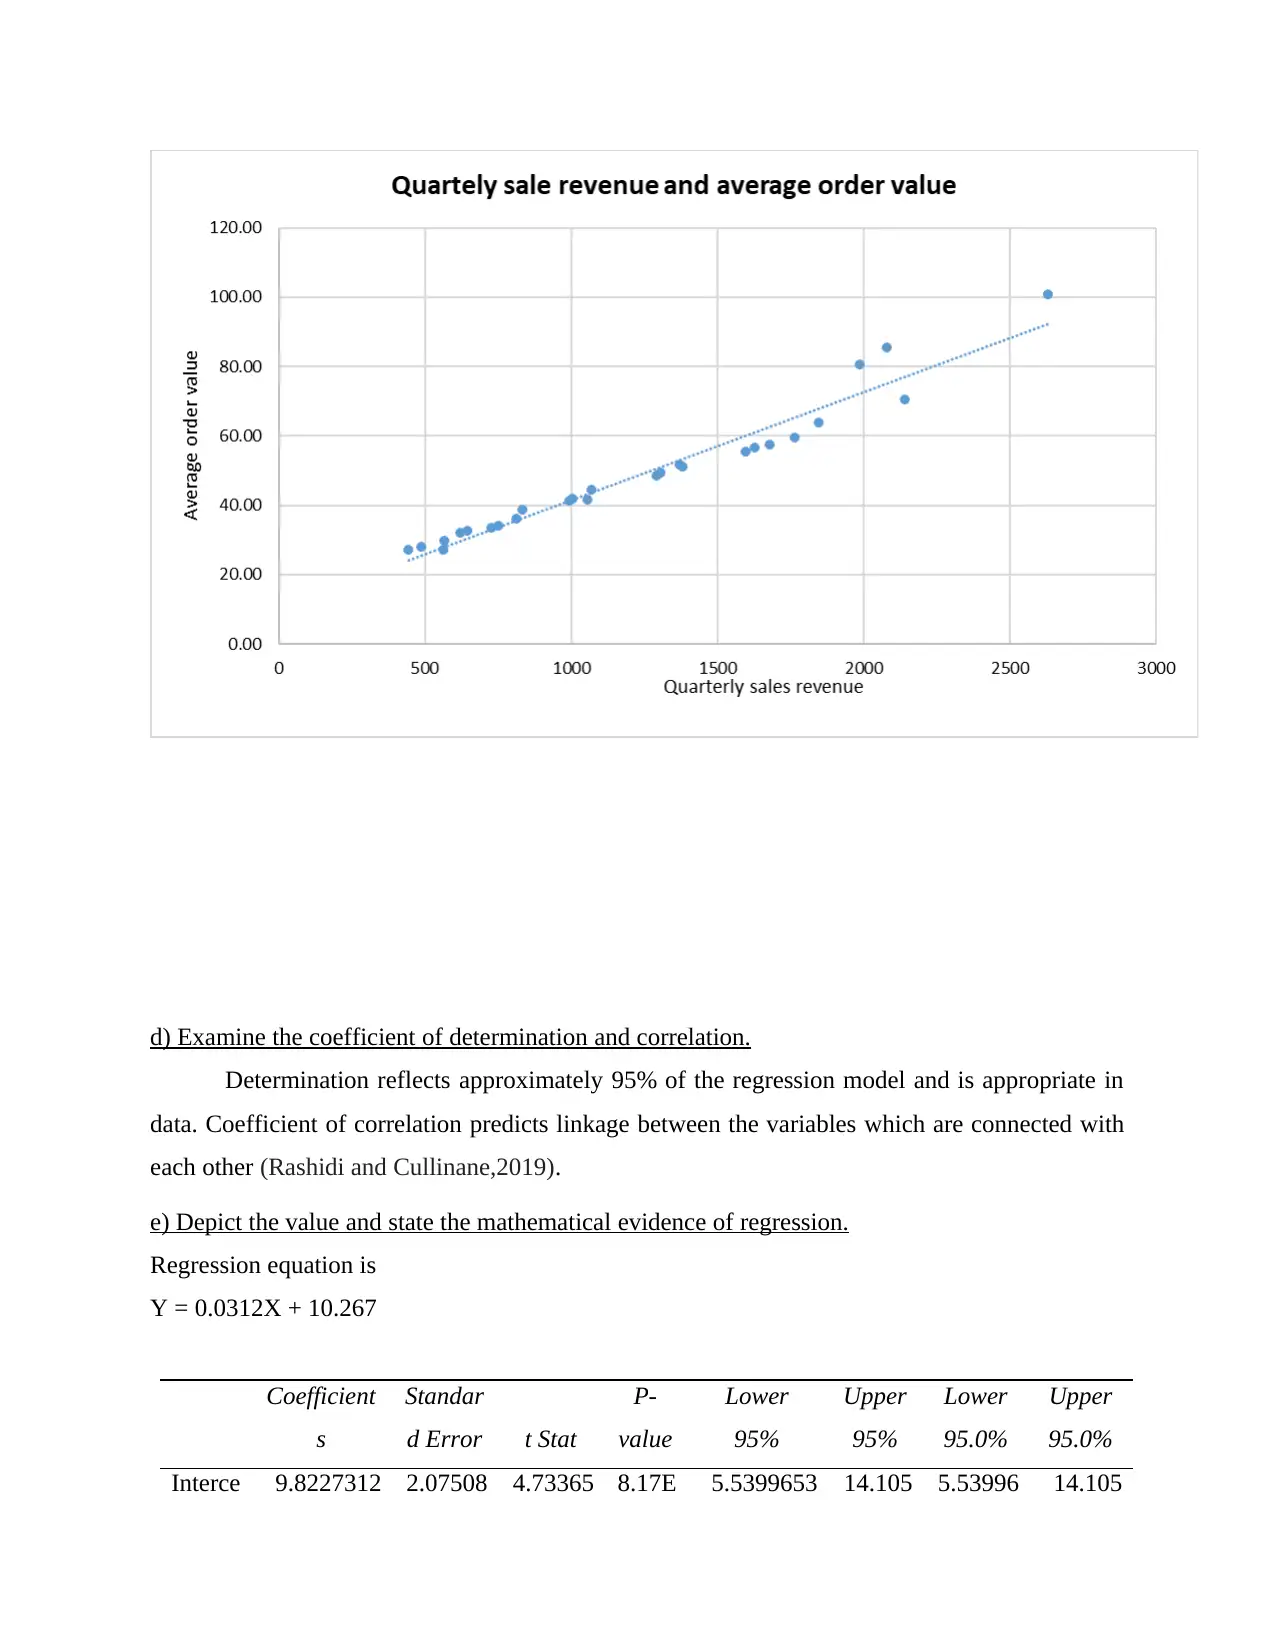
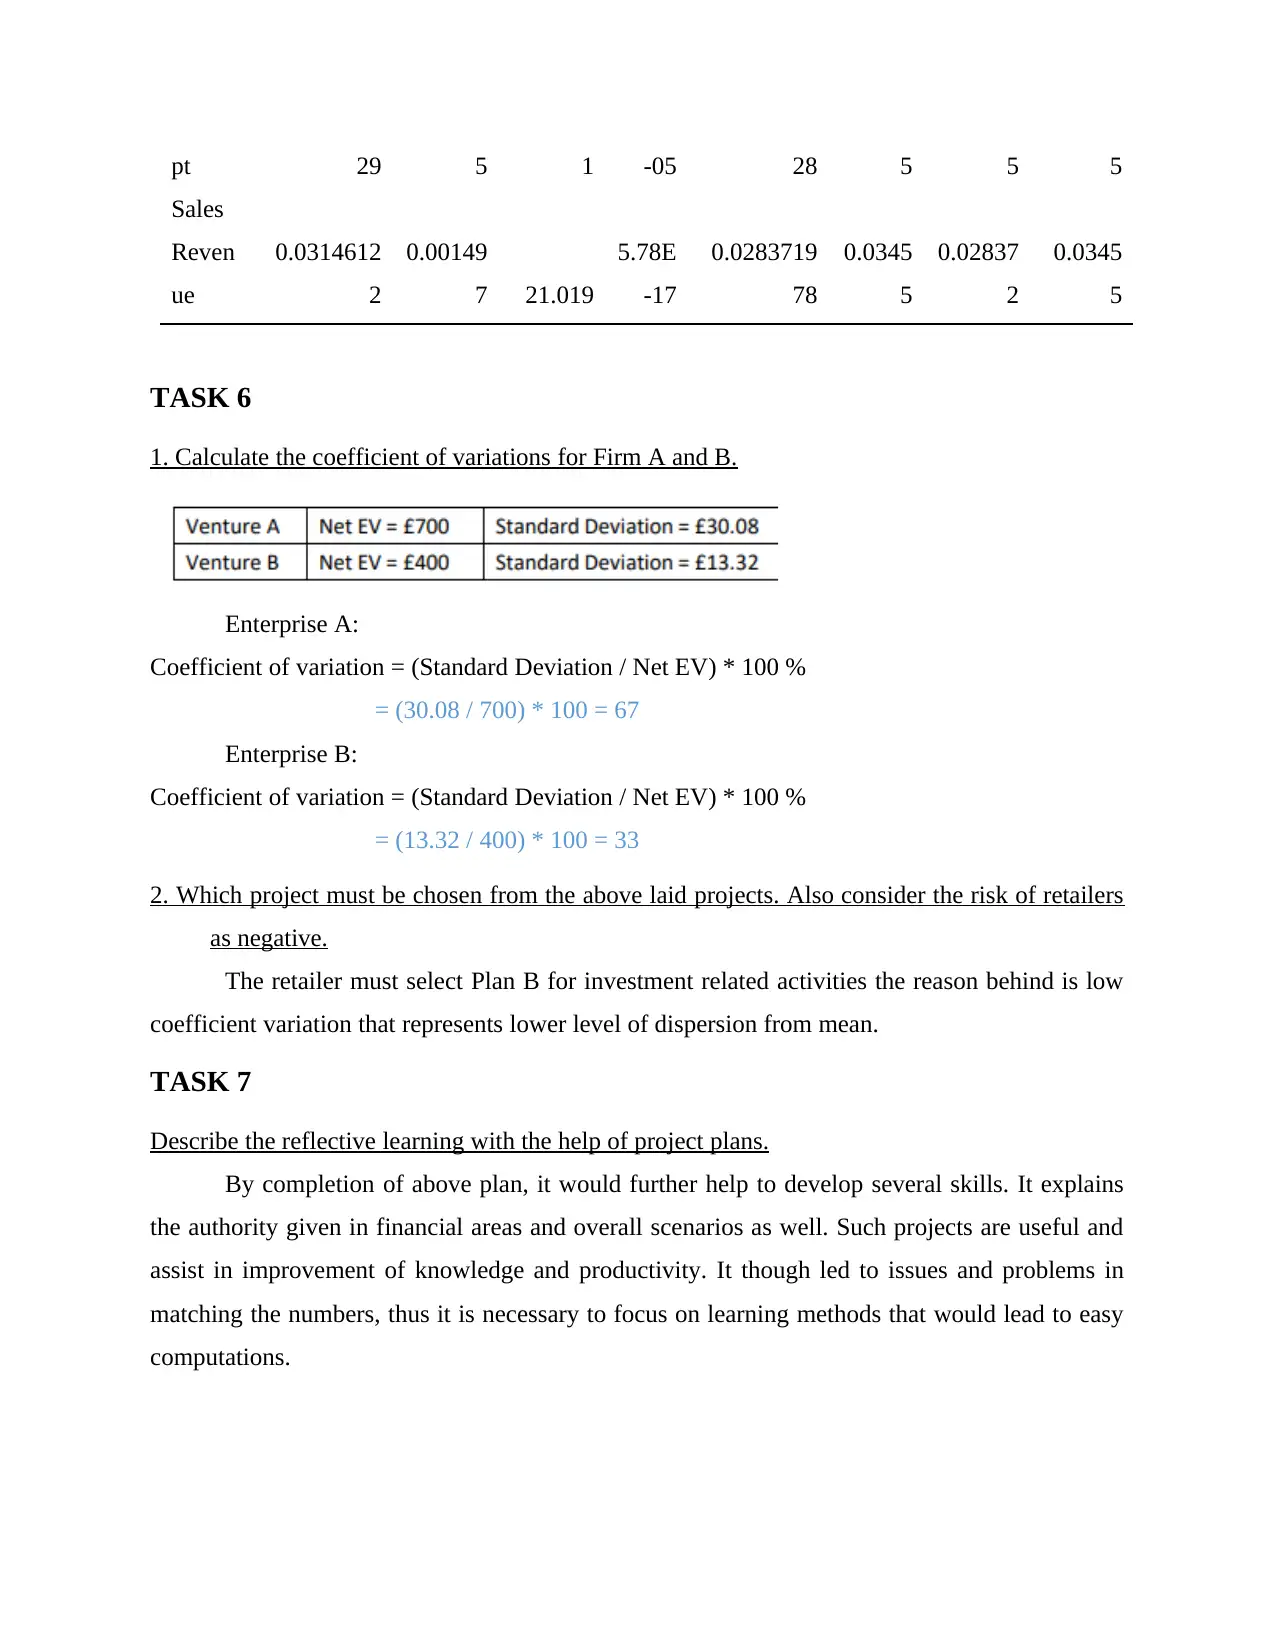
This report provides a comprehensive analysis of data using various statistical methods and tools. It includes calculations of sum, variance, mean, and standard deviation using Excel, along with interpretations of grouped and ungrouped data. The report also examines cross-sectional and time-series data, constructs a network diagram for project planning, and determines the critical path and time period. Furthermore, it builds a correlation matrix to analyze relationships between quarterly sales, gross profit, total cost, and average order value, and presents a regression equation with a scatter diagram. The coefficient of variation is calculated for different firms to inform investment decisions, considering risk factors. The report also includes a cost analysis using the high-low method to determine variable and fixed costs, break-even points, and margin of safety. The analysis culminates in reflective learning insights gained from the project plans.
Document Page
USING AND
MANAGING DATA
tabler-icon-diamond-filled.svg

Paraphrase This Document

Need a fresh take? Get an instant paraphrase of this document with our AI Paraphraser
Document Page
Table of Contents
PART 1............................................................................................................................................4
TASK 1............................................................................................................................................4
a) Calculate the sum and variance with the help of excel...........................................................4
b) Examine and interpret mean and standard deviation..............................................................4
TASK 2............................................................................................................................................4
a) Prepare table in excel and adjoin it in the report by considering the value given...................4
b) Give reasons behind standard deviation and mean of ungrouped and grouped data. Which
one is more accurate?..................................................................................................................5
c) Provide a statement on the minimum amount which the consumer spends on the top 25% of
its expenses..................................................................................................................................5
TASK 3............................................................................................................................................6
Describe the variation between the cross sectional and time series data with reference to the
demographic profile and lifestyle nature of the consumers........................................................6
TASK 4............................................................................................................................................7
a) Build a network diagram that reflects movement of forward and backward data..................7
b) Determine critical path and time period of the planned project.............................................9
c) Distinguish between critical and non critical activities..........................................................9
TASK 5............................................................................................................................................9
a) Build a correlation matrix and calculate the coefficient among quaterly sales, gross profit,
total cost and average order value...............................................................................................9
b) Determine the best predictor of quarterly sales and also give reason behind it......................9
c) Showcase a trend of regression equation and draw a scatter diagram....................................9
d) Examine the coefficient of determination and correlation....................................................10
e) Depict the value and state the mathematical evidence of regression....................................10
TASK 6..........................................................................................................................................11
1. Calculate the coefficient of variations for Firm A and B......................................................11
2. Which project must be chosen from the above laid projects. Also consider the risk of
retailers as negative...................................................................................................................11
TASK 7..........................................................................................................................................11
Document Page
Describe the reflective learning with the help of project plans.................................................11
PART 2..........................................................................................................................................11
1. Figure out the cost related to variables with the help of high low method...........................11
b) Calculate monthly fixed expenditure....................................................................................12
c) Calculate break even for the month of January.....................................................................12
d) Number of T – Shirt which must be sold in order of achieving set targets..........................12
e) Calculate margin of safety....................................................................................................12
6. Examine the above carried out calculation...........................................................................12
REFERENCES..............................................................................................................................13
Document Page
PART 1
TASK 1
a) Calculate the sum and variance with the help of excel.
It is considered as normal ones, if
mean, mode and median are same. It
refers there is an equality both side. It
is included as normal truly
distribution. In the observation table,
the data appears at equal frequency.
There is deviation between the values
and mean by 75 if the standard
deviation implies.
b) Examine and interpret mean and
standard deviation.and standard
deviation
The data collected above explains
that the standard deviation is 75 and
central average of the data is 224.
Standard deviation defines the variation of the measure from the mean. In case being followed it
is observed to be fluctuating at a higher scale in respect of mean (Agah and et.al., 2021). The
standard deviation comes from the calculation. In the given question mean is 224
TASK 2
a) Prepare table in excel and adjoin it in the report by considering the value given.
Table 1
Expenditure (£) Frequency Frequency
Expenditure (£) on
Stand Mixers
Average 224.00
Error of standard 6.58
Standmixer median 224.00
Highest frequency 224.00
Deviation standard 75.00
Variance of simple 5625.00
Kurtosis -0.49
Skewness -0.32
Range 301.00
Minimum 68.00
Maximum 369.00
Sum 29120.00
Count 130.00
Coefficient of Variation 33.5%
tabler-icon-diamond-filled.svg

Paraphrase This Document

Need a fresh take? Get an instant paraphrase of this document with our AI Paraphraser
Document Page
(%)
Under 100 14 11%
100 and under
200 35 27%
200 and under
300 65 50%
300 and over 16 12%
Total: 130 100%
Table 2
Expenditure (£) Frequency
Cumulative
Frequency
Cumulative Frequency
(%)
Under 100 14 14 11%
Under 200 35 49 38%
Under 300 65 114 88%
Under 400 16 130 100%
Total: 130
Document Page
WW
The number of observation is average the total frequency. Standard deviation and variance is the
difference from the observation of the mean value.
The range is between 100-85, in order to be under 25% the customer needed are 14.
b) Give reasons behind standard deviation and mean of ungrouped and grouped data. Which one
is more accurate?
Standard deviation calculated for grouped data is 20 and mean resulted as 214. Even though
mean of standard deviation in case of ungrouped data is recorded as 75 and for grouped data it
resulted as 224. It can thus be said that the deviation in reference to ungrouped data is very big
due to inaccurate information and data. The fluctuation is because of the raw information
collected and functions being used during the process. The data that is available in the group data
can be said to be accurate because role performed is with pre adjusted accumulation (Burnaev
and et.al., 2021).
c) Provide a statement on the minimum amount which the consumer spends on the top 25% of its
expenses.
The bare quantity that the consumer required to spend on top is 25% that is
approximately 250.
Document Page
TASK 3
Describe the variation between the cross sectional and time series data with reference to the
demographic profile and lifestyle nature of the consumers.
Time Series Data Cross Sectional Data
It focus on elements over a particular period of
time.
For instance, total revenue generated within a
organisation for a period of 3 years.
It concentrates on observing many components
at same period of time. For example, Revenue
rendered by the companies by sale of several
goods and commodities in a year.
The retailers include cross sectional data tool as it enables collection of information of
different variables for example lifestyle preferences and demographic profiles. Hence, this
method proves to be useful towards retailers for understanding and tapping targeted audiences
(Chang, Hsiao and Boudier-Revéret, 2020).
TASK 4
a) Build a network diagram that reflects movement of forward and backward data.
tabler-icon-diamond-filled.svg

Paraphrase This Document

Need a fresh take? Get an instant paraphrase of this document with our AI Paraphraser
Document Page
Document Page
Document Page
b) Determine critical path and time period of the planned project.
Critical path is computed as A-C-E-I-J is of 23 weeks. The project's time duration is 10.
c) Distinguish between critical and non critical activities.
Critical activities are those in which end time period is defined. Some of the actions that
gets delayed increases the project's time period as well. On other part non critical activities does
not involve any limitation within time and can be accomplished freely (Khattar and et.al.,2020).
TASK 5
a) Build a correlation matrix and calculate the coefficient among quaterly sales, gross profit, total
cost and average order value.
Coefficient of correlation Coefficient of determination
Quarterly Sales Revenue and
Average order value
0.974847027 0.950326726
Quarterly Sales Revenue and
gross profit
0.423092657 0.179007396
Quarterly Sales Revenue and
total costs
0.54003673 0.29163967
b) Determine the best predictor of quarterly sales and also give reason behind it.
The best predictor must rely between its quarterly sales and average order value resulting
0.97. It has resulted as Highly co- related in case of highest correlation coefficient.
c) Showcase a trend of regression equation and draw a scatter diagram.
tabler-icon-diamond-filled.svg

Paraphrase This Document

Need a fresh take? Get an instant paraphrase of this document with our AI Paraphraser
Document Page
d) Examine the coefficient of determination and correlation.
Determination reflects approximately 95% of the regression model and is appropriate in
data. Coefficient of correlation predicts linkage between the variables which are connected with
each other (Rashidi and Cullinane,2019).
e) Depict the value and state the mathematical evidence of regression.
Regression equation is
Y = 0.0312X + 10.267
Coefficient
s
Standar
d Error t Stat
P-
value
Lower
95%
Upper
95%
Lower
95.0%
Upper
95.0%
Interce 9.8227312 2.07508 4.73365 8.17E 5.5399653 14.105 5.53996 14.105
Document Page
pt 29 5 1 -05 28 5 5 5
Sales
Reven
ue
0.0314612
2
0.00149
7 21.019
5.78E
-17
0.0283719
78
0.0345
5
0.02837
2
0.0345
5
TASK 6
1. Calculate the coefficient of variations for Firm A and B.
Enterprise A:
Coefficient of variation = (Standard Deviation / Net EV) * 100 %
= (30.08 / 700) * 100 = 67
Enterprise B:
Coefficient of variation = (Standard Deviation / Net EV) * 100 %
= (13.32 / 400) * 100 = 33
2. Which project must be chosen from the above laid projects. Also consider the risk of retailers
as negative.
The retailer must select Plan B for investment related activities the reason behind is low
coefficient variation that represents lower level of dispersion from mean.
TASK 7
Describe the reflective learning with the help of project plans.
By completion of above plan, it would further help to develop several skills. It explains
the authority given in financial areas and overall scenarios as well. Such projects are useful and
assist in improvement of knowledge and productivity. It though led to issues and problems in
matching the numbers, thus it is necessary to focus on learning methods that would lead to easy
computations.
chevron_up_icon
1 out of 17
circle_padding
hide_on_mobile
zoom_out_icon
[object Object]