Network Application Manager Report: ManageEngine OpManager Analysis
VerifiedAdded on 2023/01/19
|11
|2442
|52
Report
AI Summary
This report, submitted as part of the MN504 Networked Application Management course, provides a comprehensive analysis of network application management, with a specific focus on ManageEngine OpManager. The report begins by defining OpManager and its role in enterprise network management, highlighting its features and functionalities. It then delves into network performance management, discussing the importance of monitoring, scope, and limitations of OpManager. The core of the report examines how OpManager provides real-time availability monitoring and network traffic analysis. A significant portion of the report compares OpManager with SolarWinds, detailing similarities in auto-discovery and visualization, and differences in bandwidth monitoring and operating system compatibility. The conclusion emphasizes the importance of network monitoring and the selection of the appropriate application. The report includes references to relevant literature supporting the analysis.

NETWORK APPLICATION MANAGER
[Student Name]
[Professor’s Name]
[Affiliation]
[Student Name]
[Professor’s Name]
[Affiliation]
Paraphrase This Document
Need a fresh take? Get an instant paraphrase of this document with our AI Paraphraser

Index
B
bandwidth, 6
E
examinations, 8
M
ManageEngine, 3, 4, 5, 6, 7, 8, 9
Monitoring, 4, 7, 8
N
network, 3, 4, 6, 8, 9, 10
O
OpManager, 3, 4, 5, 6, 7, 8, 9
S
SolarWinds, 6, 7, 8
SQL, 3
B
bandwidth, 6
E
examinations, 8
M
ManageEngine, 3, 4, 5, 6, 7, 8, 9
Monitoring, 4, 7, 8
N
network, 3, 4, 6, 8, 9, 10
O
OpManager, 3, 4, 5, 6, 7, 8, 9
S
SolarWinds, 6, 7, 8
SQL, 3
INTRODUCTION
ManageEngine OpManager is defined as the end to end multi-vendor IT networks enterprise and
heterogeneous software for network management. The ManageEngine OpManager offers a more
combined methodology to manage and to scale IT structure which is distributed, and more advanced
performance and fault management features in all the perilous information technology resources. The
resources in this case includes the following; domain controllers, servers, MS exchange, WAN, network
devices, Voice over network Links, SQL and many other information technology infrastructures. In terms
of popularity which comes with usage, the ManageEngine's OpManager software is used widely as the
most perfect software for network monitoring since it is rich in features and functionalities [1]. The
Enterprise edition of ManageEngine's OpManager is highly suited and perfect in the monitoring tasks of
the networks which are distributed. The application manager of ManageEngine's OpManager gives a
more critical java virtual machine metric data which is very important in tracking the ManageEngine's
OpManager performance. This makes it easy to for the metric monitoring as well as decision making
especially when it comes to everything related to scaling the capacity of the application.
PART 1
Network Performance management
The backborne of any information technology infrastructure based institution are formed by the
networking and computerization. Since most of the businesses depend so much on the applications
which are based on the internet, this is mainly because the user of the system ends up being safe even if
the issues which are related to network persists [2]. The process of improving and monitoring the
performance of the network is very much essential for the core purpose of maintaining the stability of
the business each and every time. For doing this, it will make sure that the service level agreement are
well maintained and the delivery of business services are smooth and swift.
Contribution
ManageEngine OpManager fundamentally revolves around structure of management, yet likewise gives
IT generalists some extraordinary application execution of the board and then framework alongside
checking features. The product has an IP address which makes the board ability feasible for the
assignment of enough assets to the system gadgets [3].
Scope
⊘ This is a preview!⊘
Do you want full access?
Subscribe today to unlock all pages.
Trusted by 1+ million students worldwide
The ManageEngine's OpManager software has made it easy to do monitoring of the health vale of all the
devices which uses the network., getting visibility in the traffic patterns of the network, automatic the
change on network and its overall management of configuration, diagnostic and analyzing the Wide area
network issues as well as monitoring and diagnosing the performance of the VoIP [4].
Limitation
The following are the limitation of the OpManager software in network performance management.
i. Data migration for third parties are not offered by the software.
ii. As compared to the current graphical user interface of the software, its clear and notable
that the previous interface was more interactive and very easy to use.
iii. Most of the hardware of are not supported outside the box though the report might be
created in support of the same.
iv. The lack of some MBIs in the software makes it hard for the creation of specialized alerts.
Why OpManager is perfect fit for network monitoring
The OpManager is considered as the most suitable in network performance management and
monitoring since it offers a more real time monitoring of network solutions and has the most best
features which makes it possible to the IT based infrastructure and admin to solve the network
damages and outages issues as quick as possible and restore the network [5]. The OpManager usage has
made It very easy to perfoma the following tasks easily;
a. Monitoring the networks devices health
b. Getting best sight to the traffic of network patterns.
c. Diagnosis of the WAN network issues
d. The configuration management and network change is automated.
e. Diagnosis and monitoring of the performance of VOIP.
Paraphrase This Document
Need a fresh take? Get an instant paraphrase of this document with our AI Paraphraser
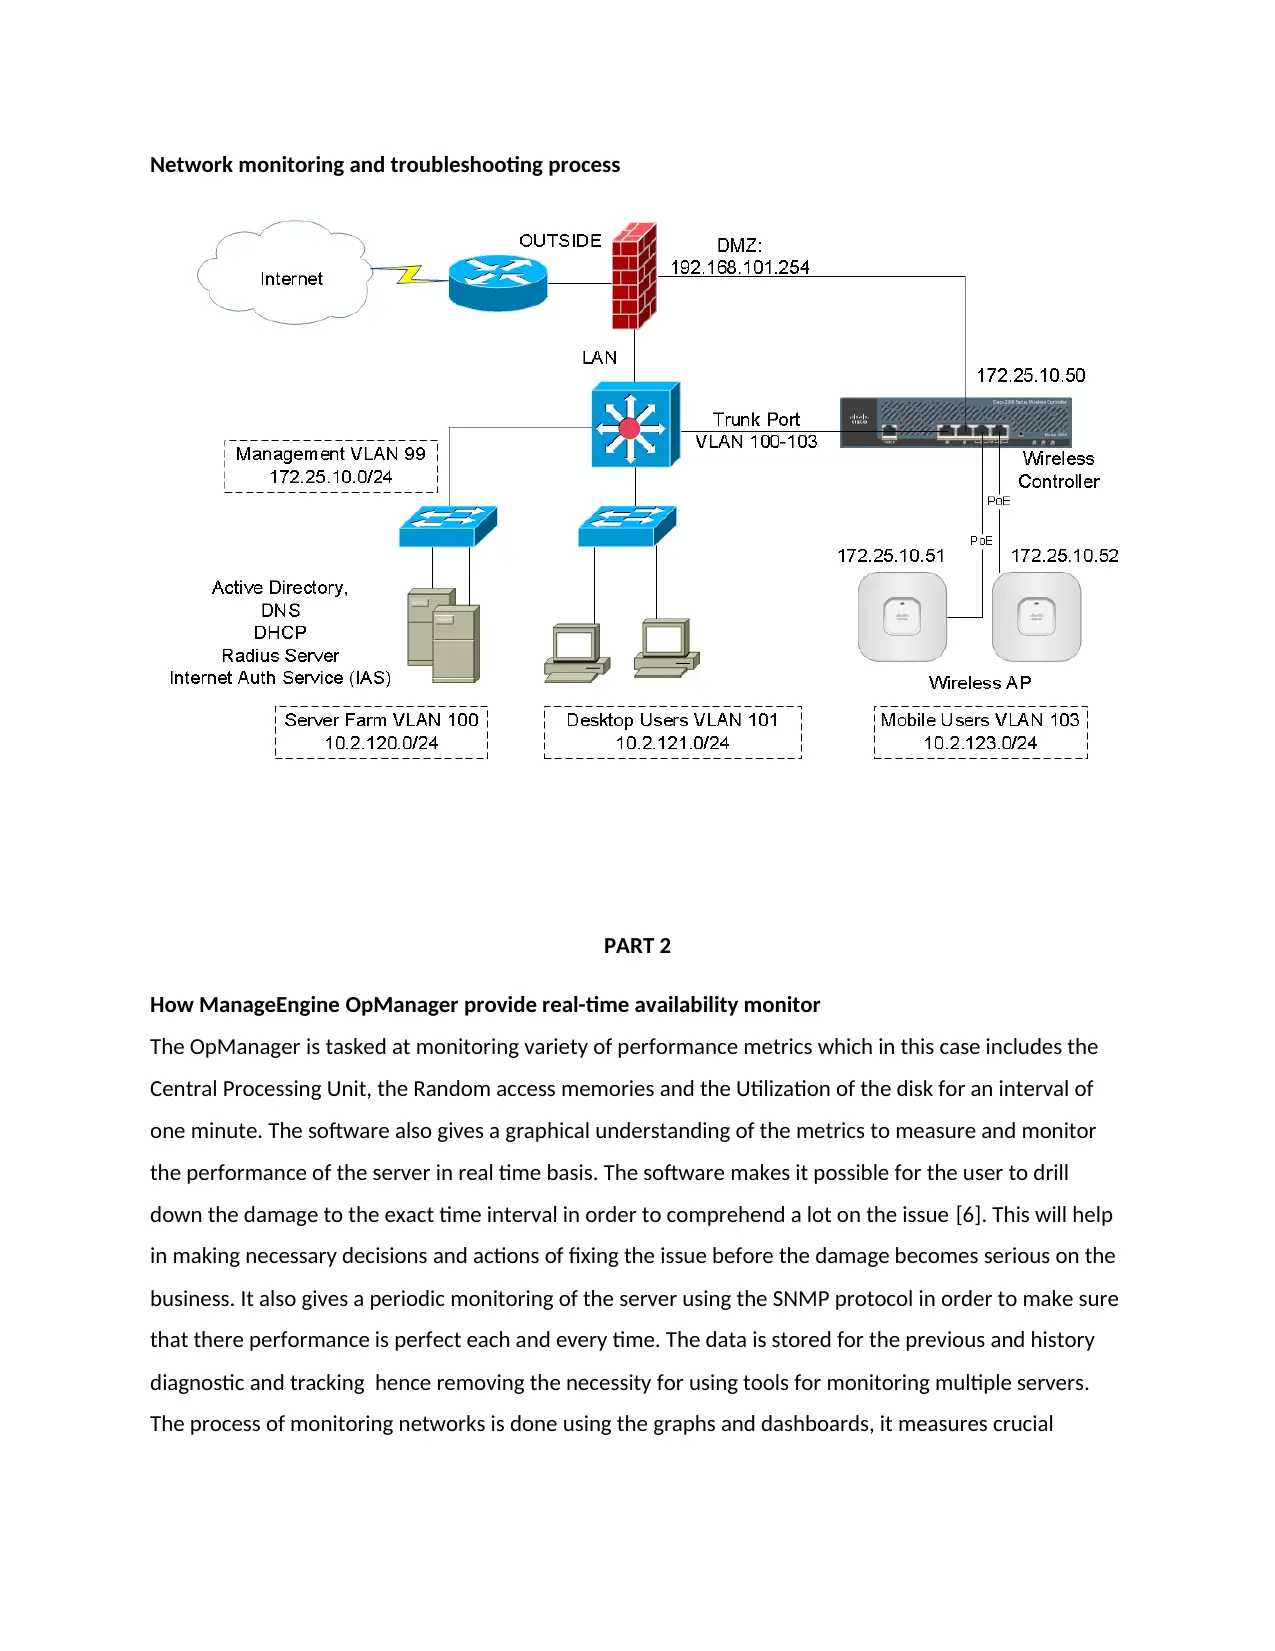
Network monitoring and troubleshooting process
PART 2
How ManageEngine OpManager provide real-time availability monitor
The OpManager is tasked at monitoring variety of performance metrics which in this case includes the
Central Processing Unit, the Random access memories and the Utilization of the disk for an interval of
one minute. The software also gives a graphical understanding of the metrics to measure and monitor
the performance of the server in real time basis. The software makes it possible for the user to drill
down the damage to the exact time interval in order to comprehend a lot on the issue [6]. This will help
in making necessary decisions and actions of fixing the issue before the damage becomes serious on the
business. It also gives a periodic monitoring of the server using the SNMP protocol in order to make sure
that there performance is perfect each and every time. The data is stored for the previous and history
diagnostic and tracking hence removing the necessity for using tools for monitoring multiple servers.
The process of monitoring networks is done using the graphs and dashboards, it measures crucial
metrics including the loss of packets, discards and the errors. The real time graphs sends real time
statistics to the administrator on the CPU of the device [7].
How ManageEngine OpManager perform Network traffic analysis
OpManager to perform the analysis of traffic in the network, it gives permission in identifying the hogs
of the bandwidth for the user to optimize the traffic of the network before it damages the network. The
software takes control of the performance monitoring of the network by checking the performance of
the bandwidth of the network and the pattern of the traffic using the OpManager Simple Network
Management protocol, this makes it possible for the user to monitor the traffic of the device [8]. The
traffic of the interface can be viewed, the interval of the traffic can be filtered by the interval and the
last value of the traffic can also be polled. One of the features in the OpManager software, the NetFlow
feature gives in depth perceptibility of the traffic patterns of the network and the utilization of the
bandwidth.
PART 3
There are many network management software around the world though OpManager is perceived as
the best option for most of business solution due to its rich features which are very favorable to the
users. Some software like SolarWinds also performs the same functionalities though with slight
difference in the features. The comparison between OpManager and the SolarWinds is as below.
Similarity between OpManager and SolarWinds Network performance monitors
Autodiscovery
The auto discovery feature is found in both the OpManager and the SolarWinds network monitors. The
SolarWinds permits the user to pass over the many tiresome processes by the use of the auto discovery
feature. The same is done on the OpManager monitoring tool/ the both automatically discovers the
devices which are connected on the network and goes ahead to configure them. The SNMP pooling is
essential in this process as it poll each device and log the data which has been received. ManageEngine
OpManager also uses the SNMP to make discovery to the variety of devices. The software also uses
telnet, WMI, and ICMP [9].
⊘ This is a preview!⊘
Do you want full access?
Subscribe today to unlock all pages.
Trusted by 1+ million students worldwide

Paraphrase This Document
Need a fresh take? Get an instant paraphrase of this document with our AI Paraphraser
Visualization
In the event that virtualization is poor and showcases are jumbled, befuddling, or restricted at that point
you're not going to have the capacity to perceive the developing patterns. Luckily, SolarWinds Network
Performance Monitor and ManageEngine OpManager are two items that don't slack around there.
SolarWinds Network Performance Monitor has a wide scope of perception highlights including diagrams,
outlines, and dials. Notwithstanding, that is only a glimpse of a larger problem to the extent this
program is concerned. One especially fascinating visual checking highlight is called NetPath basic way
representation [10]. This causes you to see dynamic system ways of traffic from jump to bounce.
ManageEngine OpManager mixes straightforward dashboard plans with shading coded dials and
diagrams graphs in a comparative vein to SolarWinds Network Performance Monitor. These structures
are anything but difficult to peruse under strain yet what truly emerges is ManageEngine OpManager's
system map. You can see topological and geological maps of your system to see which gadgets are ready
for action.
From this point of view, you can see promptly if there is an issue. The incredible thing about this is the
ManageEngine OpManager autodiscovery include guarantees that this keeps awake to-date.
Difference between OpManager and SolarWinds Network performance monitors
Bandwidth Monitoring
Data transfer capacity Monitoring and NetFlow investigation are the absolute most critical devices for
screening your system against future issues. Having the capacity to tell how much data transfer capacity
you have accessible and what applications are gobbling up your transmission capacity reveals to you a
ton about how well your system is working. ManageEngine OpManager conveys a phenomenal
involvement in this regard as it offers stream investigation for IPFIX, NetFlow, jFlow, and sFlow [11].
This gives you the fundamentals expected to take a basic eye to your system use. SolarWinds Network
Performance Monitor is increasingly restricted as in you need SolarWinds NetFlow Analyzer so as to lead
stream investigation. With this extra program, you can screen streams, for example, IPFIX, NetFlow,
jFlow, and sFlow.
Around there, the preferred standpoint goes to ManageEngine OpManager. The reason is that you need
to download SolarWinds NetFlow Analyzer so as to direct indistinguishable number of stream
examinations from ManageEngine OpManager. In light of a legitimate concern for effortlessness, it
bodes well to convey ManageEngine OpManager as you don't need to download an extra item to utilize
this component [12].
Operating system
The ManageEngine OpManager is available in variety of operating system including all type of windows
and Linux OS as compared to the SolarWinds Network performance monitor which is only compartible
and available in Windows Server and the database Operating systems.
CONCLUSION
In conclusion, we defined what network monitoring and how it is vital it is to keep awake to the moment
to guarantee your system keeps on running easily. Moreover, we have discussed three distinctive
system observing frameworks which all offer an alternate scope of adaptability, alarms, investigating
and ongoing perceivability. System Monitoring is a vital thing in the IT business regardless of what the
framework scale is. Presently its opportunity to locate the correct observing application.
⊘ This is a preview!⊘
Do you want full access?
Subscribe today to unlock all pages.
Trusted by 1+ million students worldwide
REFERENCE LIST
[1]J. Nilausen, "Token ring network management: Problem management", International Journal of
Network Management, vol. 3, no. 4, pp. 207-212, 2018. Available: 10.1002/nem.4560030407.
[2]T. Chiu, "Getting proactive network management from reactive network management
tools", International Journal of Network Management, vol. 8, no. 1, pp. 12-17, 2014. Available:
10.1002/(sici)1099-1190(199801/02)8:1<12::aid-nem289>3.0.co;2-b.
[3]M. Wright, "Using policies for effective network management", International Journal of Network
Management, vol. 9, no. 2, pp. 118-125, 2017. Available: 10.1002/(sici)1099-
1190(199903/04)9:2<118::aid-nem313>3.0.co;2-3.
[4]W. Fuller, "Network management using expert diagnostics", International Journal of Network
Management, vol. 9, no. 4, pp. 199-208, 2016. Available: 10.1002/(sici)1099-
1190(199907/08)9:4<199::aid-nem324>3.0.co;2-3.
[5]L. Deri, "Desktop versus web-based network management", International Journal of Network
Management, vol. 9, no. 6, pp. 371-378, 2015. Available: 10.1002/(sici)1099-
1190(199911/12)9:6<371::aid-nem347>3.0.co;2-q.
[6]N. Lam, "Network management in a fast packet environment", International Journal of Network
Management, vol. 1, no. 2, pp. 96-101, 2009. Available: 10.1002/nem.4560010206.
[7]J. Nilausen, "Token Ring Network Management for ManageEngine OpManager", International Journal
of Network Management, vol. 3, no. 3, pp. 125-131, 2011. Available: 10.1002/nem.4560030303.
[8]K. Jones, "Beyond network management: Planning for disaster recovery", International Journal of
Network Management, vol. 4, no. 4, pp. 198-202, 2012. Available: 10.1002/nem.4560040405.
[9]D. Gaïti, "I2NMA: An intelligent integrated network management architecture", International Journal
of Network Management, vol. 4, no. 4, pp. 179-189, 2011. Available: 10.1002/nem.4560040403.
[10]K. Opilr, "Secure network management initiative", Network Security, vol. 1994, no. 12, p. 4, 1994.
Available: 10.1016/1353-4858(94)90021-3 [Accessed 15 April 2019].
[11]W. Stallings, Network management. Washington: IEEE, 2011.
Paraphrase This Document
Need a fresh take? Get an instant paraphrase of this document with our AI Paraphraser

[12]"Definition of NETWORK", Merriam-webster.com, 2019. [Online]. Available: https://www.merriam-
webster.com/dictionary/network. [Accessed: 15- Apr- 2019].
webster.com/dictionary/network. [Accessed: 15- Apr- 2019].
1 out of 11
Related Documents


Your All-in-One AI-Powered Toolkit for Academic Success.
+13062052269
info@desklib.com
Available 24*7 on WhatsApp / Email
![[object Object]](/_next/static/media/star-bottom.7253800d.svg)
Unlock your academic potential
Copyright © 2020–2026 A2Z Services. All Rights Reserved. Developed and managed by ZUCOL.