A Study on Mobile Gaming Addiction, Health, and User Behavior
VerifiedAdded on 2023/04/21
|8
|3265
|156
Report
AI Summary
This research report investigates the relationship between mobile gaming and addiction, examining the impact on user behavior and health. The study, based on a survey of 32 respondents, reveals that mobile phones are widely accessible for gaming, with women being major users of games like Candy Crush Saga. The findings indicate a correlation between mobile gaming and addiction, potentially leading to excessive time spent gaming and affecting health. The study also explores the device preferences for gaming, the most played games, and the time spent on gaming across genders, concluding that there is a significant relationship between mobile gaming and addiction, with implications for user well-being and time management. The study also reveals that mobile gaming helps in reducing the feeling of loneliness.
Abstract
Advancement in information communication
technology (ICT) has led to the invention and
development of various kind of mobile phones and
computers entry into the market every year. Several
brands characterized by Android, and the operating
system has risen competition in market spreading its
importance globally and easing communication and
advancing research. The users have explored the use
of these devices to include leisure, entertainment,
online communication, online and offline
businesses, to store, manipulate, analyze data and
internet banking. However, the usage of mobile
phones across gender and age has taken a different
direction. Mobile devices are now accessible across
the globe and with a large number of users being
business people and students. Several Android
phones have been also introduced into the market
basically for gaming whose target users are children
and people with great interest in mobile gaming.
Incorporation of mobile games into the mobile
phones has indeed lead to addiction, faced out the
feeling of loneliness and consumed much time that
could be spent doing other constructive things. The
popular addictive mobile games are angry birds,
candy crush saga, mortal combats5, and mortal
combat. This study aims to examine the most
popular mobile games that consume much of the
time of the users across the age and gender as well
as the effect of mobile games on the health of the
users. Whether there is a relationship between
mobile gaming and the health of the users. Primary
data were collected from 32 respondents whose age
ranges from 15 to 34 through a random survey. The
selection was done randomly for both male and
female respondents. The findings show mobile
phone was accessible to every respondent and
therefore were accessible to mobile games. It also
revealed that women are the major users of the
mobile phone on gaming, and in particular, candy
crush saga. Mobile games have addiction effect to
the users as a result of many users taking much of
their time in gaming. The findings also indicate that
mobile games resolve the problem of feeling
loneliness.
Research design
The sample of respondents was collected randomly
and the questionnaire was issued. Data was
collected and coded into the Statistical Package for
Social Science. Frequency and descriptive statistics
were used to analyze the effect of mobile gaming to
the users. It was also used to assess the relationship
between the usage of the mobile phone on gaming
across gender and the time.
Introduction
The mobile phone was initially made to be used by
adults basically for business purposes and it has
become a powerful device used across all scales of
economy. A mobile phone is a device used for
wireless communication, entertainment and
research (K. 2013), and it has become a basic
device used across the globe for communication
through its use continues to advance due to
technological development and revolution (Mikael
Gajecki 2014). Research study on mobile gaming
revealed that women are major users of mobile
phones for mobile gaming (Aoki 2011) and mobile
Paraphrase This Document
Need a fresh take? Get an instant paraphrase of this document with our AI Paraphraser
games are integrated majorly to behavioral
addiction (Kritika M. 2013). Further studies (Takao
2009) say that the addictive mobile gaming is
becoming problematic on the phone usage and it is
impacting negatively to family relationships while
(San Francisco 2012) Argue that however many
mobile games have addiction effect, it was designed
with strategies of training and education where
through mobile gaming, children are introduced to
the world of technology. Researchers have over
time been tirelessly trying to base their studies on
how mobile gaming has impacted positively or
negatively to behavioral change. (Böhmer 2011)
Reveal that, along with the positive effects, there
are negative aspects to the users which include
addiction and increase of fraud cases among others.
The study reveals that there is a relationship
between psychological characteristics and mobile
gaming addiction (Hong 2012).
Data analysis
Data were coded in IBM SPSS. Frequency statistics
and descriptive statistics were used to analyze the
effect of the use of mobile gaming on behavioral
change and as well analyze the attitude of the
respondents across the gender on the effect of
mobile gaming on their health. The correlation
coefficient was used to determine the relationship
between the use of mobile and the addiction effect.
Results and discussion
All the 32 respondents have the mobile phone as
shown in table I below.
This is a clear indication that a mobile phone is an
access device to a larger percentage of the
population across the globe.
Correlation analysis was conducted between the two
variables, the behavioral change and in, particular,
addiction and the use of the mobile.
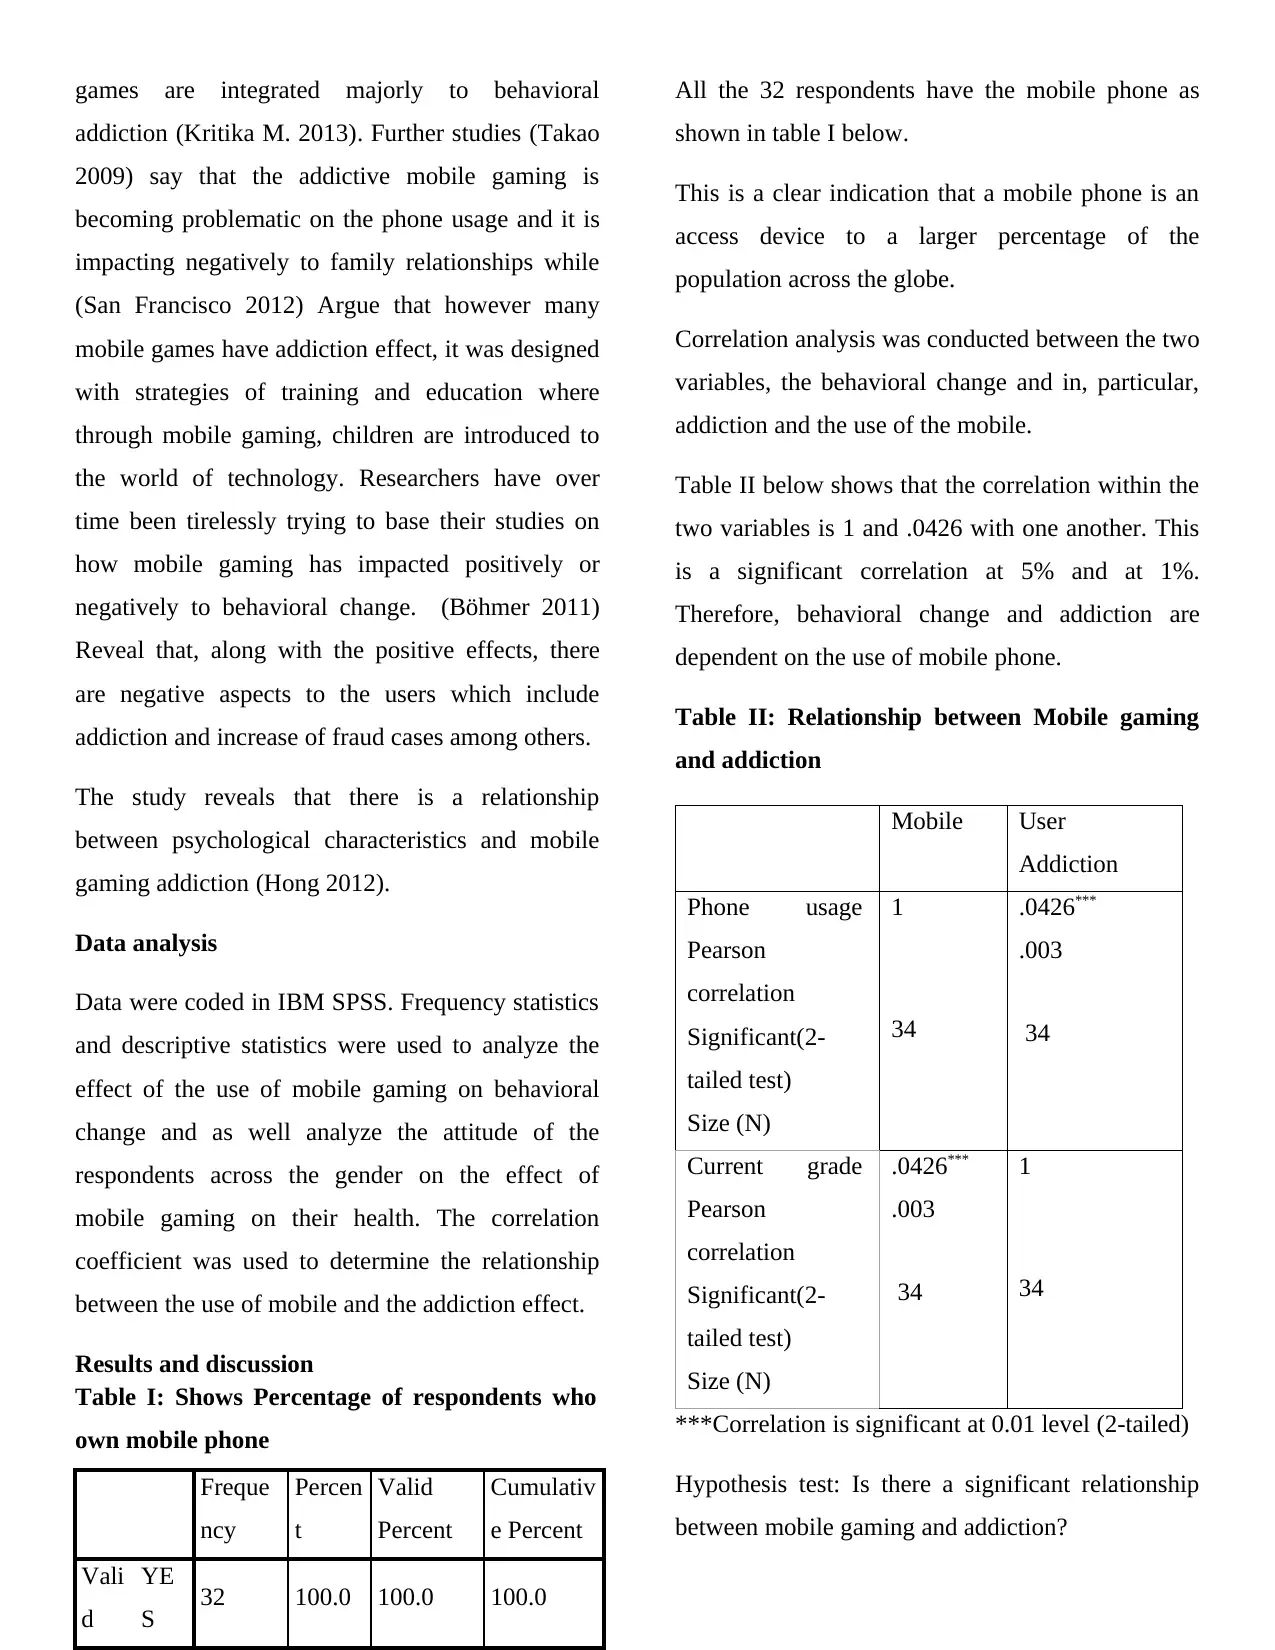
Table II below shows that the correlation within the
two variables is 1 and .0426 with one another. This
is a significant correlation at 5% and at 1%.
Therefore, behavioral change and addiction are
dependent on the use of mobile phone.
Table II: Relationship between Mobile gaming
and addiction
Mobile User
Addiction
Phone usage
Pearson
correlation
Significant(2-
tailed test)
Size (N)
1
34
.0426***
.003
34
Current grade
Pearson
correlation
Significant(2-
tailed test)
Size (N)
.0426***
.003
34
1
34
***Correlation is significant at 0.01 level (2-tailed)
Hypothesis test: Is there a significant relationship
between mobile gaming and addiction?
Table I: Shows Percentage of respondents who
own mobile phone
Freque
ncy
Percen
t
Valid
Percent
Cumulativ
e Percent
Vali
d
YE
S 32 100.0 100.0 100.0
addiction (Kritika M. 2013). Further studies (Takao
2009) say that the addictive mobile gaming is
becoming problematic on the phone usage and it is
impacting negatively to family relationships while
(San Francisco 2012) Argue that however many
mobile games have addiction effect, it was designed
with strategies of training and education where
through mobile gaming, children are introduced to
the world of technology. Researchers have over
time been tirelessly trying to base their studies on
how mobile gaming has impacted positively or
negatively to behavioral change. (Böhmer 2011)
Reveal that, along with the positive effects, there
are negative aspects to the users which include
addiction and increase of fraud cases among others.
The study reveals that there is a relationship
between psychological characteristics and mobile
gaming addiction (Hong 2012).
Data analysis
Data were coded in IBM SPSS. Frequency statistics
and descriptive statistics were used to analyze the
effect of the use of mobile gaming on behavioral
change and as well analyze the attitude of the
respondents across the gender on the effect of
mobile gaming on their health. The correlation
coefficient was used to determine the relationship
between the use of mobile and the addiction effect.
Results and discussion
All the 32 respondents have the mobile phone as
shown in table I below.
This is a clear indication that a mobile phone is an
access device to a larger percentage of the
population across the globe.
Correlation analysis was conducted between the two
variables, the behavioral change and in, particular,
addiction and the use of the mobile.
Table II below shows that the correlation within the
two variables is 1 and .0426 with one another. This
is a significant correlation at 5% and at 1%.
Therefore, behavioral change and addiction are
dependent on the use of mobile phone.
Table II: Relationship between Mobile gaming
and addiction
Mobile User
Addiction
Phone usage
Pearson
correlation
Significant(2-
tailed test)
Size (N)
1
34
.0426***
.003
34
Current grade
Pearson
correlation
Significant(2-
tailed test)
Size (N)
.0426***
.003
34
1
34
***Correlation is significant at 0.01 level (2-tailed)
Hypothesis test: Is there a significant relationship
between mobile gaming and addiction?
Table I: Shows Percentage of respondents who
own mobile phone
Freque
ncy
Percen
t
Valid
Percent
Cumulativ
e Percent
Vali
d
YE
S 32 100.0 100.0 100.0
H0: There is no significant relationship between
mobile gaming and addiction.
H1: There is a significant relationship between
mobile gaming and addiction.
Table III: Statistical test computation
Respons
es
A B A-B (A-B)^2 (A-
B)^2/B
Yes 2
2
10.6
7
11.3
3
128.37 12.3
No 8 10.6
7
-2.67 7.13 0.67
No Idea 2 10.6
7
-8.67 75.17 7.4
Total 3
2
32 -0.01 20.07
B stands for expected value and A is the observed
value
A=32/3=10.67 X2 = ∑∑( A−B)2
B =20.55 hence
H1
X2 = Table value =(r-1) =3-1=2 2 at 0.05=5.991
(H0)
Conclusion: our calculated value is 20.07 which is
greater than table value 5.991. We, therefore, reject
the null hypothesis (H0) and accept alternative
hypothesis (H1). We, therefore, conclude that there
is a significant relationship between mobile gaming
and addiction
32 respondents were surveyed, of which 16(50%)
and 16(50%) were male and female respectively.
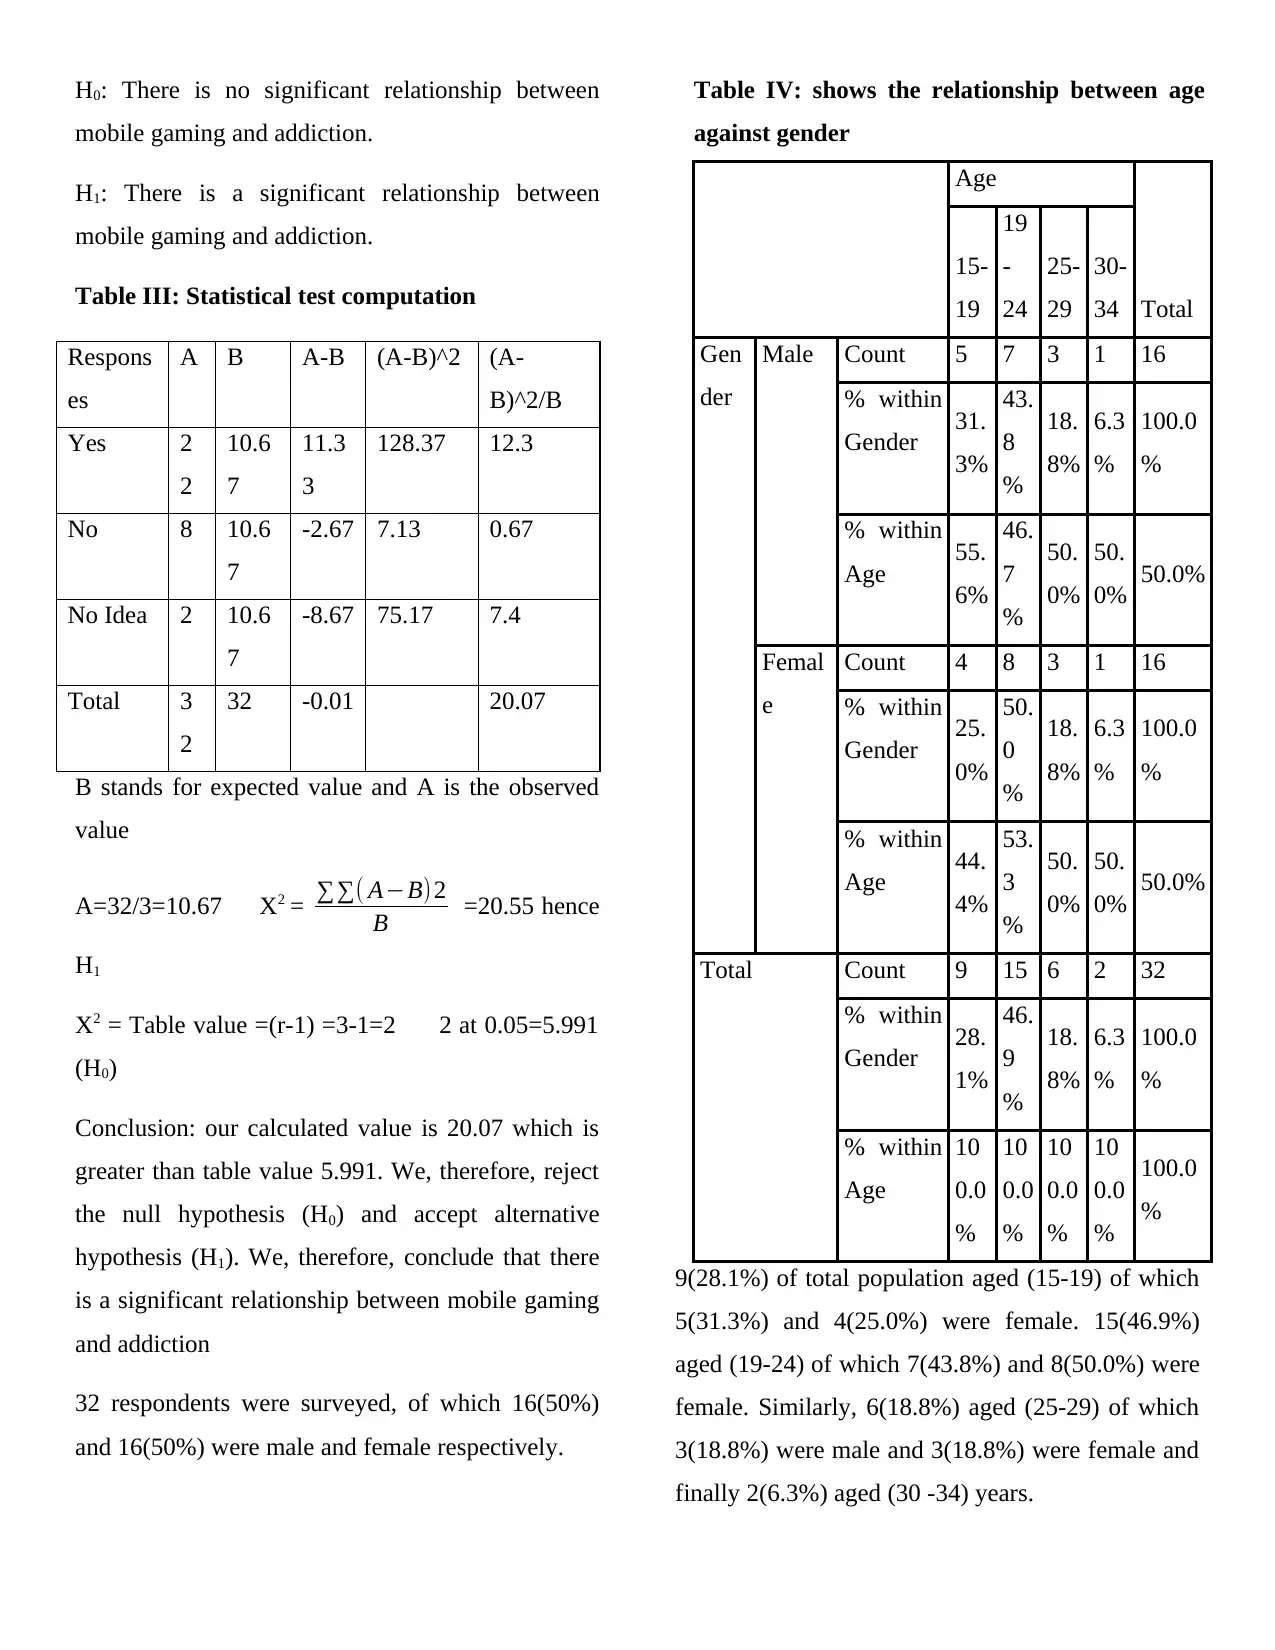
Table IV: shows the relationship between age
against gender
Age
Total
15-
19
19
-
24
25-
29
30-
34
Gen
der
Male Count 5 7 3 1 16
% within
Gender 31.
3%
43.
8
%
18.
8%
6.3
%
100.0
%
% within
Age 55.
6%
46.
7
%
50.
0%
50.
0% 50.0%
Femal
e
Count 4 8 3 1 16
% within
Gender 25.
0%
50.
0
%
18.
8%
6.3
%
100.0
%
% within
Age 44.
4%
53.
3
%
50.
0%
50.
0% 50.0%
Total Count 9 15 6 2 32
% within
Gender 28.
1%
46.
9
%
18.
8%
6.3
%
100.0
%
% within
Age
10
0.0
%
10
0.0
%
10
0.0
%
10
0.0
%
100.0
%
9(28.1%) of total population aged (15-19) of which
5(31.3%) and 4(25.0%) were female. 15(46.9%)
aged (19-24) of which 7(43.8%) and 8(50.0%) were
female. Similarly, 6(18.8%) aged (25-29) of which
3(18.8%) were male and 3(18.8%) were female and
finally 2(6.3%) aged (30 -34) years.
mobile gaming and addiction.
H1: There is a significant relationship between
mobile gaming and addiction.
Table III: Statistical test computation
Respons
es
A B A-B (A-B)^2 (A-
B)^2/B
Yes 2
2
10.6
7
11.3
3
128.37 12.3
No 8 10.6
7
-2.67 7.13 0.67
No Idea 2 10.6
7
-8.67 75.17 7.4
Total 3
2
32 -0.01 20.07
B stands for expected value and A is the observed
value
A=32/3=10.67 X2 = ∑∑( A−B)2
B =20.55 hence
H1
X2 = Table value =(r-1) =3-1=2 2 at 0.05=5.991
(H0)
Conclusion: our calculated value is 20.07 which is
greater than table value 5.991. We, therefore, reject
the null hypothesis (H0) and accept alternative
hypothesis (H1). We, therefore, conclude that there
is a significant relationship between mobile gaming
and addiction
32 respondents were surveyed, of which 16(50%)
and 16(50%) were male and female respectively.
Table IV: shows the relationship between age
against gender
Age
Total
15-
19
19
-
24
25-
29
30-
34
Gen
der
Male Count 5 7 3 1 16
% within
Gender 31.
3%
43.
8
%
18.
8%
6.3
%
100.0
%
% within
Age 55.
6%
46.
7
%
50.
0%
50.
0% 50.0%
Femal
e
Count 4 8 3 1 16
% within
Gender 25.
0%
50.
0
%
18.
8%
6.3
%
100.0
%
% within
Age 44.
4%
53.
3
%
50.
0%
50.
0% 50.0%
Total Count 9 15 6 2 32
% within
Gender 28.
1%
46.
9
%
18.
8%
6.3
%
100.0
%
% within
Age
10
0.0
%
10
0.0
%
10
0.0
%
10
0.0
%
100.0
%
9(28.1%) of total population aged (15-19) of which
5(31.3%) and 4(25.0%) were female. 15(46.9%)
aged (19-24) of which 7(43.8%) and 8(50.0%) were
female. Similarly, 6(18.8%) aged (25-29) of which
3(18.8%) were male and 3(18.8%) were female and
finally 2(6.3%) aged (30 -34) years.
⊘ This is a preview!⊘
Do you want full access?
Subscribe today to unlock all pages.
Trusted by 1+ million students worldwide
The results also indicate that in both male and
female, most of the respondents were aged between
19 to 24 years
Analysis to identify the device that respondents use
to play games across the gender was conducted as
indicated in the bar chart below.
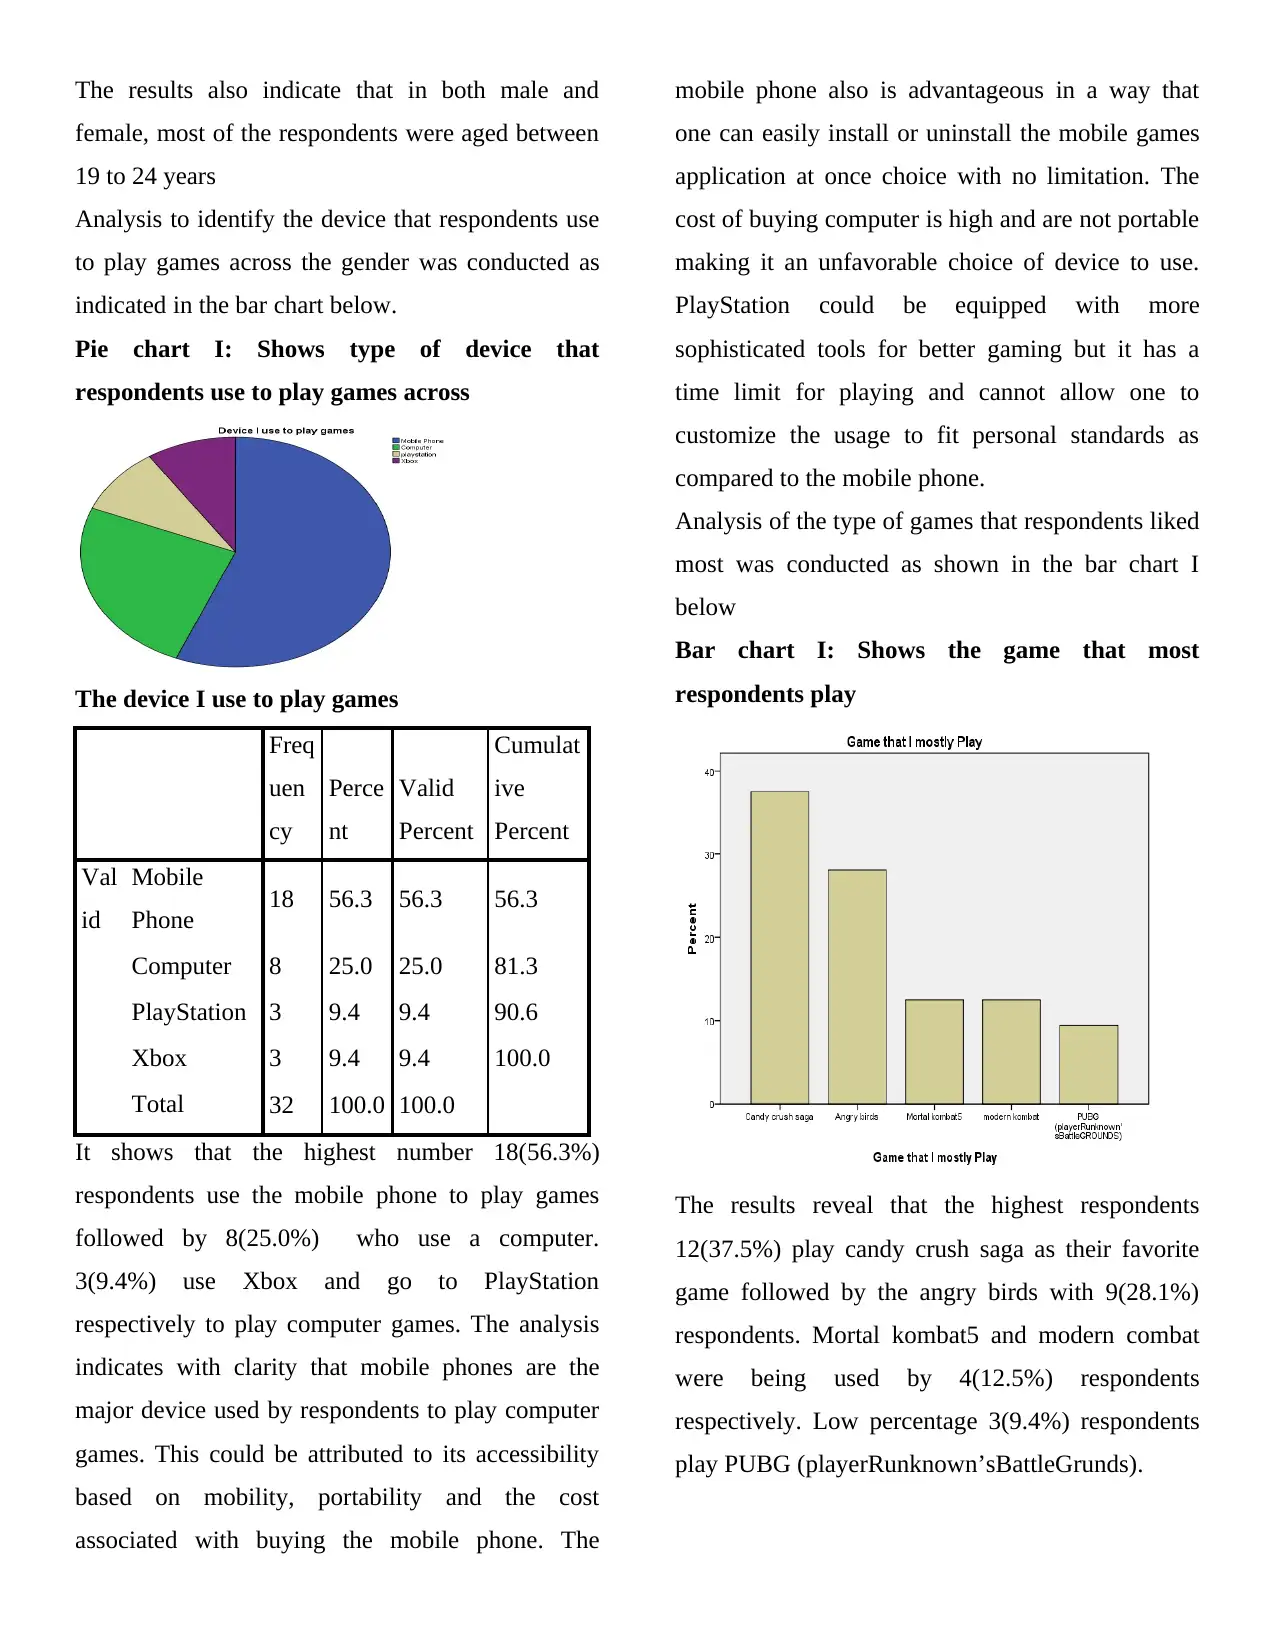
Pie chart I: Shows type of device that
respondents use to play games across
The device I use to play games
Freq
uen
cy
Perce
nt
Valid
Percent
Cumulat
ive
Percent
Val
id
Mobile
Phone 18 56.3 56.3 56.3
Computer 8 25.0 25.0 81.3
PlayStation 3 9.4 9.4 90.6
Xbox 3 9.4 9.4 100.0
Total 32 100.0 100.0
It shows that the highest number 18(56.3%)
respondents use the mobile phone to play games
followed by 8(25.0%) who use a computer.
3(9.4%) use Xbox and go to PlayStation
respectively to play computer games. The analysis
indicates with clarity that mobile phones are the
major device used by respondents to play computer
games. This could be attributed to its accessibility
based on mobility, portability and the cost
associated with buying the mobile phone. The
mobile phone also is advantageous in a way that
one can easily install or uninstall the mobile games
application at once choice with no limitation. The
cost of buying computer is high and are not portable
making it an unfavorable choice of device to use.
PlayStation could be equipped with more
sophisticated tools for better gaming but it has a
time limit for playing and cannot allow one to
customize the usage to fit personal standards as
compared to the mobile phone.
Analysis of the type of games that respondents liked
most was conducted as shown in the bar chart I
below
Bar chart I: Shows the game that most
respondents play
The results reveal that the highest respondents
12(37.5%) play candy crush saga as their favorite
game followed by the angry birds with 9(28.1%)
respondents. Mortal kombat5 and modern combat
were being used by 4(12.5%) respondents
respectively. Low percentage 3(9.4%) respondents
play PUBG (playerRunknown’sBattleGrunds).
female, most of the respondents were aged between
19 to 24 years
Analysis to identify the device that respondents use
to play games across the gender was conducted as
indicated in the bar chart below.
Pie chart I: Shows type of device that
respondents use to play games across
The device I use to play games
Freq
uen
cy
Perce
nt
Valid
Percent
Cumulat
ive
Percent
Val
id
Mobile
Phone 18 56.3 56.3 56.3
Computer 8 25.0 25.0 81.3
PlayStation 3 9.4 9.4 90.6
Xbox 3 9.4 9.4 100.0
Total 32 100.0 100.0
It shows that the highest number 18(56.3%)
respondents use the mobile phone to play games
followed by 8(25.0%) who use a computer.
3(9.4%) use Xbox and go to PlayStation
respectively to play computer games. The analysis
indicates with clarity that mobile phones are the
major device used by respondents to play computer
games. This could be attributed to its accessibility
based on mobility, portability and the cost
associated with buying the mobile phone. The
mobile phone also is advantageous in a way that
one can easily install or uninstall the mobile games
application at once choice with no limitation. The
cost of buying computer is high and are not portable
making it an unfavorable choice of device to use.
PlayStation could be equipped with more
sophisticated tools for better gaming but it has a
time limit for playing and cannot allow one to
customize the usage to fit personal standards as
compared to the mobile phone.
Analysis of the type of games that respondents liked
most was conducted as shown in the bar chart I
below
Bar chart I: Shows the game that most
respondents play
The results reveal that the highest respondents
12(37.5%) play candy crush saga as their favorite
game followed by the angry birds with 9(28.1%)
respondents. Mortal kombat5 and modern combat
were being used by 4(12.5%) respondents
respectively. Low percentage 3(9.4%) respondents
play PUBG (playerRunknown’sBattleGrunds).
Paraphrase This Document
Need a fresh take? Get an instant paraphrase of this document with our AI Paraphraser
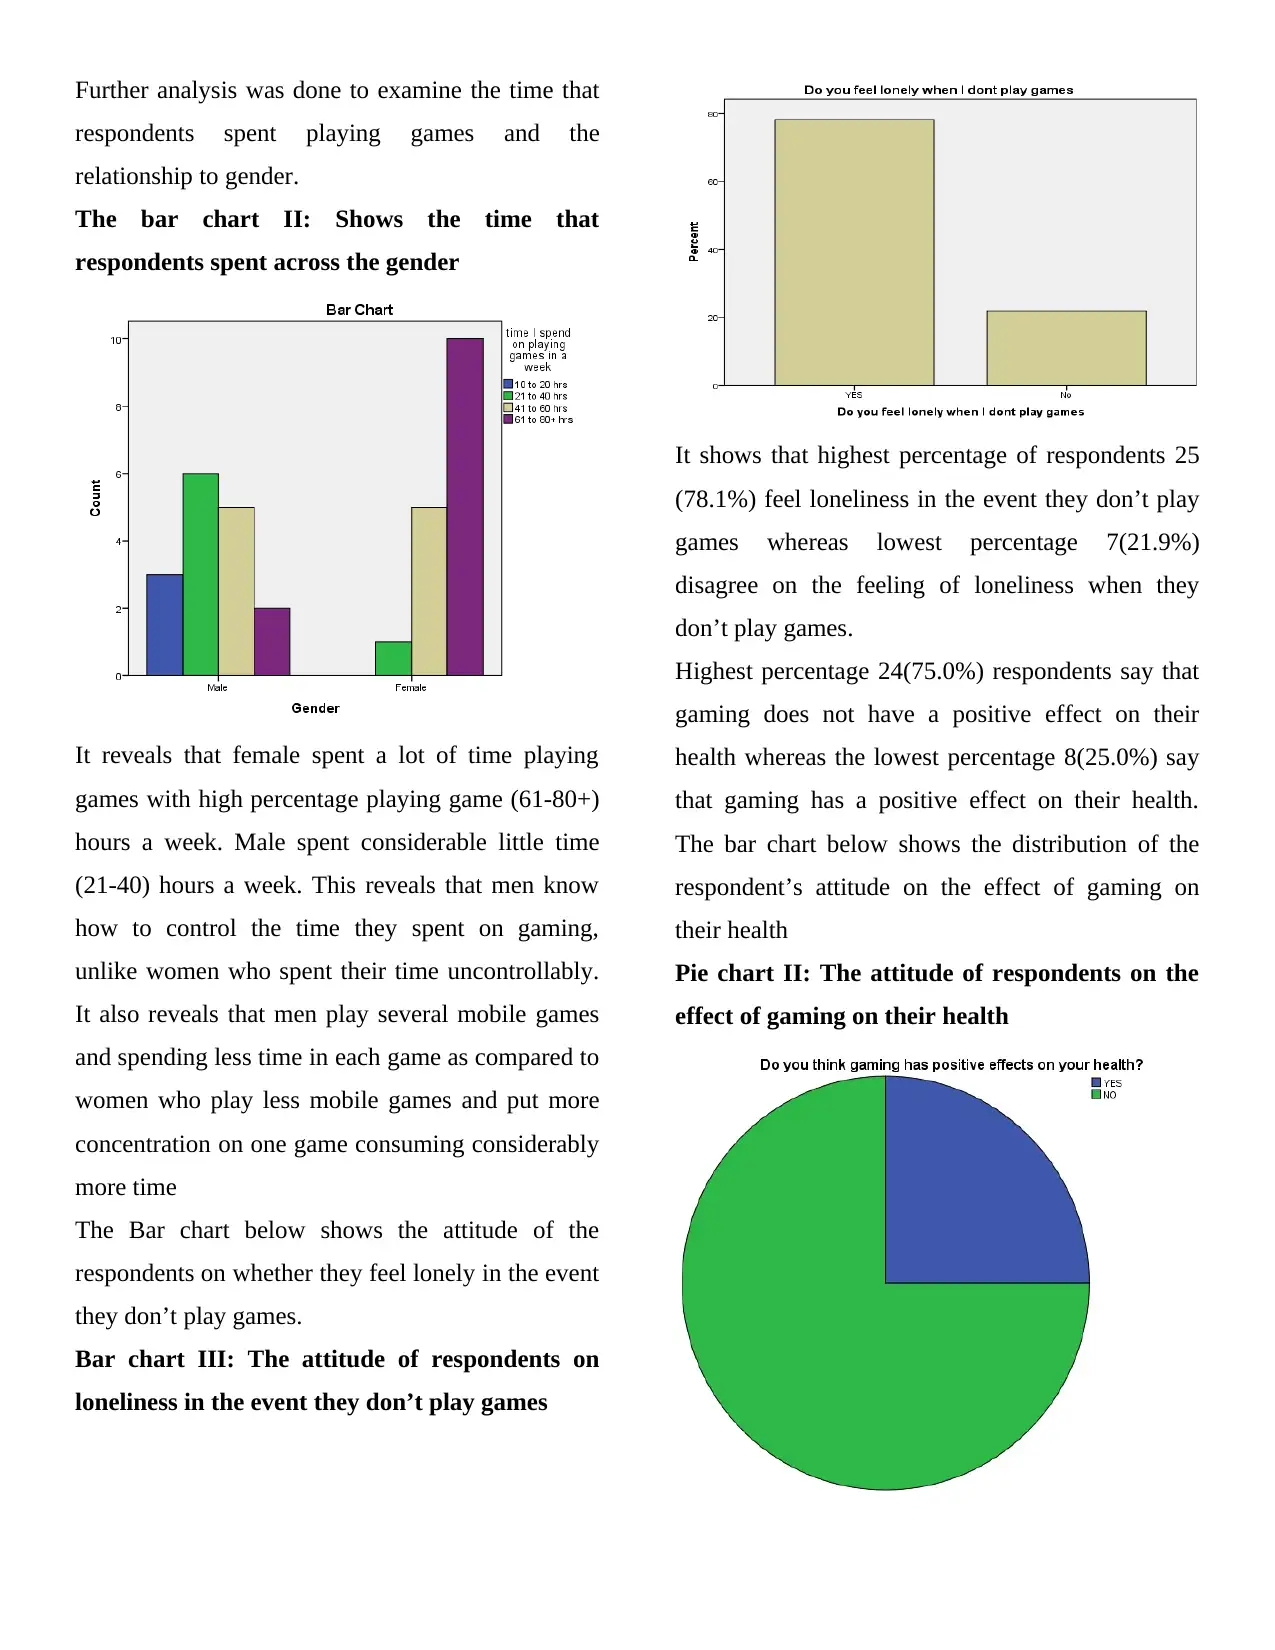
Further analysis was done to examine the time that
respondents spent playing games and the
relationship to gender.
The bar chart II: Shows the time that
respondents spent across the gender
It reveals that female spent a lot of time playing
games with high percentage playing game (61-80+)
hours a week. Male spent considerable little time
(21-40) hours a week. This reveals that men know
how to control the time they spent on gaming,
unlike women who spent their time uncontrollably.
It also reveals that men play several mobile games
and spending less time in each game as compared to
women who play less mobile games and put more
concentration on one game consuming considerably
more time
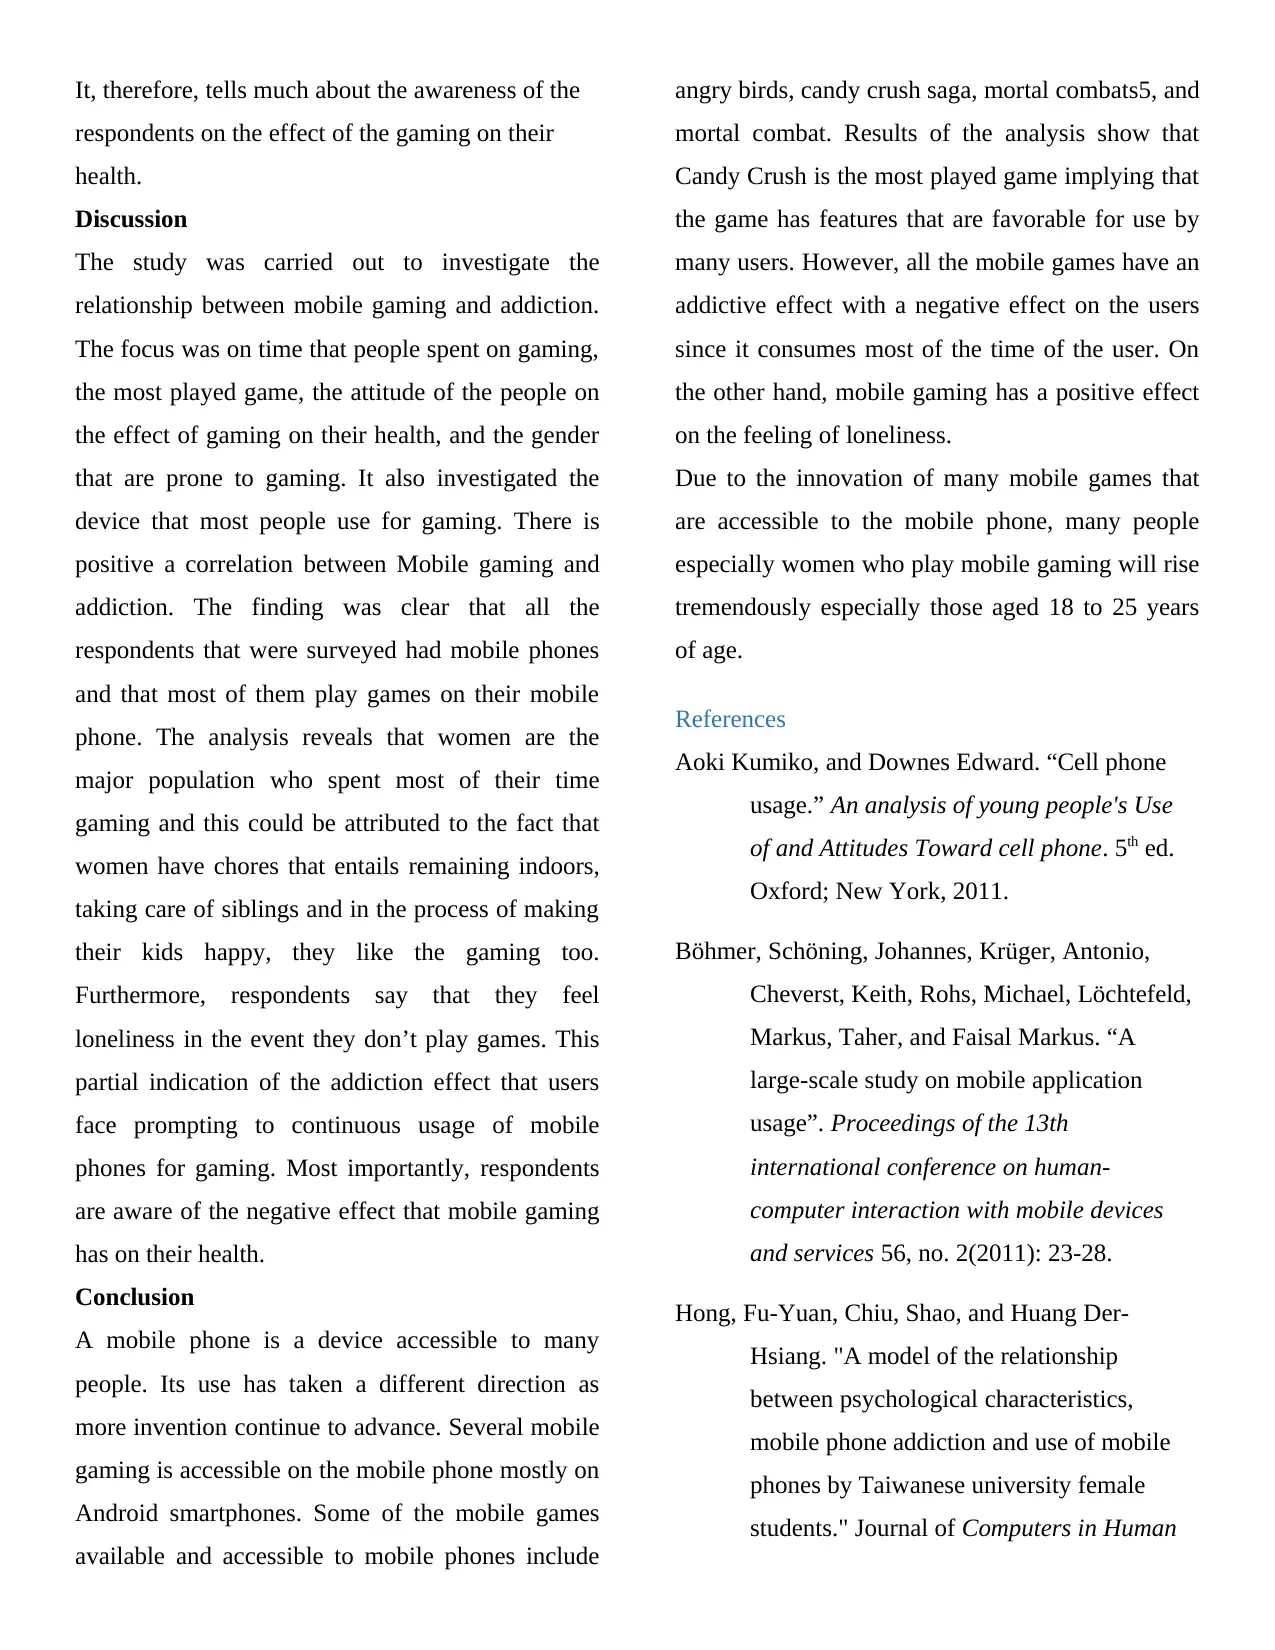
The Bar chart below shows the attitude of the
respondents on whether they feel lonely in the event
they don’t play games.
Bar chart III: The attitude of respondents on
loneliness in the event they don’t play games
It shows that highest percentage of respondents 25
(78.1%) feel loneliness in the event they don’t play
games whereas lowest percentage 7(21.9%)
disagree on the feeling of loneliness when they
don’t play games.
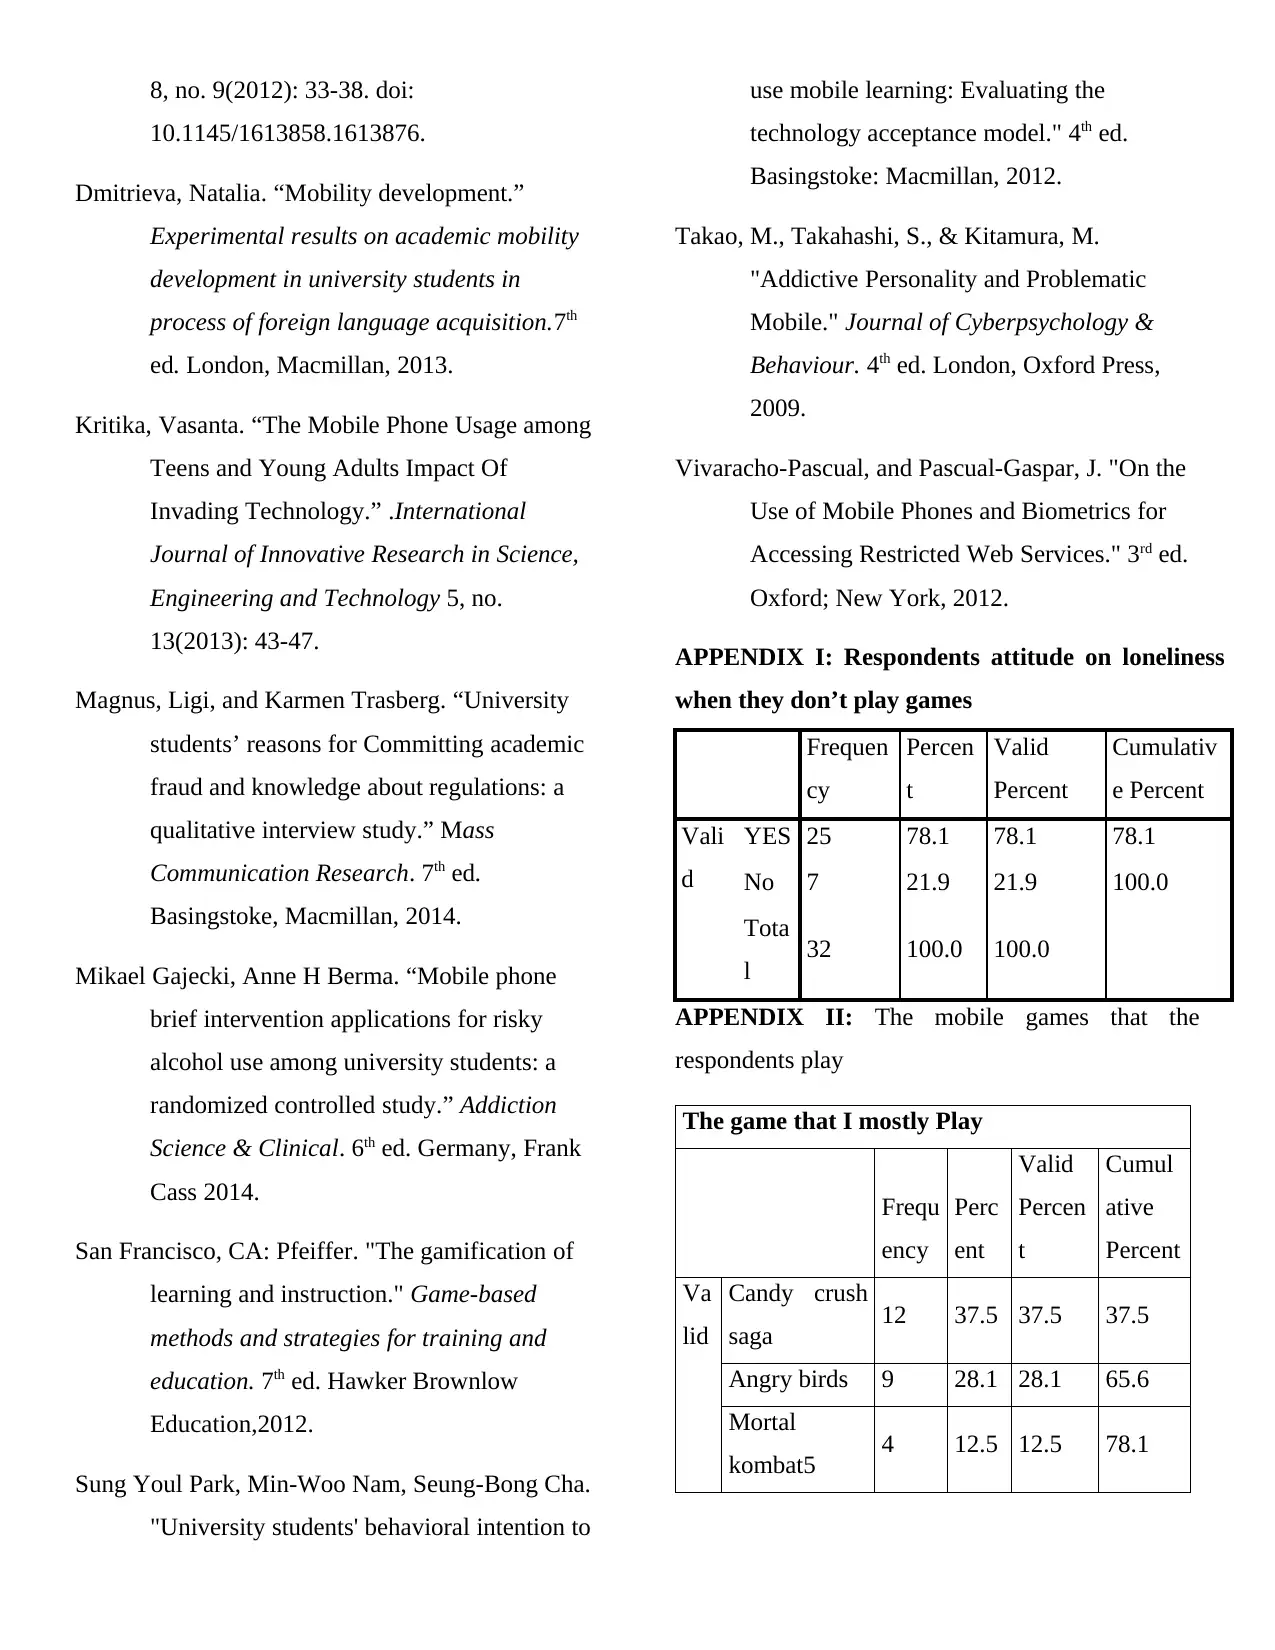
Highest percentage 24(75.0%) respondents say that
gaming does not have a positive effect on their
health whereas the lowest percentage 8(25.0%) say
that gaming has a positive effect on their health.
The bar chart below shows the distribution of the
respondent’s attitude on the effect of gaming on
their health
Pie chart II: The attitude of respondents on the
effect of gaming on their health
respondents spent playing games and the
relationship to gender.
The bar chart II: Shows the time that
respondents spent across the gender
It reveals that female spent a lot of time playing
games with high percentage playing game (61-80+)
hours a week. Male spent considerable little time
(21-40) hours a week. This reveals that men know
how to control the time they spent on gaming,
unlike women who spent their time uncontrollably.
It also reveals that men play several mobile games
and spending less time in each game as compared to
women who play less mobile games and put more
concentration on one game consuming considerably
more time
The Bar chart below shows the attitude of the
respondents on whether they feel lonely in the event
they don’t play games.
Bar chart III: The attitude of respondents on
loneliness in the event they don’t play games
It shows that highest percentage of respondents 25
(78.1%) feel loneliness in the event they don’t play
games whereas lowest percentage 7(21.9%)
disagree on the feeling of loneliness when they
don’t play games.
Highest percentage 24(75.0%) respondents say that
gaming does not have a positive effect on their
health whereas the lowest percentage 8(25.0%) say
that gaming has a positive effect on their health.
The bar chart below shows the distribution of the
respondent’s attitude on the effect of gaming on
their health
Pie chart II: The attitude of respondents on the
effect of gaming on their health
It, therefore, tells much about the awareness of the
respondents on the effect of the gaming on their
health.
Discussion
The study was carried out to investigate the
relationship between mobile gaming and addiction.
The focus was on time that people spent on gaming,
the most played game, the attitude of the people on
the effect of gaming on their health, and the gender
that are prone to gaming. It also investigated the
device that most people use for gaming. There is
positive a correlation between Mobile gaming and
addiction. The finding was clear that all the
respondents that were surveyed had mobile phones
and that most of them play games on their mobile
phone. The analysis reveals that women are the
major population who spent most of their time
gaming and this could be attributed to the fact that
women have chores that entails remaining indoors,
taking care of siblings and in the process of making
their kids happy, they like the gaming too.
Furthermore, respondents say that they feel
loneliness in the event they don’t play games. This
partial indication of the addiction effect that users
face prompting to continuous usage of mobile
phones for gaming. Most importantly, respondents
are aware of the negative effect that mobile gaming
has on their health.
Conclusion
A mobile phone is a device accessible to many
people. Its use has taken a different direction as
more invention continue to advance. Several mobile
gaming is accessible on the mobile phone mostly on
Android smartphones. Some of the mobile games
available and accessible to mobile phones include
angry birds, candy crush saga, mortal combats5, and
mortal combat. Results of the analysis show that
Candy Crush is the most played game implying that
the game has features that are favorable for use by
many users. However, all the mobile games have an
addictive effect with a negative effect on the users
since it consumes most of the time of the user. On
the other hand, mobile gaming has a positive effect
on the feeling of loneliness.
Due to the innovation of many mobile games that
are accessible to the mobile phone, many people
especially women who play mobile gaming will rise
tremendously especially those aged 18 to 25 years
of age.
References
Aoki Kumiko, and Downes Edward. “Cell phone
usage.” An analysis of young people's Use
of and Attitudes Toward cell phone. 5th ed.
Oxford; New York, 2011.
Böhmer, Schöning, Johannes, Krüger, Antonio,
Cheverst, Keith, Rohs, Michael, Löchtefeld,
Markus, Taher, and Faisal Markus. “A
large-scale study on mobile application
usage”. Proceedings of the 13th
international conference on human-
computer interaction with mobile devices
and services 56, no. 2(2011): 23-28.
Hong, Fu-Yuan, Chiu, Shao, and Huang Der-
Hsiang. "A model of the relationship
between psychological characteristics,
mobile phone addiction and use of mobile
phones by Taiwanese university female
students." Journal of Computers in Human
⊘ This is a preview!⊘
Do you want full access?
Subscribe today to unlock all pages.
Trusted by 1+ million students worldwide
8, no. 9(2012): 33-38. doi:
10.1145/1613858.1613876.
Dmitrieva, Natalia. “Mobility development.”
Experimental results on academic mobility
development in university students in
process of foreign language acquisition.7th
ed. London, Macmillan, 2013.
Kritika, Vasanta. “The Mobile Phone Usage among
Teens and Young Adults Impact Of
Invading Technology.” .International
Journal of Innovative Research in Science,
Engineering and Technology 5, no.
13(2013): 43-47.
Magnus, Ligi, and Karmen Trasberg. “University
students’ reasons for Committing academic
fraud and knowledge about regulations: a
qualitative interview study.” Mass
Communication Research. 7th ed.
Basingstoke, Macmillan, 2014.
Mikael Gajecki, Anne H Berma. “Mobile phone
brief intervention applications for risky
alcohol use among university students: a
randomized controlled study.” Addiction
Science & Clinical. 6th ed. Germany, Frank
Cass 2014.
San Francisco, CA: Pfeiffer. "The gamification of
learning and instruction." Game-based
methods and strategies for training and
education. 7th ed. Hawker Brownlow
Education,2012.
Sung Youl Park, Min-Woo Nam, Seung-Bong Cha.
"University students' behavioral intention to
use mobile learning: Evaluating the
technology acceptance model." 4th ed.
Basingstoke: Macmillan, 2012.
Takao, M., Takahashi, S., & Kitamura, M.
"Addictive Personality and Problematic
Mobile." Journal of Cyberpsychology &
Behaviour. 4th ed. London, Oxford Press,
2009.
Vivaracho-Pascual, and Pascual-Gaspar, J. "On the
Use of Mobile Phones and Biometrics for
Accessing Restricted Web Services." 3rd ed.
Oxford; New York, 2012.
APPENDIX I: Respondents attitude on loneliness
when they don’t play games
Frequen
cy
Percen
t
Valid
Percent
Cumulativ
e Percent
Vali
d
YES 25 78.1 78.1 78.1
No 7 21.9 21.9 100.0
Tota
l 32 100.0 100.0
APPENDIX II: The mobile games that the
respondents play
The game that I mostly Play
Frequ
ency
Perc
ent
Valid
Percen
t
Cumul
ative
Percent
Va
lid
Candy crush
saga 12 37.5 37.5 37.5
Angry birds 9 28.1 28.1 65.6
Mortal
kombat5 4 12.5 12.5 78.1
Paraphrase This Document
Need a fresh take? Get an instant paraphrase of this document with our AI Paraphraser
modern
combat 4 12.5 12.5 90.6
PUBG
(playerRunkn
own’sBattleG
ROUNDS)
3 9.4 9.4 100.0
Total 32 100.
0 100.0
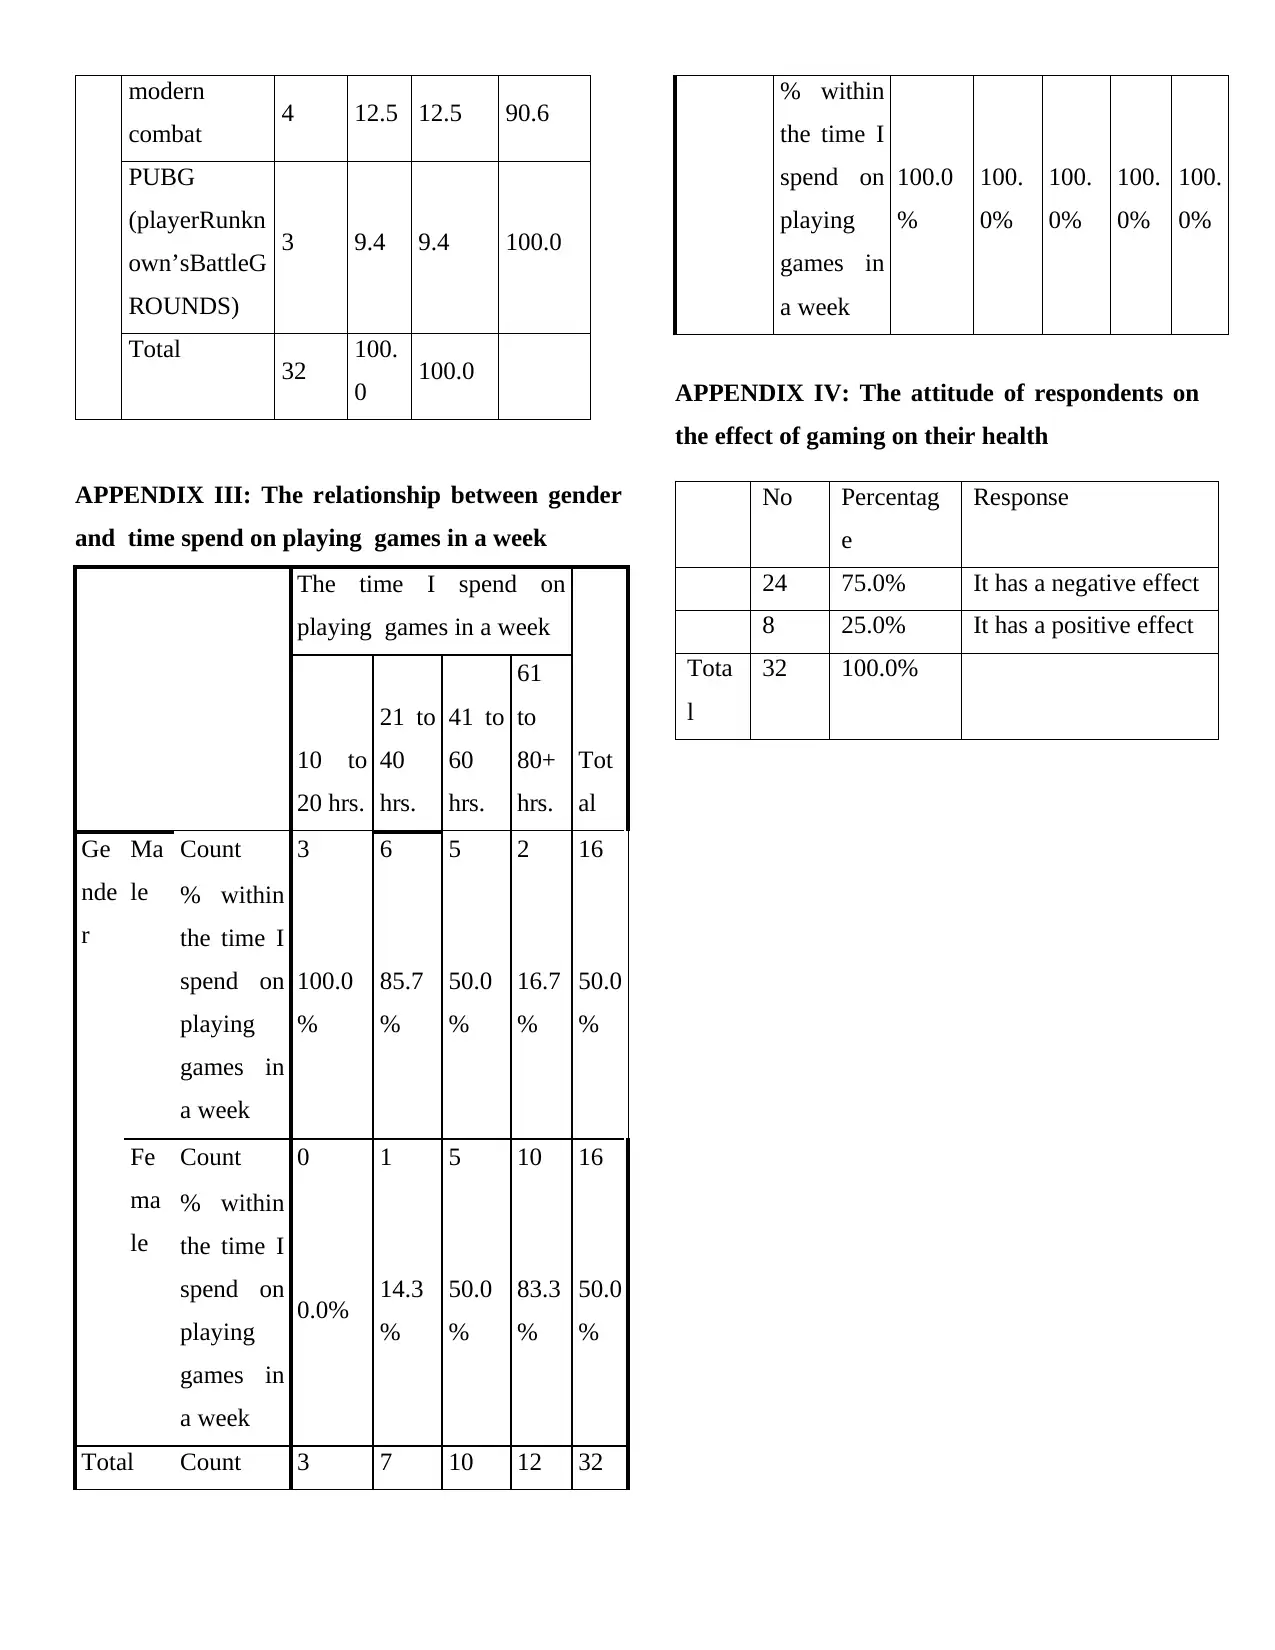
APPENDIX III: The relationship between gender
and time spend on playing games in a week
The time I spend on
playing games in a week
Tot
al
10 to
20 hrs.
21 to
40
hrs.
41 to
60
hrs.
61
to
80+
hrs.
Ge
nde
r
Ma
le
Count 3 6 5 2 16
% within
the time I
spend on
playing
games in
a week
100.0
%
85.7
%
50.0
%
16.7
%
50.0
%
Fe
ma
le
Count 0 1 5 10 16
% within
the time I
spend on
playing
games in
a week
0.0% 14.3
%
50.0
%
83.3
%
50.0
%
Total Count 3 7 10 12 32
% within
the time I
spend on
playing
games in
a week
100.0
%
100.
0%
100.
0%
100.
0%
100.
0%
APPENDIX IV: The attitude of respondents on
the effect of gaming on their health
No Percentag
e
Response
24 75.0% It has a negative effect
8 25.0% It has a positive effect
Tota
l
32 100.0%
combat 4 12.5 12.5 90.6
PUBG
(playerRunkn
own’sBattleG
ROUNDS)
3 9.4 9.4 100.0
Total 32 100.
0 100.0
APPENDIX III: The relationship between gender
and time spend on playing games in a week
The time I spend on
playing games in a week
Tot
al
10 to
20 hrs.
21 to
40
hrs.
41 to
60
hrs.
61
to
80+
hrs.
Ge
nde
r
Ma
le
Count 3 6 5 2 16
% within
the time I
spend on
playing
games in
a week
100.0
%
85.7
%
50.0
%
16.7
%
50.0
%
Fe
ma
le
Count 0 1 5 10 16
% within
the time I
spend on
playing
games in
a week
0.0% 14.3
%
50.0
%
83.3
%
50.0
%
Total Count 3 7 10 12 32
% within
the time I
spend on
playing
games in
a week
100.0
%
100.
0%
100.
0%
100.
0%
100.
0%
APPENDIX IV: The attitude of respondents on
the effect of gaming on their health
No Percentag
e
Response
24 75.0% It has a negative effect
8 25.0% It has a positive effect
Tota
l
32 100.0%
1 out of 8
Related Documents


Your All-in-One AI-Powered Toolkit for Academic Success.
+13062052269
info@desklib.com
Available 24*7 on WhatsApp / Email
![[object Object]](/_next/static/media/star-bottom.7253800d.svg)
Unlock your academic potential
Copyright © 2020–2026 A2Z Services. All Rights Reserved. Developed and managed by ZUCOL.