The Impact of Mobile Phone Use on Grades in Canadian Lectures
VerifiedAdded on 2023/04/20
|19
|2813
|333
Report
AI Summary
This report presents a quantitative research study conducted in Canada investigating the relationship between mobile phone usage during lectures and student grades. The research begins with an abstract and introduction, outlining the research problem, hypothesis, and operational definitions. It details the methodology, including data collection through a survey questionnaire administered to 50 students, sampling techniques, and the statistical methods used for analysis, such as ANOVA and regression. The report includes an analysis of results, presenting demographic characteristics and hypothesis testing. The findings suggest a correlation between increased mobile phone use during lectures and lower academic performance, supported by statistical data and a regression analysis. The conclusion summarizes the key findings, reiterating the support for the hypothesis and the relationship between the variables. The report also includes a comprehensive bibliography and appendices containing the questionnaire and supporting data.
Intro to applied research
Topic: Use of Mobile during lecture lead to lower grades: In the context of Canada
Topic: Use of Mobile during lecture lead to lower grades: In the context of Canada
Paraphrase This Document
Need a fresh take? Get an instant paraphrase of this document with our AI Paraphraser

Research 1
ABSTRACT
In the current scenario, this is witnessed that students perform very less in their end-of-term
exams if they have been given the access to an electronic device, which include the use of mobile
phones. Thus, the rise in the use of mobile phones leads to lower grades in the context of
Canada. The research is conducted on the concern with the motive to grab the understanding on
the topic. The research methods, which will be used by the researcher for conducting the
research, will be explained. The hypothesis in the report will be test with the use of ANOVA and
regression. Thus, this helps the company in understanding the research topic in the effective
manner.
Research 2
Contents
INTRODUCTION...........................................................................................................................3
Research problem........................................................................................................................3
Hypothesis...................................................................................................................................3
OPERATIONAL DEFINITIONS...................................................................................................4
RESEARCH LIMITATIONS..........................................................................................................4
METHODOLOGY..........................................................................................................................5
Data collection method................................................................................................................5
Research tool...............................................................................................................................5
Sampling......................................................................................................................................5
Analysis of Results..........................................................................................................................6
Demographic characteristics........................................................................................................6
Hypothesis test.................................................................................................................................9
Conclusion.....................................................................................................................................11
References......................................................................................................................................12
Appendix........................................................................................................................................13
Appendix 1.................................................................................................................................13
Appendix 2.................................................................................................................................16
Appendix 3.................................................................................................................................17
⊘ This is a preview!⊘
Do you want full access?
Subscribe today to unlock all pages.
Trusted by 1+ million students worldwide
Research 3
INTRODUCTION
The aim of the report is to conduct the research on use of mobile during the lectures, which lead
to the lower grades. In Canada, while visiting the high school classroom these days this has been
found that there is high probability that students will be found as texting, suffering the internet as
well playing the games on mobile devices during the classroom. This creates the impact on
grades and they receive lower grades.
Research problem
In present world, the system of education is developing in Canada and mobile phone usage is
allowed within the class, as this mode the helps the student to attain the knowledge. However,
most of the students make use of the mobile phones at the time of lectures which is an problem
as it create the direct impact on the grades of the students (Valk, Rashid & Elder, 2010).
Considering the severity of the issue, the researcher has conducted the research on the problem to
determine the concern so that problem steps can be taken by the administration. Social theory
offers the general theories with the motive to explain the behaviour of society. The society of
Canada is advance and likes to use technology due to which children make use of mobile phones
that are allowed by lecturer. This has been found that about 85% of the Canadian high school
students carry mobile phone that affects the students in class, as they get distracted due to it
(Paquette, 2015). This is evidence that the statement is the certain with the facts and observation
related to the society.
Hypothesis
H0: There is significant relationship between use of mobile and lower grades.
Paraphrase This Document
Need a fresh take? Get an instant paraphrase of this document with our AI Paraphraser

Research 4
The theory, which is used to develop the hypothesis, is Structural-Functional Theory as approach
views society as complex and interconnected system where every part works all together
(McPhee & Canary, 2016).
OPERATIONAL DEFINITIONS
In the research, it is essential for the researcher to define the operational variables from the topic.
The operational variable is refers to as the way you will define as well as measure the variable
and how it is used for conducting the research. In the research, the topic is use of mobile phones
during lectures lead to lower grades. The major variables include use of mobile phones and lower
grades. The use of mobile phones is increasing in Canada during the class as students spend time
in chatting, using social media as well as for other purposes (Chen & Yan, 2016). The use of
mobile phone during the lectures distracts the students due to which they do not be able to
concentrate on the study that leads to the lower grades. In this, it is clearly that the grades of the
student are totally depended on the use of mobile phones done by the student.
In the research, the independent variable is use of mobiles and the dependent variable is
lower grades of students.
RESEARCH LIMITATIONS
In the context of the research limitation, this can be said that the research include activities that
are majorly practice as the limitation are for survey which is conducted. The topic is not wide
enough as there is use of laptops and other devices are increasing by the students (Ritzer &
Stepnisky, 2017). In addition, the geographic limitation of the research is also there as the
Research 5
research focuses on Canada only. The sampling for the research is based on the survey that was
conducted on 50 students. The responses of the students are considered for analysing the data.
METHODOLOGY
Research methodology is considered as procedure that is taken into the consideration while
collecting the facts by the researcher with the motive to present the research in methodological
manner.
Data collection method
The method of data collection is considered as one of the effective techniques which used by the
researcher with the motive to access the facts that are linked with the concern of research. The
primary data collection method is used by the researcher in which the data has been collected
with the survey through questionnaire of 50 students.
Research tool
The research tool is the tool that is majorly used by the researcher for collecting the data. In
conducting the research on concern topic, the researcher has selected the self-developed
questionnaire as the tool with the motive to collect the responses from different students. The
guidance for the questionnaire is taken from the different studies (Ritzer & Stepnisky, 2017). The
method of formatting the questionnaire is multiple choices that help in accumulating and
understanding the data in effective manner.
Sampling
The research sampling is the process that helps the researcher to implement the selection of the
respondents from the wide group of population. In this research, the probability sampling method
⊘ This is a preview!⊘
Do you want full access?
Subscribe today to unlock all pages.
Trusted by 1+ million students worldwide
Research 6
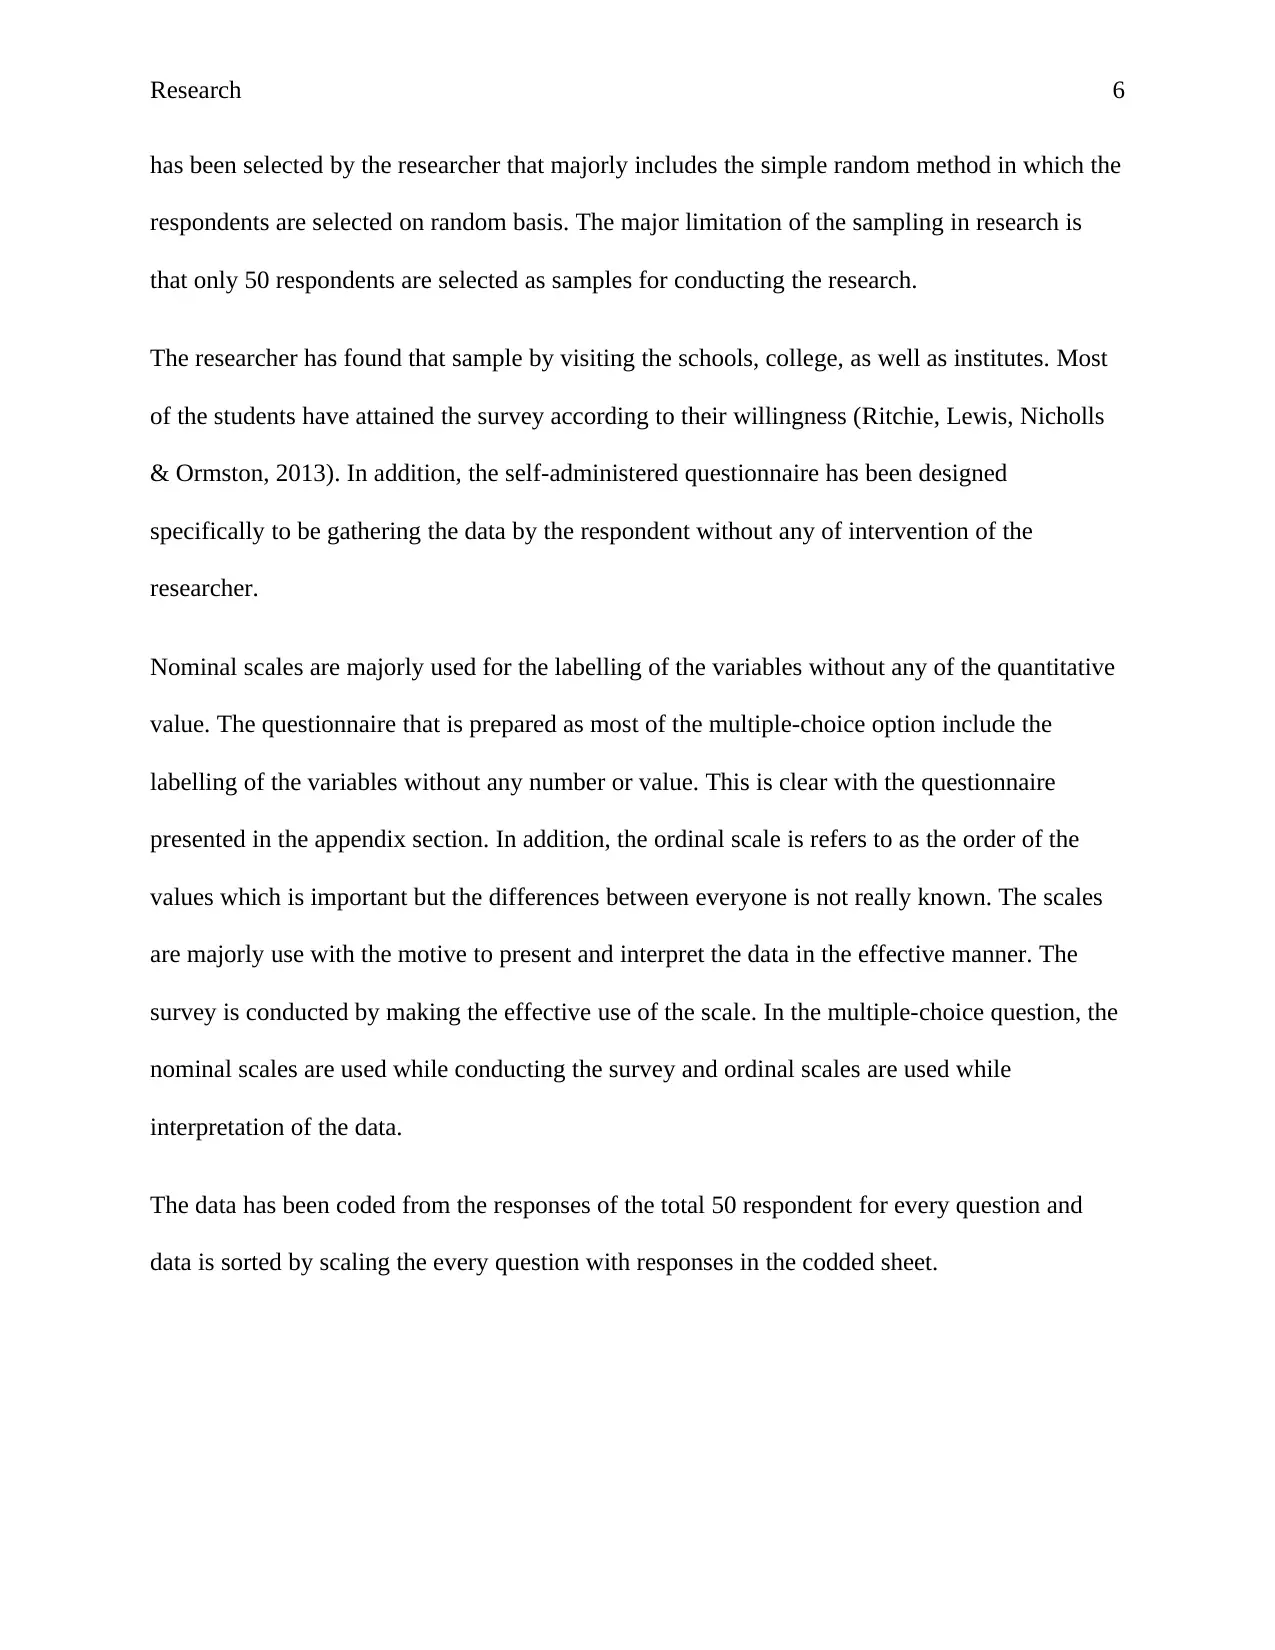
has been selected by the researcher that majorly includes the simple random method in which the
respondents are selected on random basis. The major limitation of the sampling in research is
that only 50 respondents are selected as samples for conducting the research.
The researcher has found that sample by visiting the schools, college, as well as institutes. Most
of the students have attained the survey according to their willingness (Ritchie, Lewis, Nicholls
& Ormston, 2013). In addition, the self-administered questionnaire has been designed
specifically to be gathering the data by the respondent without any of intervention of the
researcher.
Nominal scales are majorly used for the labelling of the variables without any of the quantitative
value. The questionnaire that is prepared as most of the multiple-choice option include the
labelling of the variables without any number or value. This is clear with the questionnaire
presented in the appendix section. In addition, the ordinal scale is refers to as the order of the
values which is important but the differences between everyone is not really known. The scales
are majorly use with the motive to present and interpret the data in the effective manner. The
survey is conducted by making the effective use of the scale. In the multiple-choice question, the
nominal scales are used while conducting the survey and ordinal scales are used while
interpretation of the data.
The data has been coded from the responses of the total 50 respondent for every question and
data is sorted by scaling the every question with responses in the codded sheet.
Paraphrase This Document
Need a fresh take? Get an instant paraphrase of this document with our AI Paraphraser
Research 7
Analysis of Results
This section of the research includes the analysis of the responses that has been interpret and
evaluated to support the hypothesis. The analysis is based on the survey through questionnaire in
which the entire 20 question has been selected.
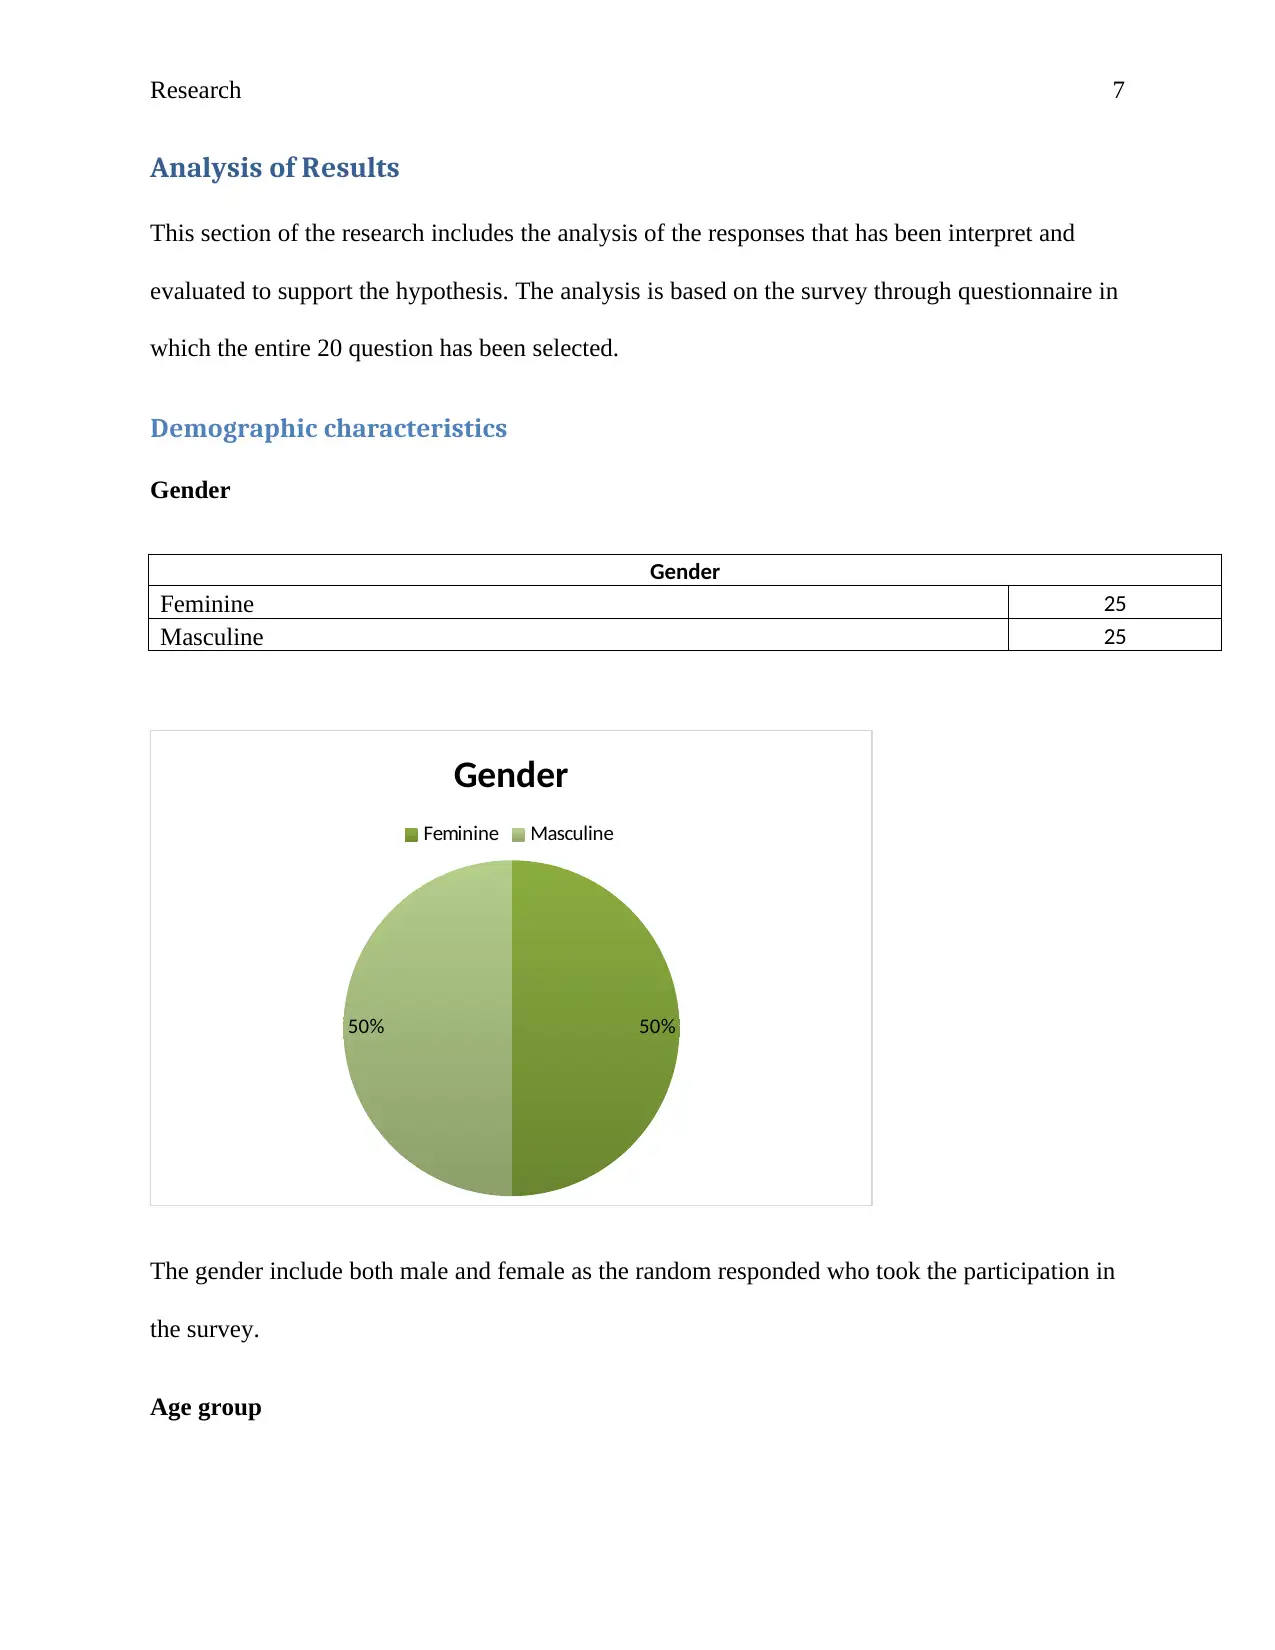
Demographic characteristics
Gender
Gender
Feminine 25
Masculine 25
50%50%
Gender
Feminine Masculine
The gender include both male and female as the random responded who took the participation in
the survey.
Age group
Analysis of Results
This section of the research includes the analysis of the responses that has been interpret and
evaluated to support the hypothesis. The analysis is based on the survey through questionnaire in
which the entire 20 question has been selected.
Demographic characteristics
Gender
Gender
Feminine 25
Masculine 25
50%50%
Gender
Feminine Masculine
The gender include both male and female as the random responded who took the participation in
the survey.
Age group
Research 8
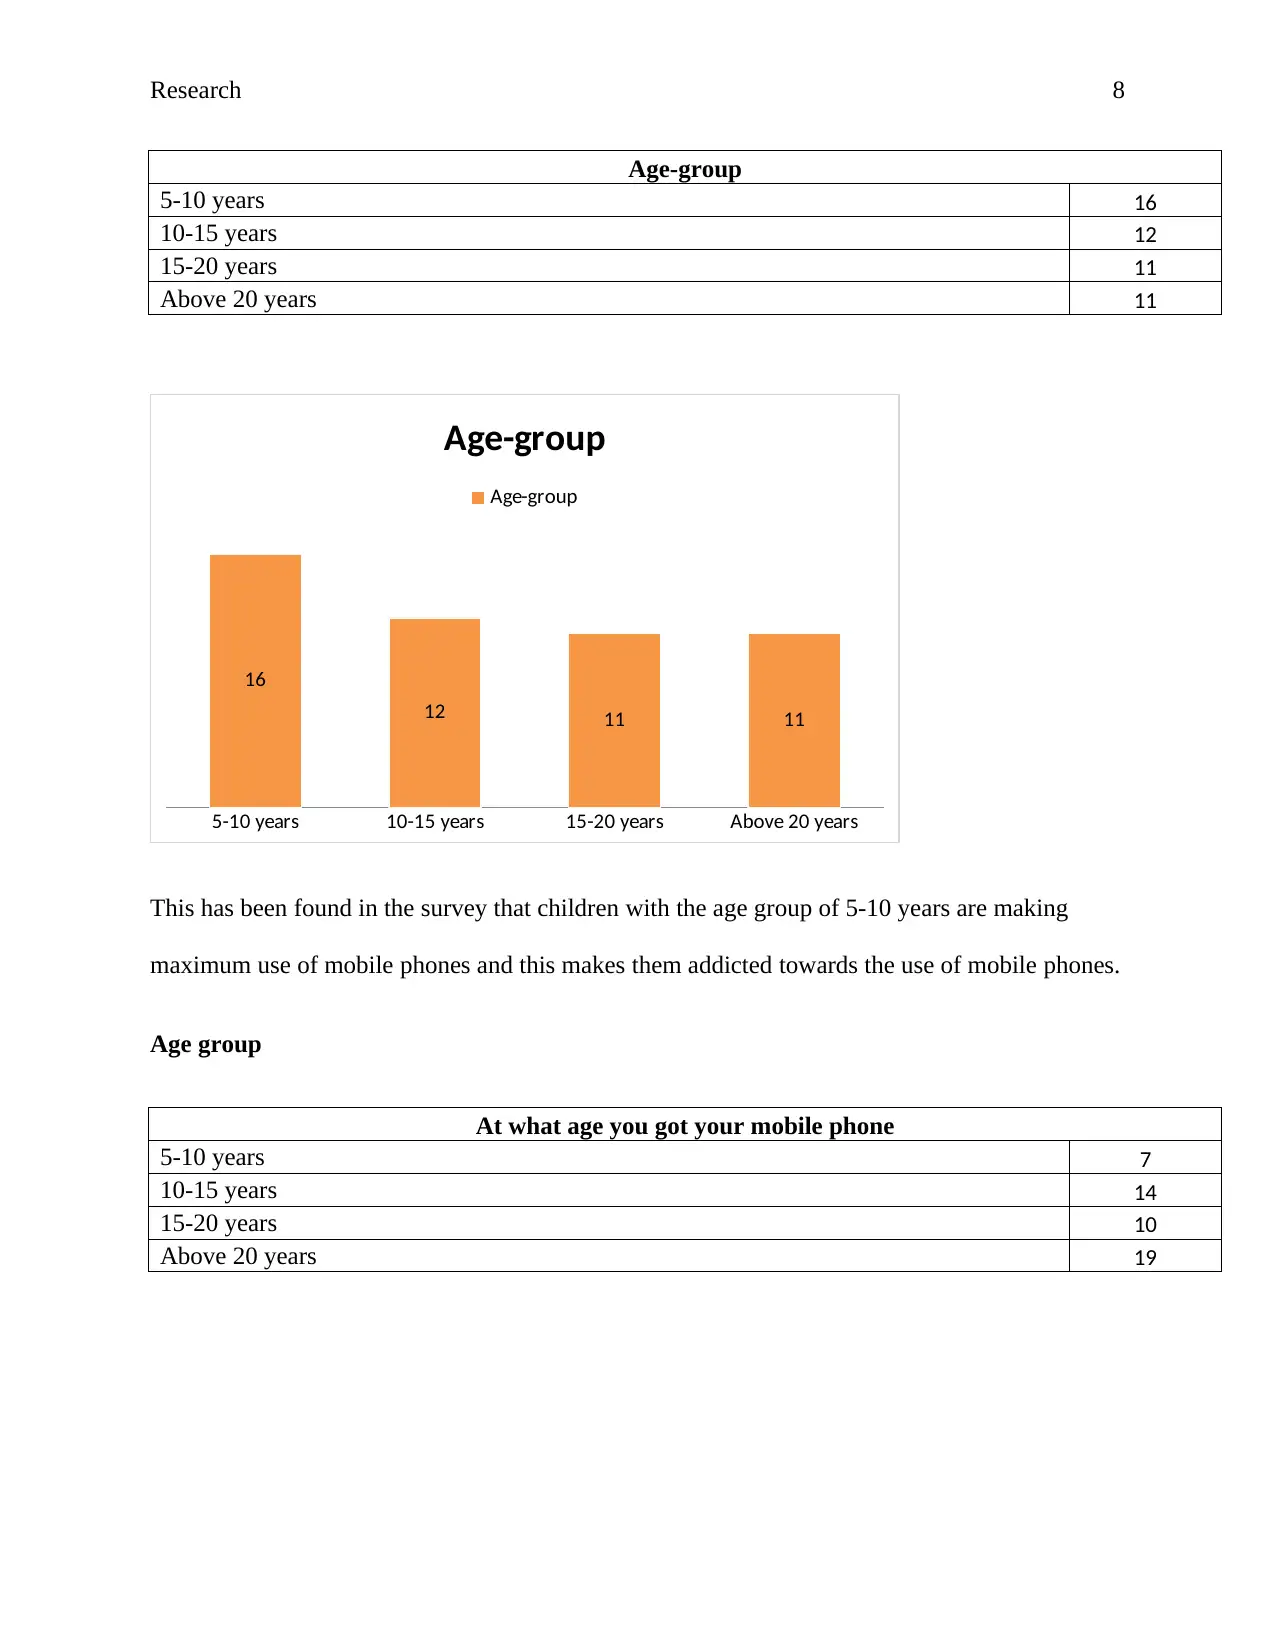
Age-group
5-10 years 16
10-15 years 12
15-20 years 11
Above 20 years 11
5-10 years 10-15 years 15-20 years Above 20 years
16
12 11 11
Age-group
Age-group
This has been found in the survey that children with the age group of 5-10 years are making
maximum use of mobile phones and this makes them addicted towards the use of mobile phones.
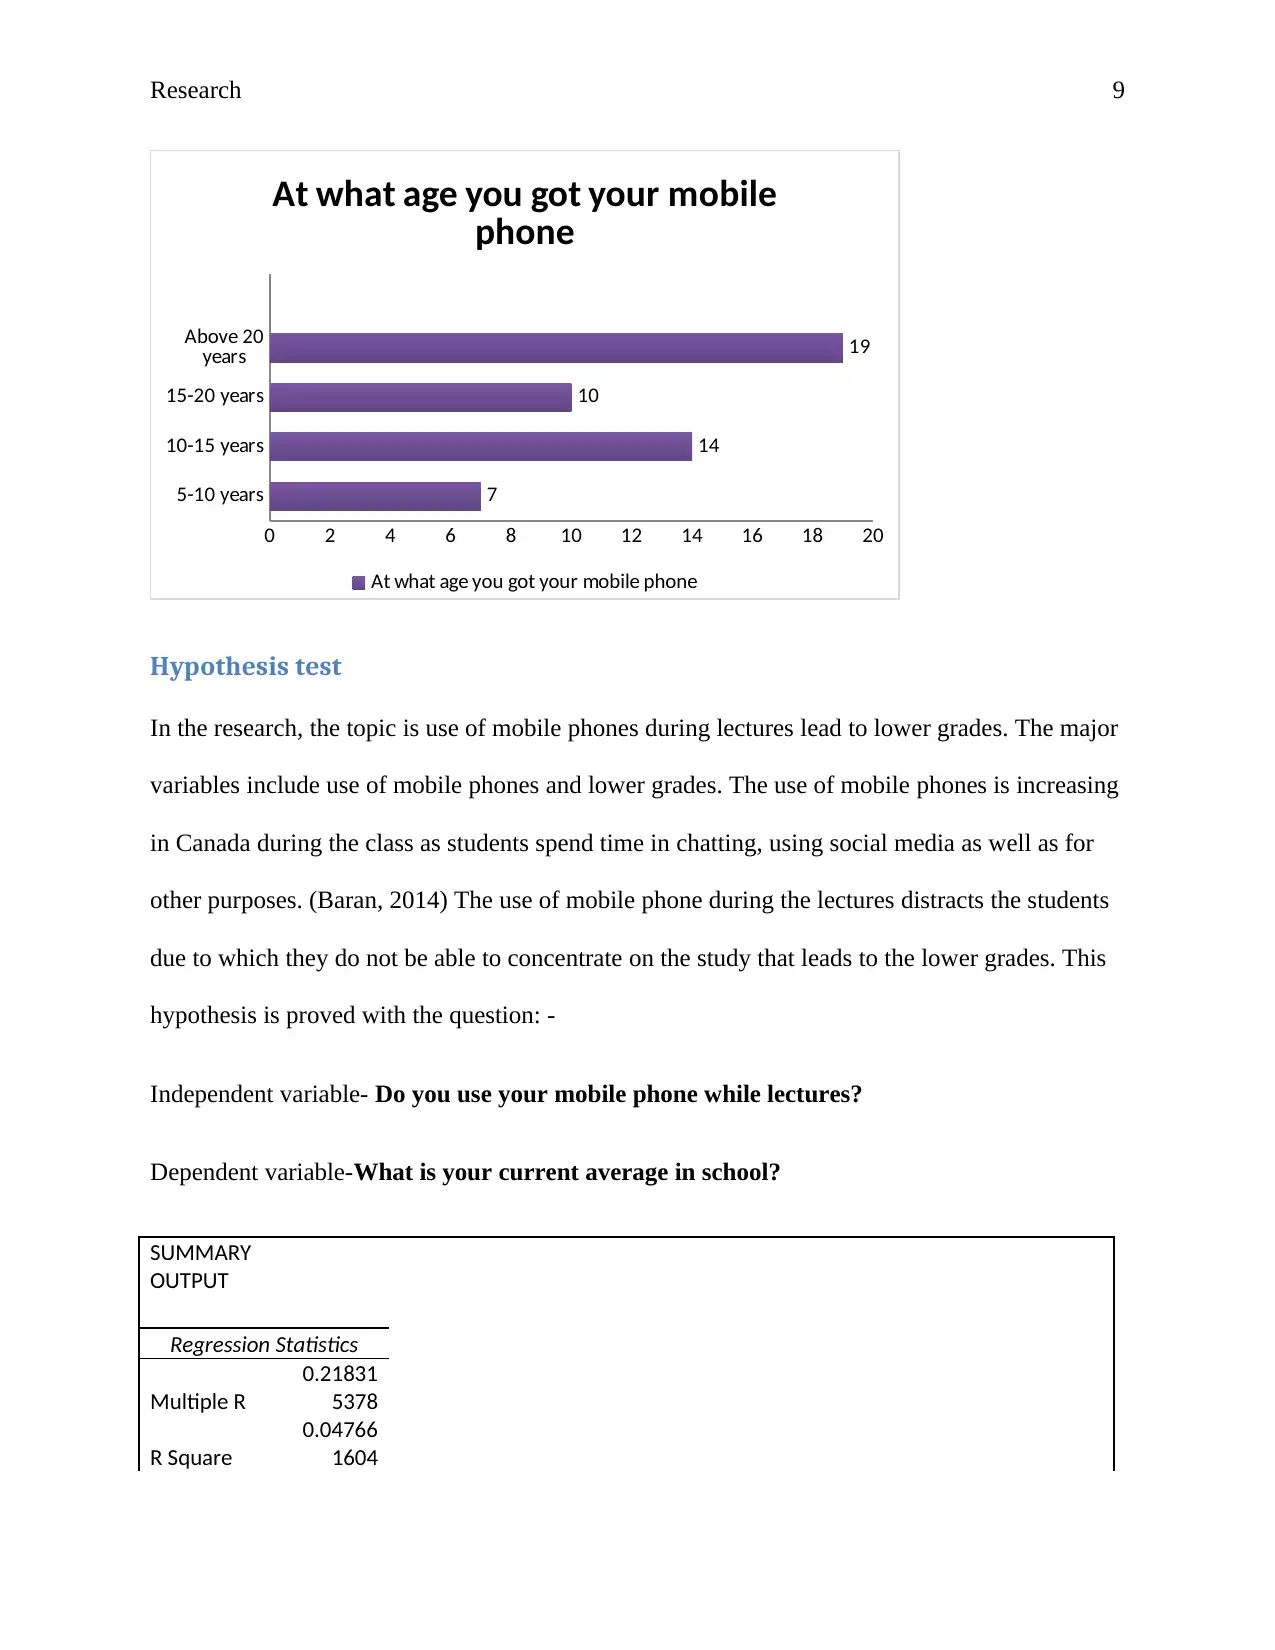
Age group
At what age you got your mobile phone
5-10 years 7
10-15 years 14
15-20 years 10
Above 20 years 19
Age-group
5-10 years 16
10-15 years 12
15-20 years 11
Above 20 years 11
5-10 years 10-15 years 15-20 years Above 20 years
16
12 11 11
Age-group
Age-group
This has been found in the survey that children with the age group of 5-10 years are making
maximum use of mobile phones and this makes them addicted towards the use of mobile phones.
Age group
At what age you got your mobile phone
5-10 years 7
10-15 years 14
15-20 years 10
Above 20 years 19
⊘ This is a preview!⊘
Do you want full access?
Subscribe today to unlock all pages.
Trusted by 1+ million students worldwide
Research 9
5-10 years
10-15 years
15-20 years
Above 20
years
0 2 4 6 8 10 12 14 16 18 20
7
14
10
19
At what age you got your mobile
phone
At what age you got your mobile phone
Hypothesis test
In the research, the topic is use of mobile phones during lectures lead to lower grades. The major
variables include use of mobile phones and lower grades. The use of mobile phones is increasing
in Canada during the class as students spend time in chatting, using social media as well as for
other purposes. (Baran, 2014) The use of mobile phone during the lectures distracts the students
due to which they do not be able to concentrate on the study that leads to the lower grades. This
hypothesis is proved with the question: -
Independent variable- Do you use your mobile phone while lectures?
Dependent variable-What is your current average in school?
SUMMARY
OUTPUT
Regression Statistics
Multiple R
0.21831
5378
R Square
0.04766
1604
Paraphrase This Document
Need a fresh take? Get an instant paraphrase of this document with our AI Paraphraser
Research 10
Adjusted R
Square
0.02782
1221
Standard
Error
1.33568
232
Observations 50
ANOVA
df SS MS F
Significa
nce F
Regression 1
4.285731
463
4.28573
1463
2.40225
2203 0.12773
Residual 48
85.63426
854
1.78404
7261
Total 49 89.92
Coefficie
nts
Standard
Error t Stat P-value
Lower
95%
Upper
95%
Lower
95.0%
Upper
95.0%
Intercept
2.39779
5591
0.455372
606
5.26556
8366
3.24459
E-06
1.48220
8
3.3133
84
1.48220
8
3.31338
3565
X Variable 1
0.32765
5311
0.211401
425
1.54992
0063
0.12772
9618 -0.0974
0.7527
06 -0.0974
0.75270
6357
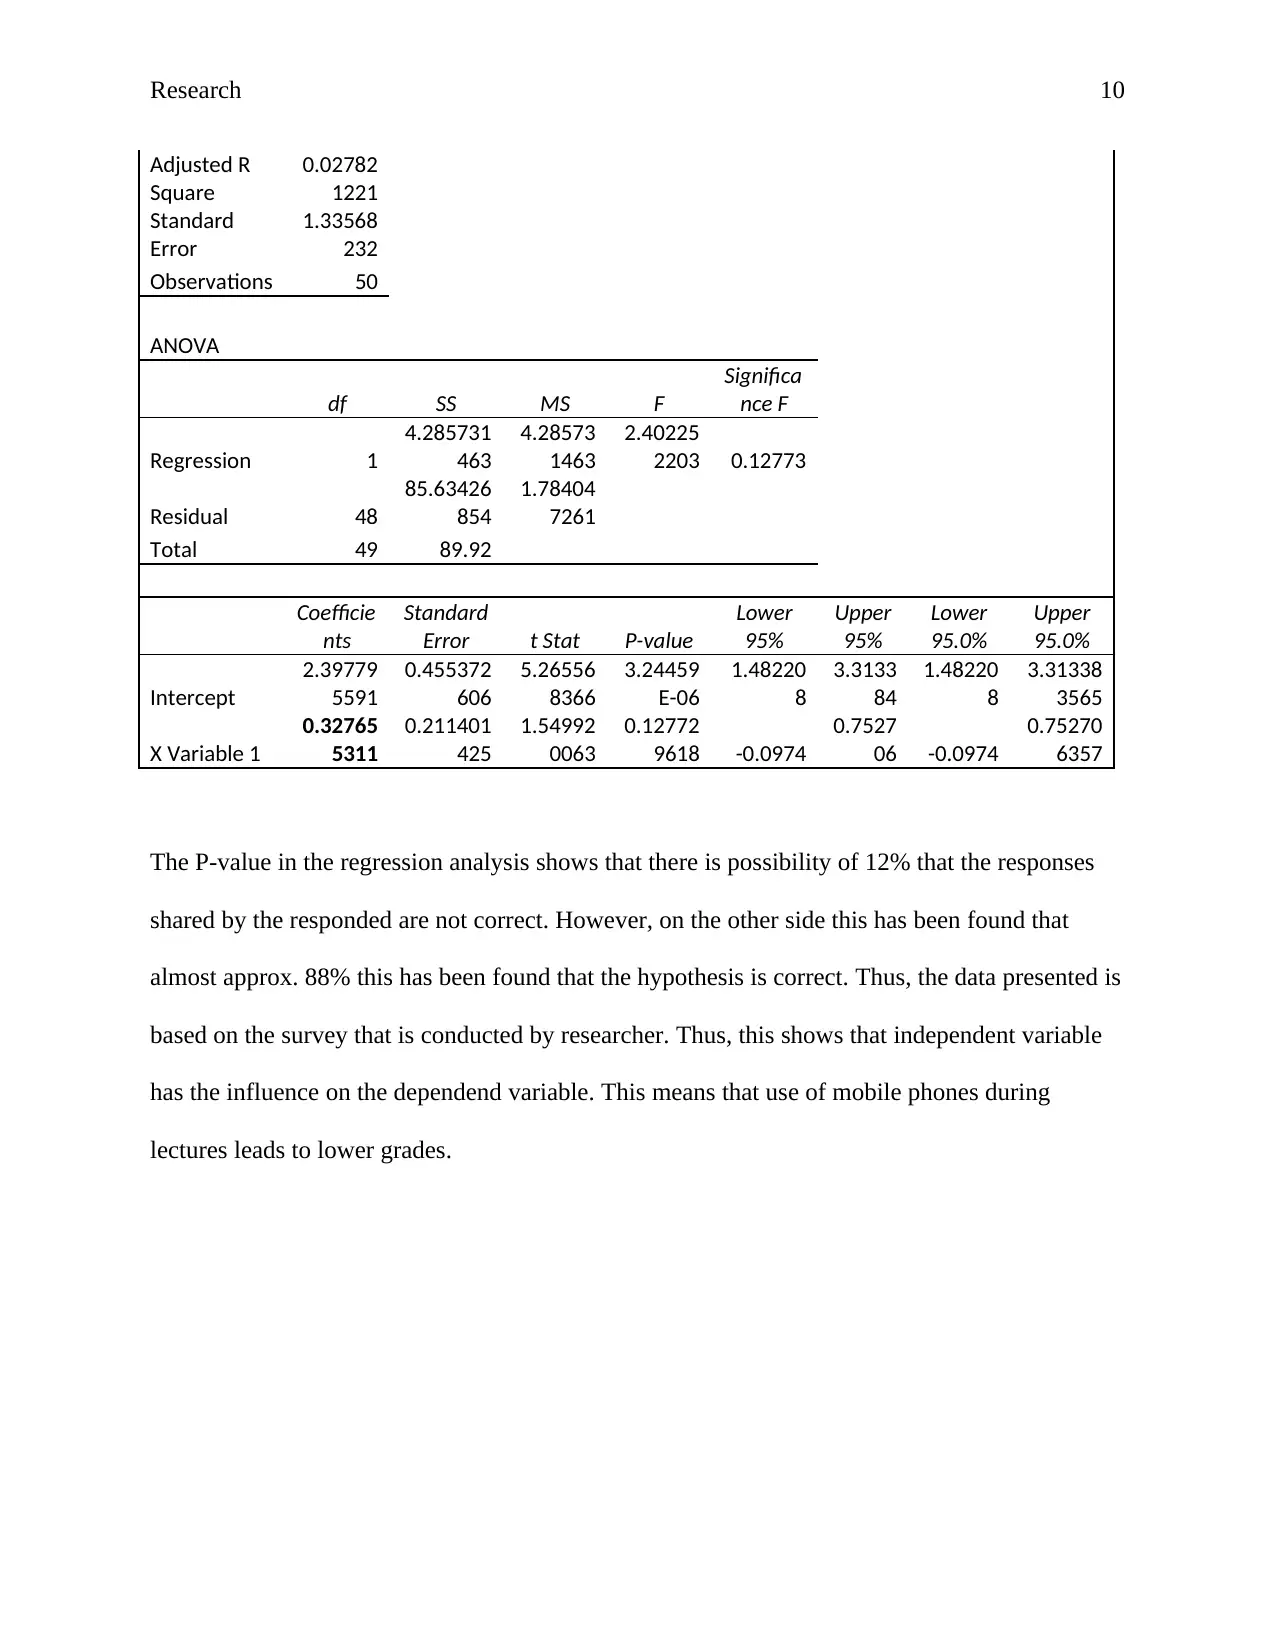
The P-value in the regression analysis shows that there is possibility of 12% that the responses
shared by the responded are not correct. However, on the other side this has been found that
almost approx. 88% this has been found that the hypothesis is correct. Thus, the data presented is
based on the survey that is conducted by researcher. Thus, this shows that independent variable
has the influence on the dependend variable. This means that use of mobile phones during
lectures leads to lower grades.
Adjusted R
Square
0.02782
1221
Standard
Error
1.33568
232
Observations 50
ANOVA
df SS MS F
Significa
nce F
Regression 1
4.285731
463
4.28573
1463
2.40225
2203 0.12773
Residual 48
85.63426
854
1.78404
7261
Total 49 89.92
Coefficie
nts
Standard
Error t Stat P-value
Lower
95%
Upper
95%
Lower
95.0%
Upper
95.0%
Intercept
2.39779
5591
0.455372
606
5.26556
8366
3.24459
E-06
1.48220
8
3.3133
84
1.48220
8
3.31338
3565
X Variable 1
0.32765
5311
0.211401
425
1.54992
0063
0.12772
9618 -0.0974
0.7527
06 -0.0974
0.75270
6357
The P-value in the regression analysis shows that there is possibility of 12% that the responses
shared by the responded are not correct. However, on the other side this has been found that
almost approx. 88% this has been found that the hypothesis is correct. Thus, the data presented is
based on the survey that is conducted by researcher. Thus, this shows that independent variable
has the influence on the dependend variable. This means that use of mobile phones during
lectures leads to lower grades.
Research 11
Conclusion
In the end, this can be said that all the collected data by the researcher support the hypothesis. In
addition to this, there is correlation between the both the variable which is proved with the help
of Annova and regression. Further, the research has been done with the help of survey through
questionnaire.
⊘ This is a preview!⊘
Do you want full access?
Subscribe today to unlock all pages.
Trusted by 1+ million students worldwide
1 out of 19
Related Documents


Your All-in-One AI-Powered Toolkit for Academic Success.
+13062052269
info@desklib.com
Available 24*7 on WhatsApp / Email
![[object Object]](/_next/static/media/star-bottom.7253800d.svg)
Unlock your academic potential
Copyright © 2020–2026 A2Z Services. All Rights Reserved. Developed and managed by ZUCOL.