MGT 610 - Statistical Applications: Social Media and Academics
VerifiedAdded on 2022/03/03
|11
|2404
|74
Report
AI Summary
This report investigates the correlation between mobile social media usage and academic performance among university students. The study, conducted using questionnaires and statistical analyses like regression and correlation, reveals a negative relationship between heavy social media use and GPA. The findings indicate that increased time spent on mobile social media correlates with lower grades, suggesting that social media use may detract from activities that enhance academic performance. The research also highlights students' awareness of the negative impact, even as they continue to use social media extensively. The report includes descriptive statistics, regression analysis, and correlation analysis to support its conclusions, offering valuable insights into the impact of mobile social media on student academic outcomes. The study suggests the need for further research to explore contextual factors and alternative measurement methods for social media use.
The relationship between mobile social media and academic
performance
MGT 610- Statistical Applications in Research and Management
performance
MGT 610- Statistical Applications in Research and Management
Paraphrase This Document
Need a fresh take? Get an instant paraphrase of this document with our AI Paraphraser
Table of Contents
Abstract............................................................................................................................................2
Introduction......................................................................................................................................2
Statement of Research Question......................................................................................................4
Hypothesis.......................................................................................................................................4
Null Hypothesis...........................................................................................................................4
Alternative Hypothesis................................................................................................................4
Analysis...........................................................................................................................................5
Descriptive Statistics...................................................................................................................5
Regression Analysis.....................................................................................................................7
Correlation Analysis....................................................................................................................8
Conclusion.......................................................................................................................................9
References......................................................................................................................................12
Abstract
This study examined the relationship between social media use and academic
performance. Self-administered questionnaires were distributed to a sample of university
students in Kuwait. Results show that heavy mobile social media usage is positively related to
lower GPA. The strong linear relationship suggests the more students use social media the lower
their grades will be. Results also show participants were aware social media usage is lowering
their grades, yet they continue to use them heavily regardless. Future research should consider
the context in which social media are used. It should also explore other ways in which to
measure social media use in addition to self-reports.
Introduction
The use of mobile phones among young adults has reached saturation levels. Almost all
college students in developed and many developing countries own a mobile phone. Most of these
devices are "smart" meaning they are much more than just telephones or texting devices. The
traditional distinction between computers and telephones has all but disappeared. For example, in
the United States, a court of appeals has ruled that smart phones, from a legal viewpoint, are
essentially computers (United States vs. Kramer, 2011). In terms of the services they provide,
mobile phones perform many of the same functions as an Internet connected desktop computer,
and in some instances even more. For example, the visual blogging application Instagram allows
users to post images from a handheld device such as a mobile phone or a tablet, but not on a
conventional personal computer. Today's mobile phones use a remarkable collection of software
driven applications such as video conferencing, micro-blogging, watch and share videos, social
networking and playing video games. In contrast to the conventional view of the computer, the
⊘ This is a preview!⊘
Do you want full access?
Subscribe today to unlock all pages.
Trusted by 1+ million students worldwide
mobile nature of the smart phone allows these services to be utilized anytime anywhere. In light
of the fact that smart phones are within easy reach of nearly everyone, it is worth taking into
consideration what influence they may have on the users' attitudes and behavioral outcomes. It
may be that mobile phone use has consequences for human behavior which reaches far beyond
the area of communication. For instance, research by Lepp et al. (2013) discovered that mobile
phone use was negatively related to an objective measure of physical fitness among a sample of
typical university students. This finding suggests that high mobile phone users were less fit than
low mobile phone users. The implication here is that mobile phone use occurs at the expense of
performing physical activity, causing high users to be more sedentary compared to low users.
Furthermore, the same study found that mobile phone use may negatively affect a students'
academic performance as many of them tend to use their mobile phone during class time or while
studying.
More than a few researchers have singled out multi-tasking to account for the negative
correlation between mobile phone use and academic achievement (Jacobsen & Forste, 2011;
Junco & Cotton, 2011; Rosen et al., 2013; Wood et al., 2012). Jacobsen & Forste (2011) found
that over 60% of college students in their study used mobile devices while in class, studying or
doing homework. Similarly, Sanchez and Otero (2009) reported that despite the fact that mobile
phone use was prohibited in the classroom, half of the students in their study reported bringing
their mobile device to school and keeping it on during class. In their research specifically
designed to study multi-tasking and academic performance, Junco and Cotton (2011) looked at
large samples of university students and discovered that sending text messages and using
Facebook while studying or doing homework were commonplace
Paraphrase This Document
Need a fresh take? Get an instant paraphrase of this document with our AI Paraphraser
Statement of Research Question
In order to find out the relationship between the extended usage of social media among
college students and their academic performance, this study will answer the following questions:
To what extent do undergraduate students use social media for academic-related purposes? How
do students perceive the impact of social media on their academic engagement and performance?
What is the relationship between academic performance and use of social media? Is there an
association between social networking addiction and academic achievement? In addition, Does
the social networking addiction have a negative and significant correlation with academic
performance?
Hypothesis
The purpose of the study is to examine the role of social media in students’ academic
endeavors and ultimately their academic performance through their reported perceptions and
reflections. It also seeks to examine factors that might influence the nature of this relationship,
and its tentative impact on the academic performance of students. It is expected that the results
will provide a deeper understanding of the phenomenon at hand.
Null Hypothesis
H(0): There is no association between social networking addiction and academic
achievement.
Alternative Hypothesis
H(a): There is an association between social networking addiction and academic
achievement.
Data Collection
Data was collected using primary data set through the distribution of Questionnaire
through Google Forms is used and convenient sample is being used. In this study, random
students were being selected. The reason for choosing the sample is that as the topic is related
with social media and academic performance, so the students of higher education are taken as
they mostly use phones and laptops. The 50 questionnaires are distributed to 50 students but only
40 responses could be received. Participant were range from 18 to 27 in the study.
The study used a structured questionnaire to collect information on 345 students from
Mawlana Bhashani science and Technology University by simple random sampling. Univariate
analysis was used to explore the student characteristics and multiple regression analysis was used
to show the influence of social media on students’ academic performance. The important
variables considered in this study are Average Study Time (Hours per day), Time spent on
Facebook, Time spent on YouTube and Time spent on WhatSapp. SPSS and Microsoft office
was used as software
Analysis
Descriptive Statistics
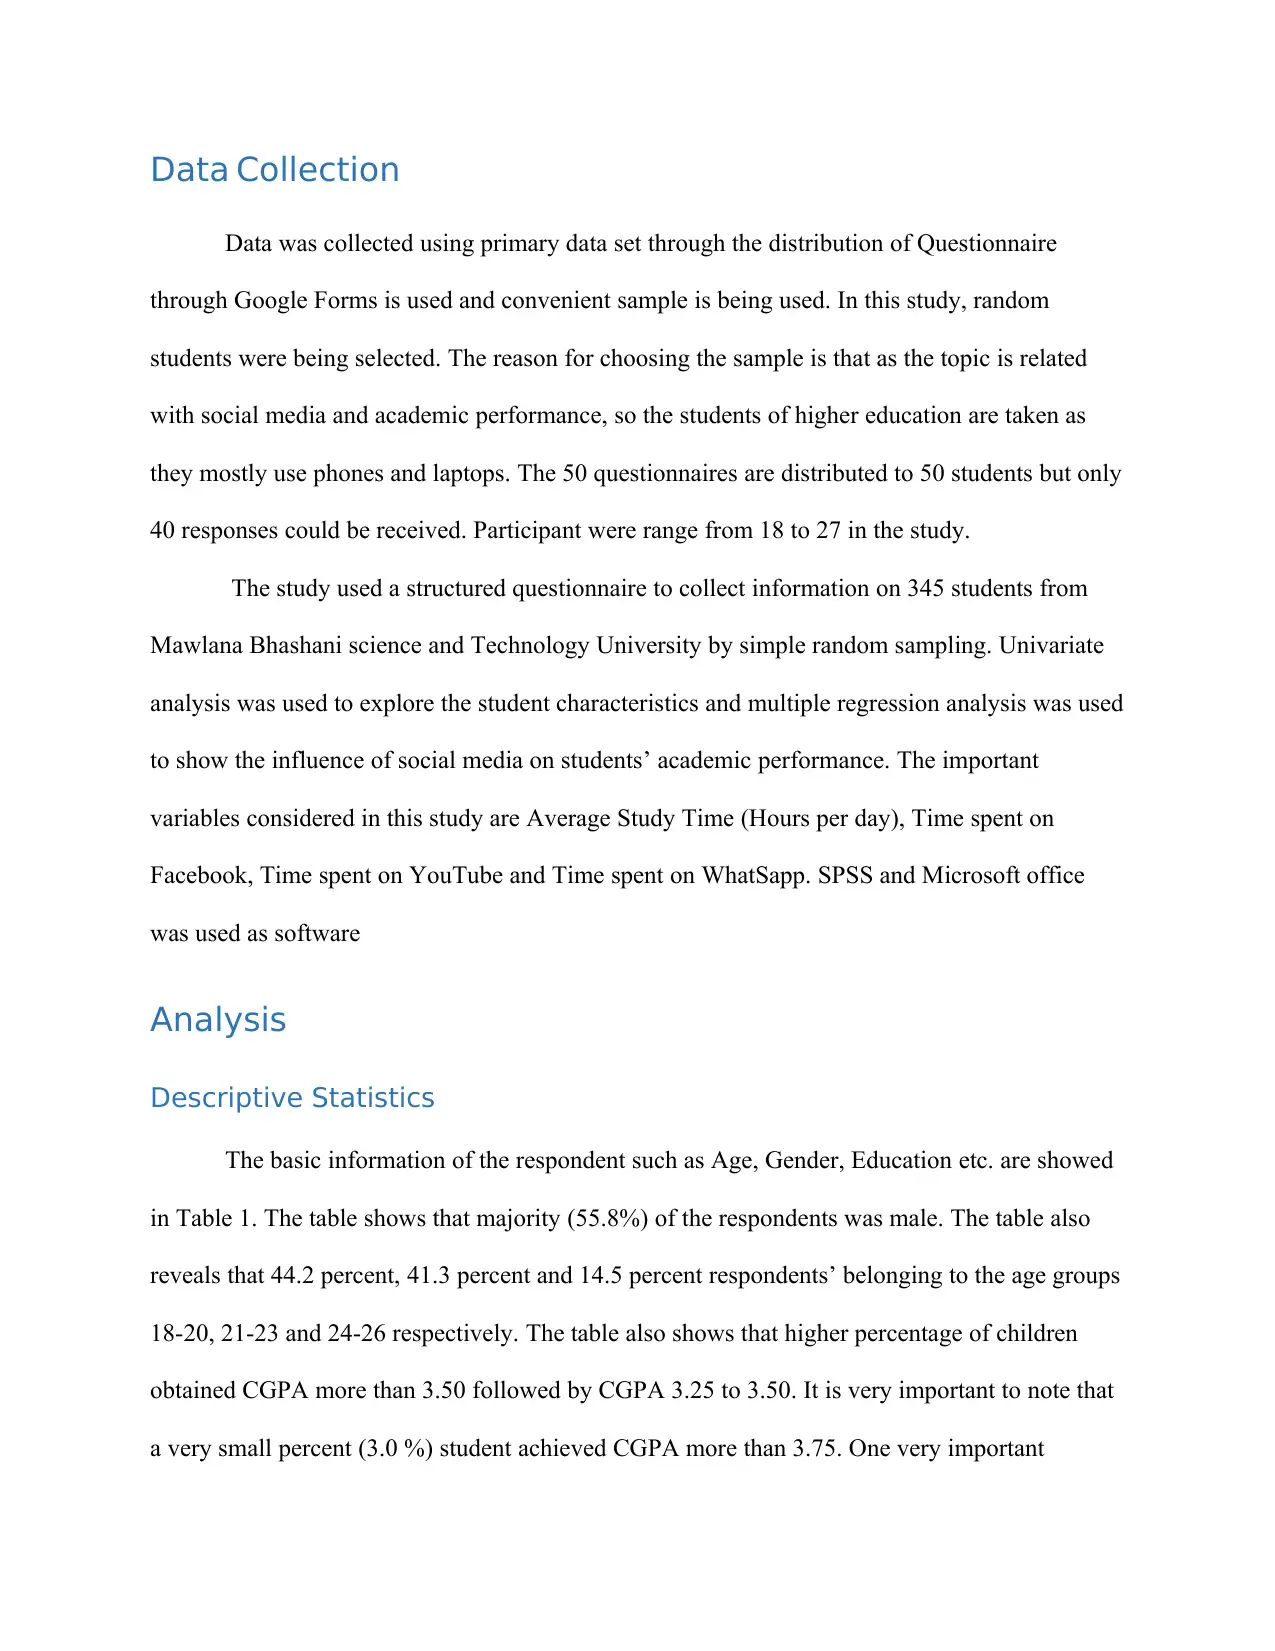
The basic information of the respondent such as Age, Gender, Education etc. are showed
in Table 1. The table shows that majority (55.8%) of the respondents was male. The table also
reveals that 44.2 percent, 41.3 percent and 14.5 percent respondents’ belonging to the age groups
18-20, 21-23 and 24-26 respectively. The table also shows that higher percentage of children
obtained CGPA more than 3.50 followed by CGPA 3.25 to 3.50. It is very important to note that
a very small percent (3.0 %) student achieved CGPA more than 3.75. One very important
Data was collected using primary data set through the distribution of Questionnaire
through Google Forms is used and convenient sample is being used. In this study, random
students were being selected. The reason for choosing the sample is that as the topic is related
with social media and academic performance, so the students of higher education are taken as
they mostly use phones and laptops. The 50 questionnaires are distributed to 50 students but only
40 responses could be received. Participant were range from 18 to 27 in the study.
The study used a structured questionnaire to collect information on 345 students from
Mawlana Bhashani science and Technology University by simple random sampling. Univariate
analysis was used to explore the student characteristics and multiple regression analysis was used
to show the influence of social media on students’ academic performance. The important
variables considered in this study are Average Study Time (Hours per day), Time spent on
Facebook, Time spent on YouTube and Time spent on WhatSapp. SPSS and Microsoft office
was used as software
Analysis
Descriptive Statistics
The basic information of the respondent such as Age, Gender, Education etc. are showed
in Table 1. The table shows that majority (55.8%) of the respondents was male. The table also
reveals that 44.2 percent, 41.3 percent and 14.5 percent respondents’ belonging to the age groups
18-20, 21-23 and 24-26 respectively. The table also shows that higher percentage of children
obtained CGPA more than 3.50 followed by CGPA 3.25 to 3.50. It is very important to note that
a very small percent (3.0 %) student achieved CGPA more than 3.75. One very important
⊘ This is a preview!⊘
Do you want full access?
Subscribe today to unlock all pages.
Trusted by 1+ million students worldwide
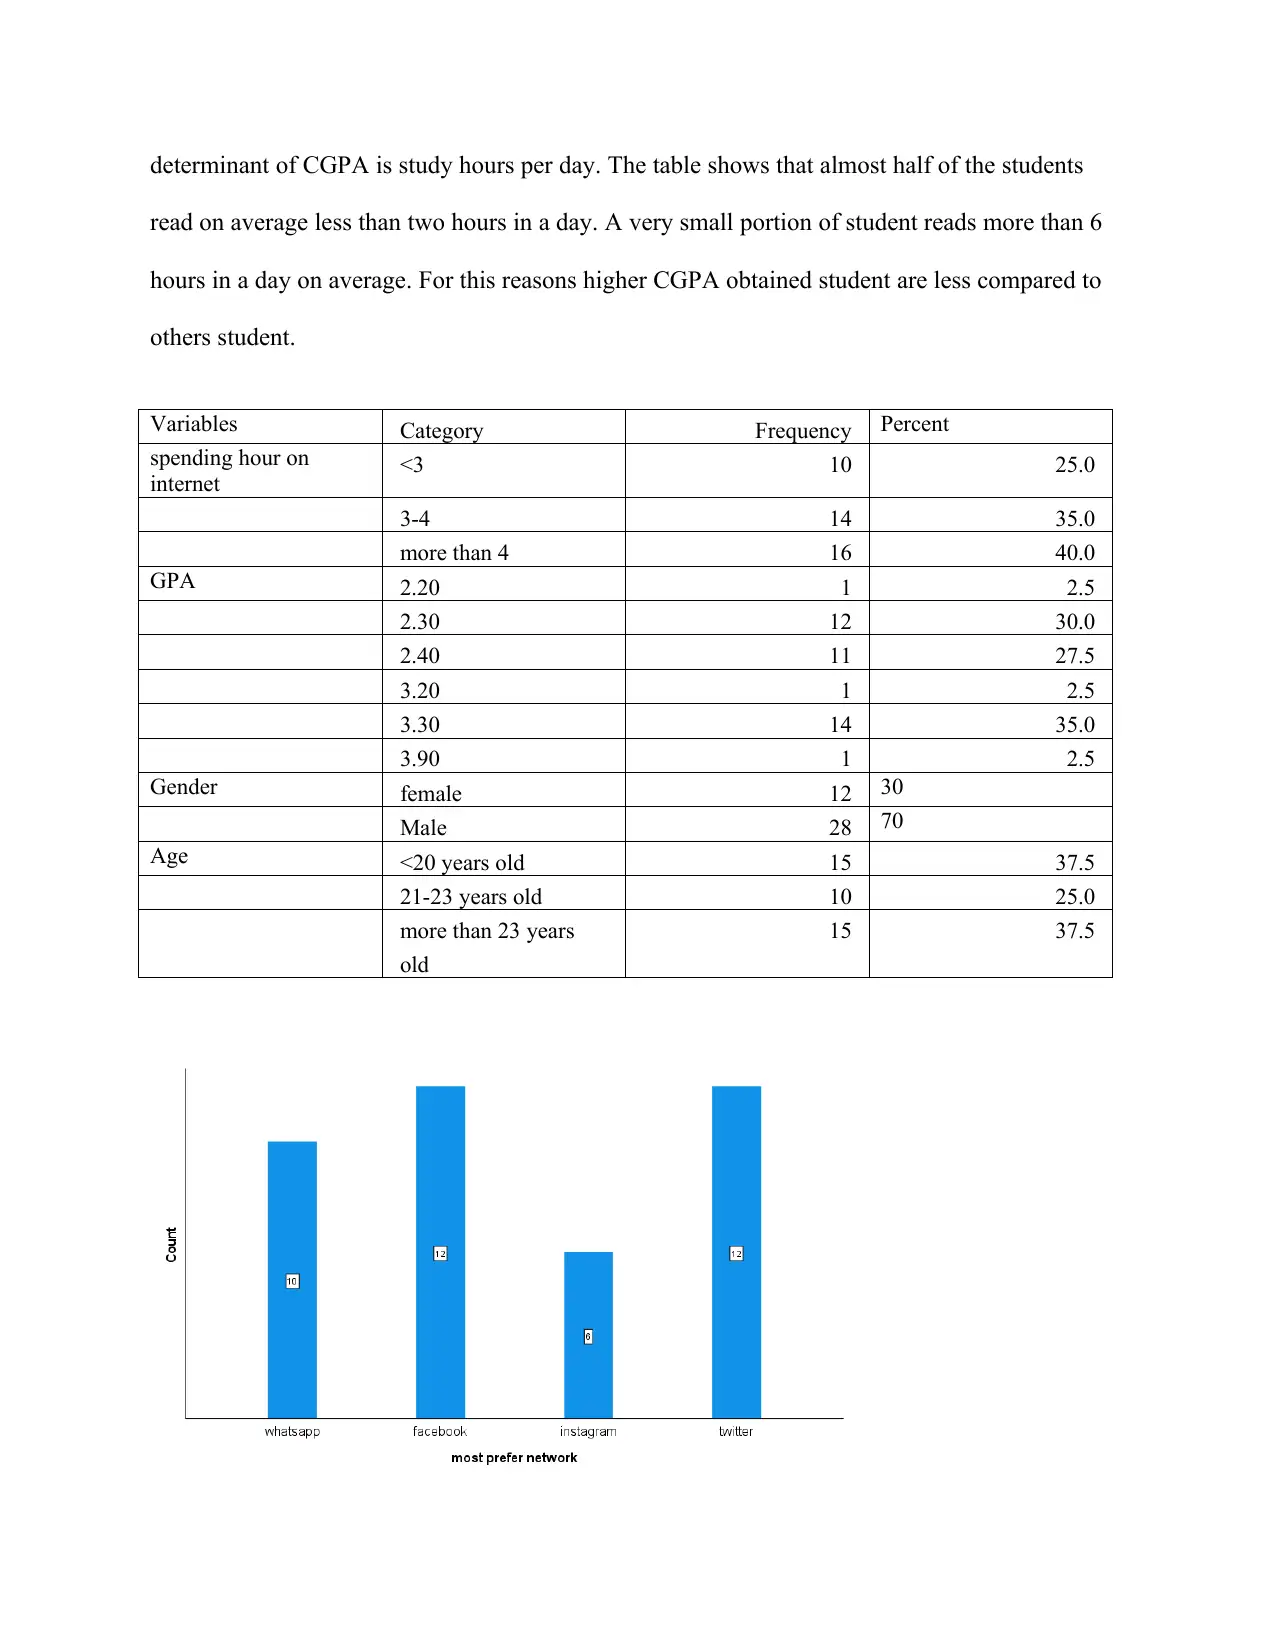
determinant of CGPA is study hours per day. The table shows that almost half of the students
read on average less than two hours in a day. A very small portion of student reads more than 6
hours in a day on average. For this reasons higher CGPA obtained student are less compared to
others student.
Variables Category Frequency Percent
spending hour on
internet <3 10 25.0
3-4 14 35.0
more than 4 16 40.0
GPA 2.20 1 2.5
2.30 12 30.0
2.40 11 27.5
3.20 1 2.5
3.30 14 35.0
3.90 1 2.5
Gender female 12 30
Male 28 70
Age <20 years old 15 37.5
21-23 years old 10 25.0
more than 23 years
old
15 37.5
Paraphrase This Document
Need a fresh take? Get an instant paraphrase of this document with our AI Paraphraser
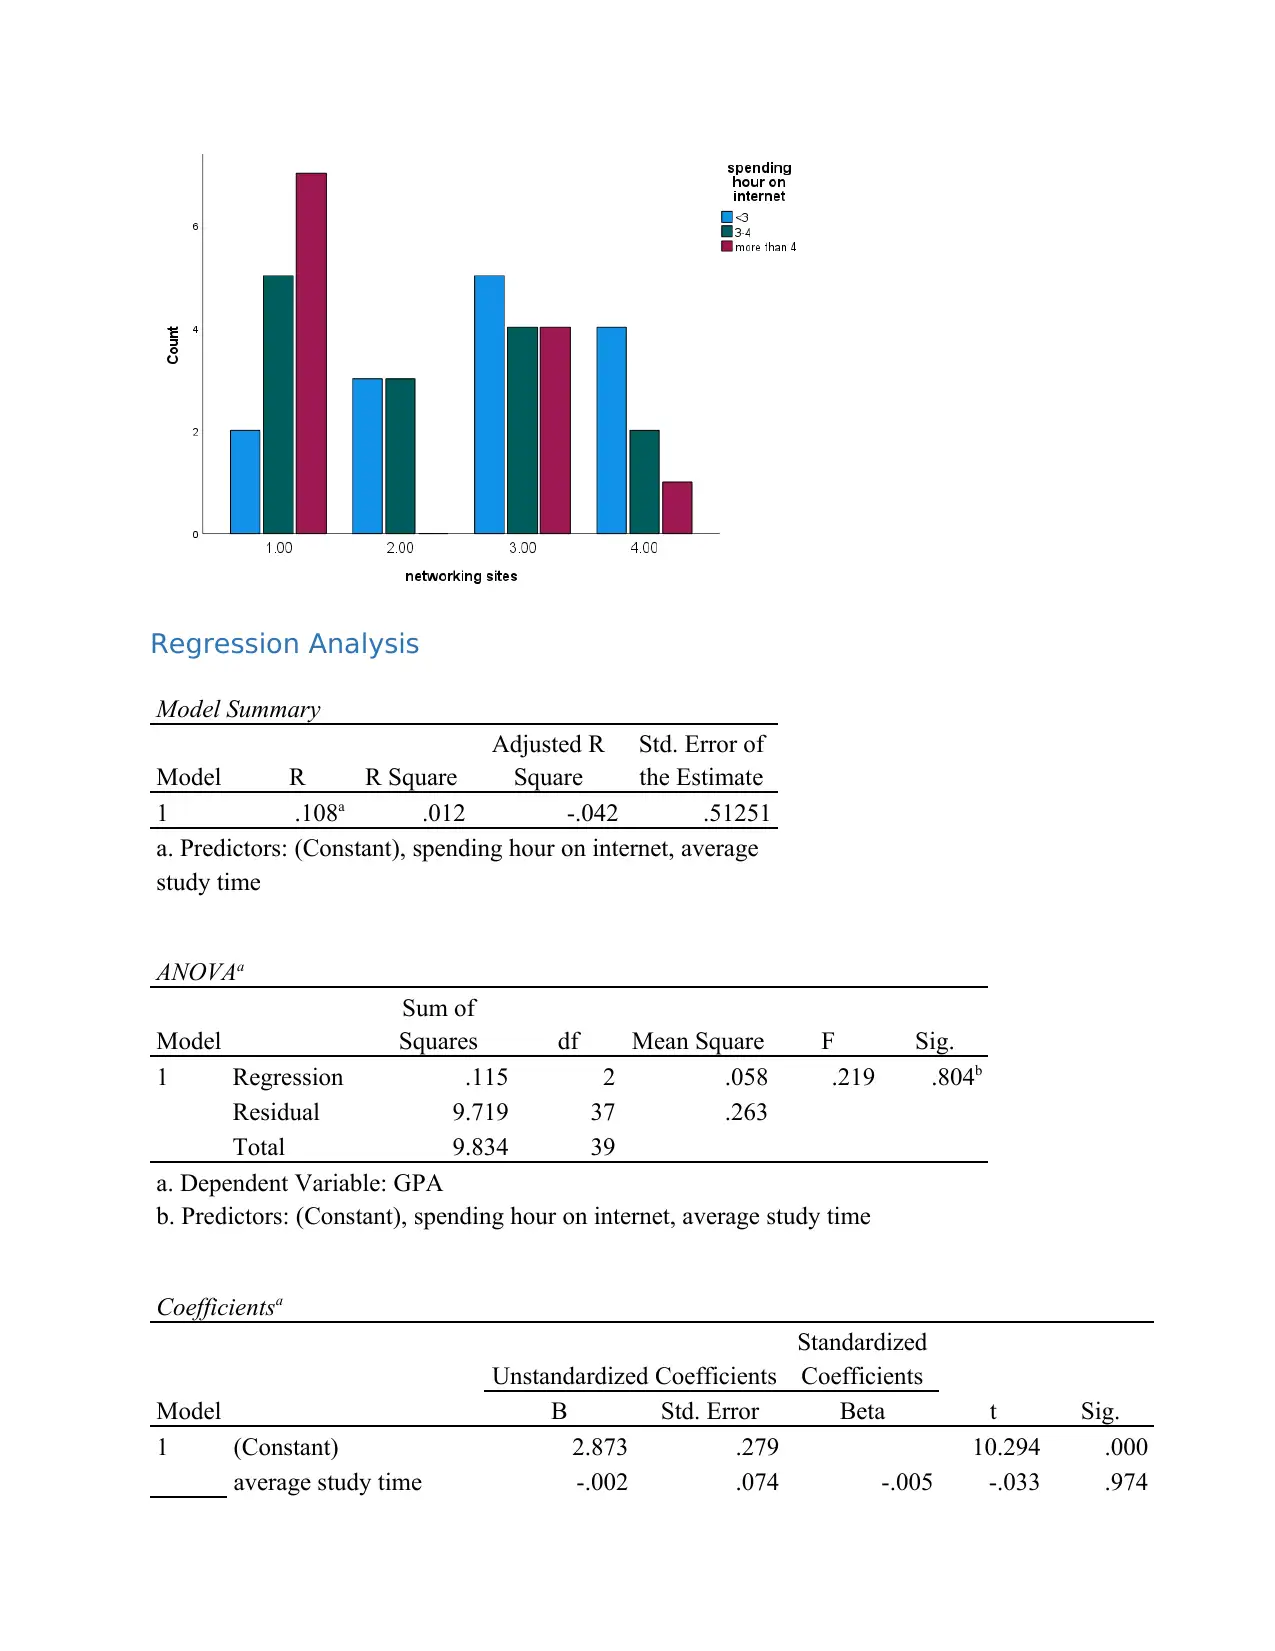
Regression Analysis
Model Summary
Model R R Square
Adjusted R
Square
Std. Error of
the Estimate
1 .108a .012 -.042 .51251
a. Predictors: (Constant), spending hour on internet, average
study time
ANOVAa
Model
Sum of
Squares df Mean Square F Sig.
1 Regression .115 2 .058 .219 .804b
Residual 9.719 37 .263
Total 9.834 39
a. Dependent Variable: GPA
b. Predictors: (Constant), spending hour on internet, average study time
Coefficientsa
Model
Unstandardized Coefficients
Standardized
Coefficients
t Sig.B Std. Error Beta
1 (Constant) 2.873 .279 10.294 .000
average study time -.002 .074 -.005 -.033 .974
spending hour on
internet
-.067 .101 -.108 -.660 .513
a. Dependent Variable: GPA
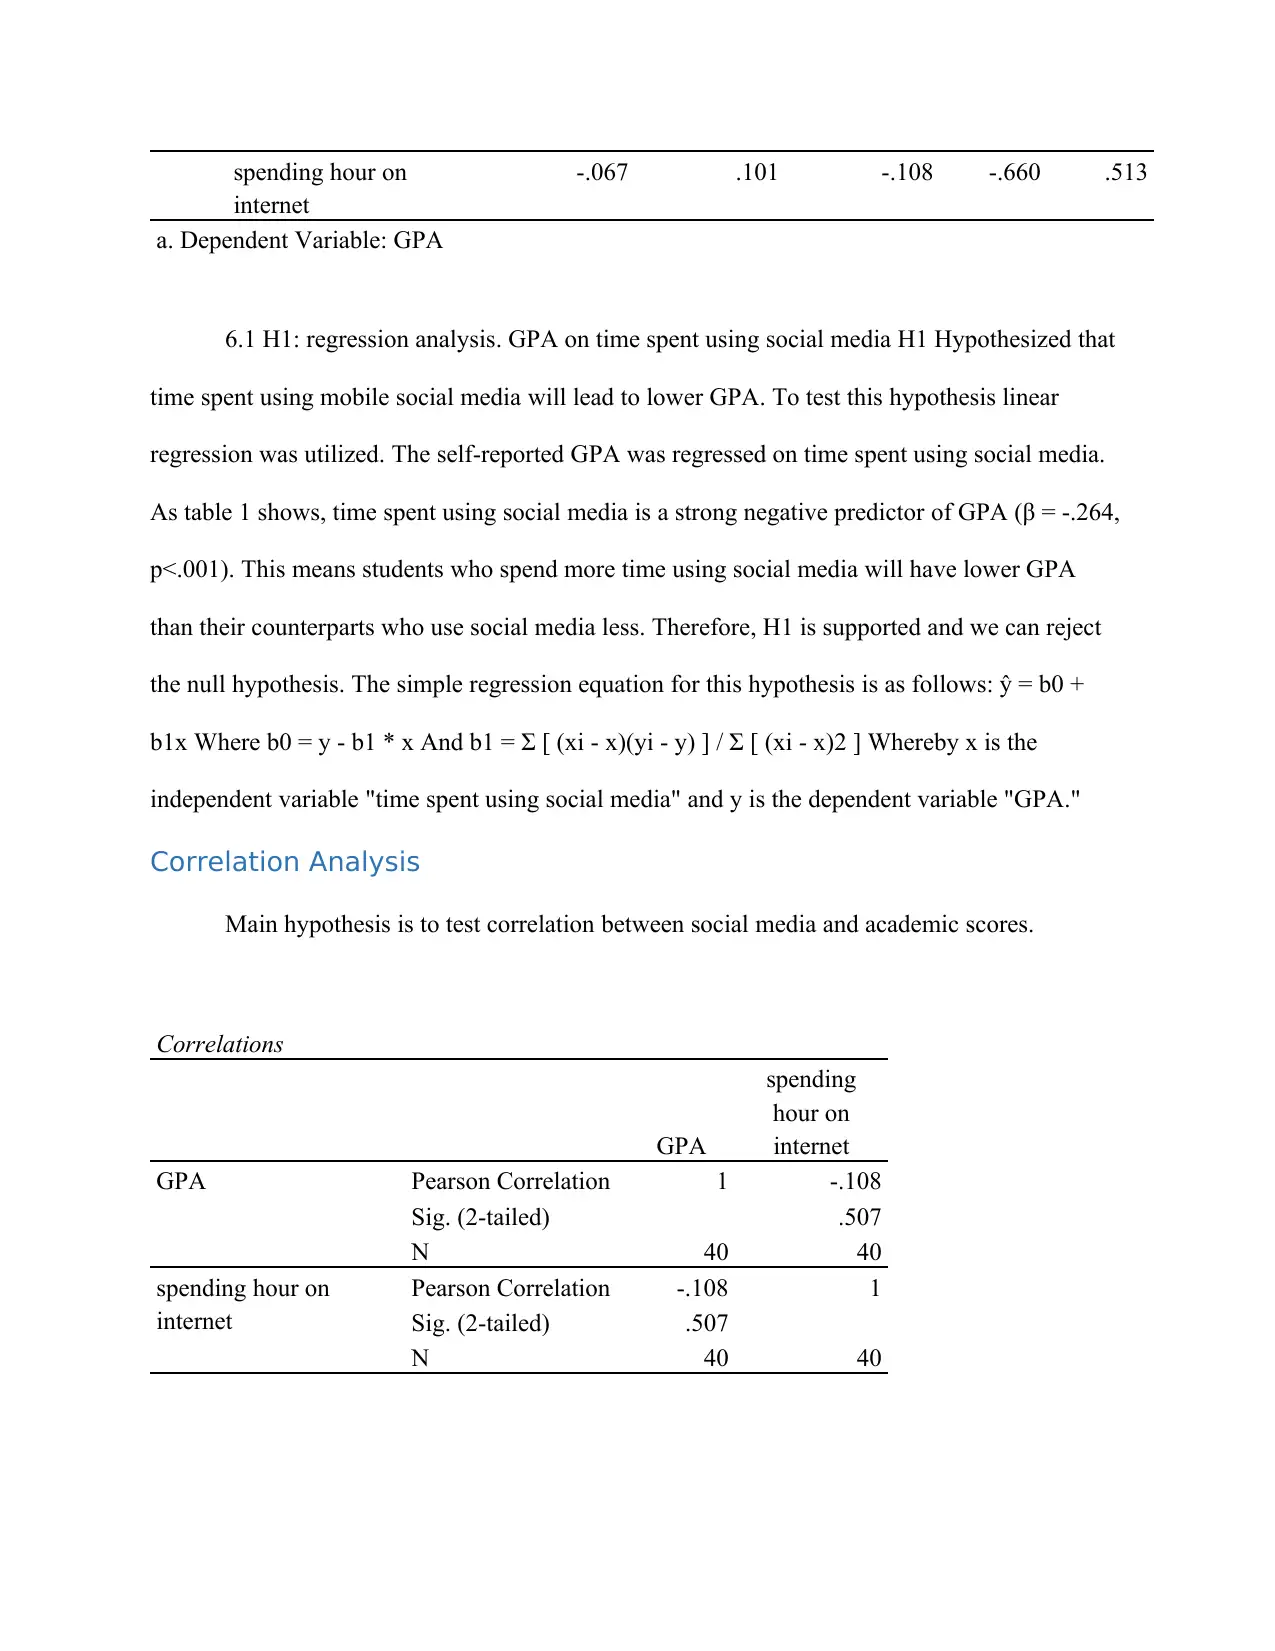
6.1 H1: regression analysis. GPA on time spent using social media H1 Hypothesized that
time spent using mobile social media will lead to lower GPA. To test this hypothesis linear
regression was utilized. The self-reported GPA was regressed on time spent using social media.
As table 1 shows, time spent using social media is a strong negative predictor of GPA (β = -.264,
p˂.001). This means students who spend more time using social media will have lower GPA
than their counterparts who use social media less. Therefore, H1 is supported and we can reject
the null hypothesis. The simple regression equation for this hypothesis is as follows: ŷ = b0 +
b1x Where b0 = y - b1 * x And b1 = Σ [ (xi - x)(yi - y) ] / Σ [ (xi - x)2 ] Whereby x is the
independent variable "time spent using social media" and y is the dependent variable "GPA."
Correlation Analysis
Main hypothesis is to test correlation between social media and academic scores.
Correlations
GPA
spending
hour on
internet
GPA Pearson Correlation 1 -.108
Sig. (2-tailed) .507
N 40 40
spending hour on
internet
Pearson Correlation -.108 1
Sig. (2-tailed) .507
N 40 40
internet
-.067 .101 -.108 -.660 .513
a. Dependent Variable: GPA
6.1 H1: regression analysis. GPA on time spent using social media H1 Hypothesized that
time spent using mobile social media will lead to lower GPA. To test this hypothesis linear
regression was utilized. The self-reported GPA was regressed on time spent using social media.
As table 1 shows, time spent using social media is a strong negative predictor of GPA (β = -.264,
p˂.001). This means students who spend more time using social media will have lower GPA
than their counterparts who use social media less. Therefore, H1 is supported and we can reject
the null hypothesis. The simple regression equation for this hypothesis is as follows: ŷ = b0 +
b1x Where b0 = y - b1 * x And b1 = Σ [ (xi - x)(yi - y) ] / Σ [ (xi - x)2 ] Whereby x is the
independent variable "time spent using social media" and y is the dependent variable "GPA."
Correlation Analysis
Main hypothesis is to test correlation between social media and academic scores.
Correlations
GPA
spending
hour on
internet
GPA Pearson Correlation 1 -.108
Sig. (2-tailed) .507
N 40 40
spending hour on
internet
Pearson Correlation -.108 1
Sig. (2-tailed) .507
N 40 40
⊘ This is a preview!⊘
Do you want full access?
Subscribe today to unlock all pages.
Trusted by 1+ million students worldwide
H3 maintained that time spent using social media will be positively related to assessment
that social media use is causing s student's performance to deteriorate. Table 3 shows the
bivariate correlation between time spent using social media and attribution of failure due to
social media use. A significant positive correlation exists between the two variables in question
(.175 p˂.01). This indicates that those who agree that social media are causing their grades to
deteriorate are also spending a lot of time using social media. This means the student is aware
that social media usage is damaging their academic performance yet they continue to use it
heavily. The reason correlation was used here instead of regression is because there is no
assumption of causality between the two variables, only association. Pearson's correlation
coefficient (r) for this hypothesis is as follows: r = [ 1 / (n - 1) ] * Σ { [ (xi - x) / sx ] * [ (yi - y) /
sy ] } Whereby x is "GPA" and y is "Attribution of failure.
Conclusion
The purpose of this study was to ascertain the impact of social media usage on a students'
academic performance as measured by self-reported GPA. The results indicate that time spent
using social media was a strong negative predictor of GPA. What this tells us is time spent using
social media comes at the expense of activities that could enhance a student's academic
performance. In other words, social media use impedes academic performance in a powerful
way. The strong linear relationship indicates that the more time a student spends using mobile
social media, the lower their GPA will be. This could take shape in a variety of ways. For
example, because social media are mobile, they can be accessed anytime, anywhere including the
classroom. The purpose of this study was to ascertain the impact of social media usage on a
students' academic performance as measured by self-reported GPA. The results indicate that time
spent using social media was a strong negative predictor of GPA. What this tells us is time spent
Paraphrase This Document
Need a fresh take? Get an instant paraphrase of this document with our AI Paraphraser
using social media comes at the expense of activities that could enhance a student's academic
performance. In other words, social media use impedes academic performance in a powerful
way. The strong linear relationship indicates that the more time a student spends using mobile
social media, the lower their GPA will be. This could take shape in a variety of ways. For
example, because social media are mobile, they can be accessed anytime, anywhere including the
classroom. A third hypothesis looked at the relationship between the two main independent
variables, "time spent using social media" and "attribution of failure to social media." The
correlation between the two variables is statistically significant indicating that those who spend a
lot of time using social media are more likely than others to attribute academic failure to it. This
means students are not only spending inordinate amount of time using social media, but they also
blame it for their academic underachievement. This offers support to the second hypothesis and
provides further reason to suspect that mobile social media use has addictive attributes. The
nature of the technology allows for addict-like behavior. First, it's available anytime anywhere.
Second, the technology can be used unobtrusively helping users to access it in inappropriate
times like during class sessions without being caught. For example, it is impossible have a voice
phone conversation in a classroom without being noticed. However, it is possible for someone in
a large classroom to carry out an extended chat session on "Whatsapp" using the mute button
without being caught.
1 out of 11
Related Documents


Your All-in-One AI-Powered Toolkit for Academic Success.
+13062052269
info@desklib.com
Available 24*7 on WhatsApp / Email
![[object Object]](/_next/static/media/star-bottom.7253800d.svg)
Unlock your academic potential
Copyright © 2020–2026 A2Z Services. All Rights Reserved. Developed and managed by ZUCOL.