Risk and Return Analysis: A Study of GM and Ford Stocks

Verified

Added on  2022/08/16

|7
|1378
|26
Report
AI Summary
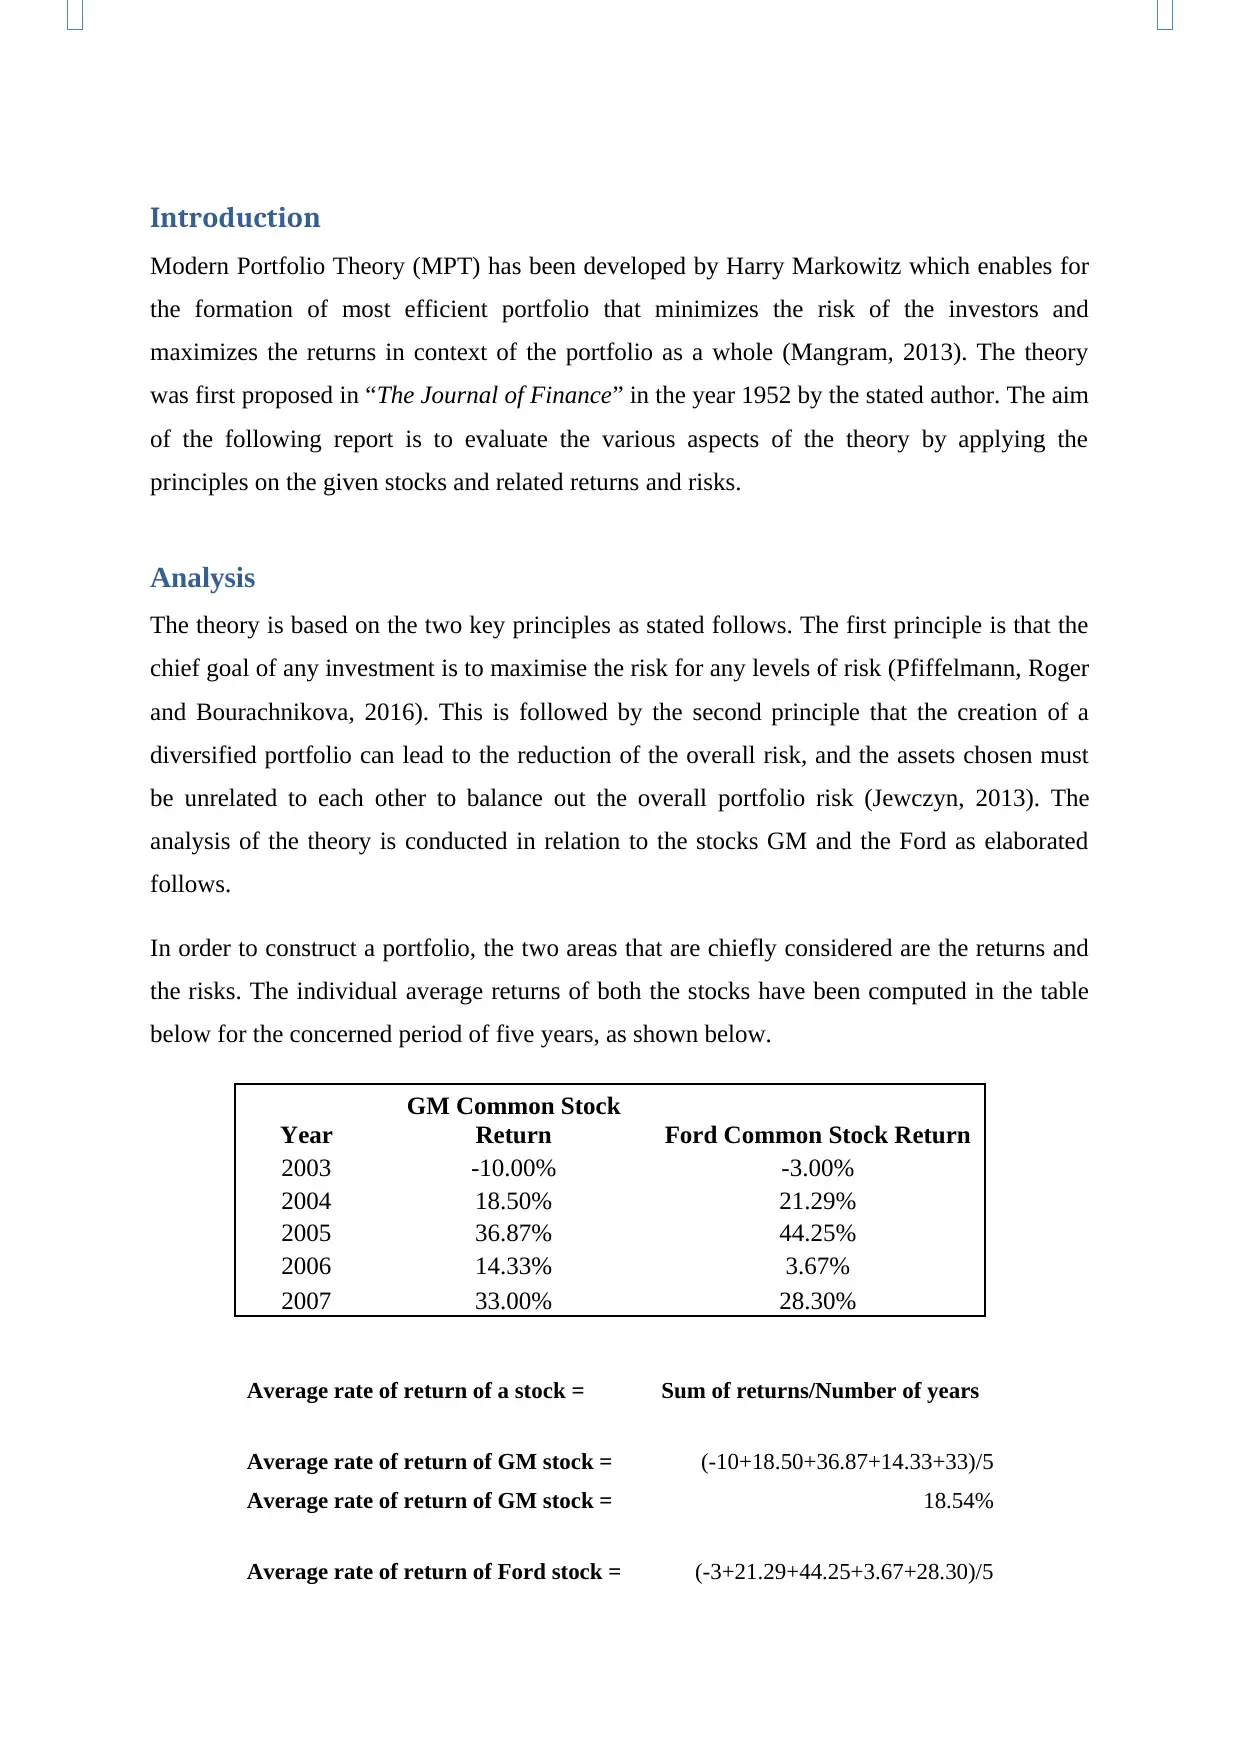
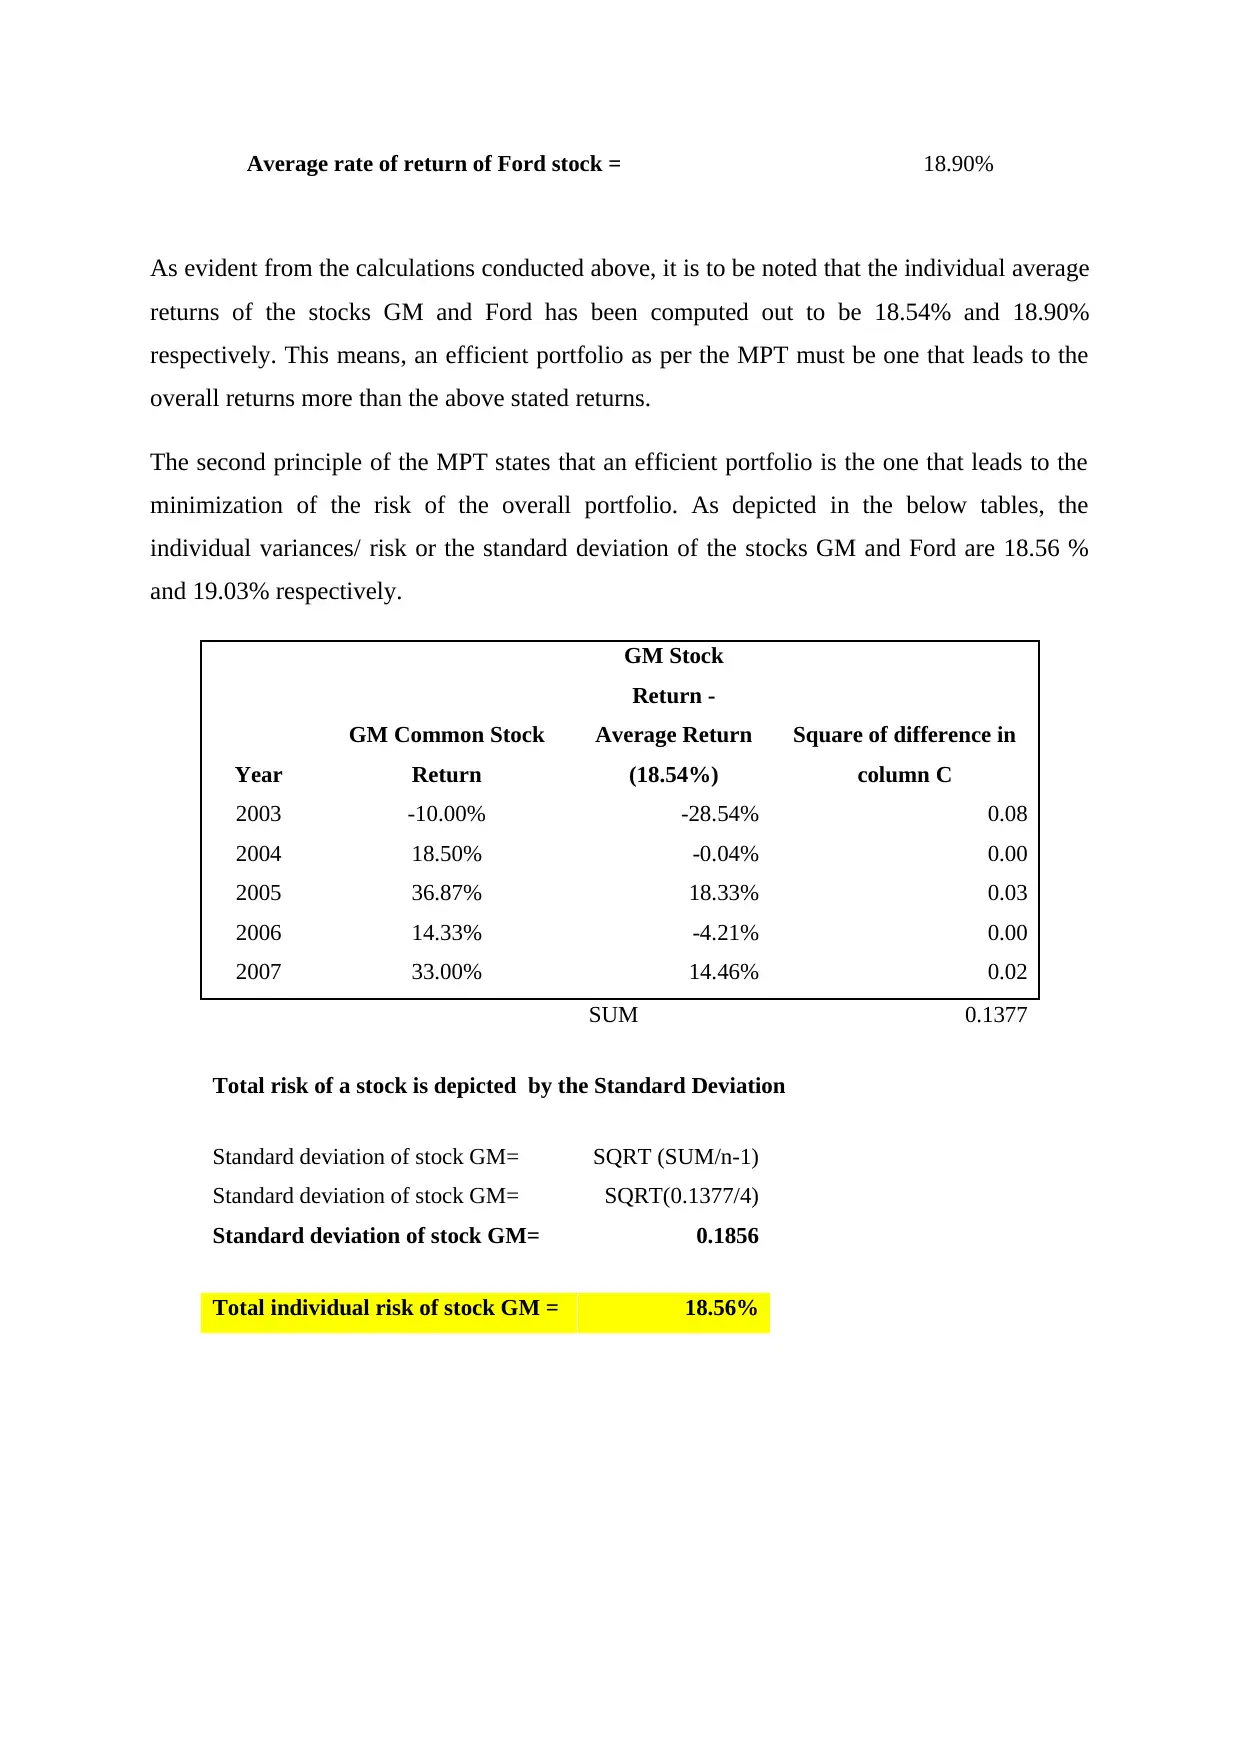
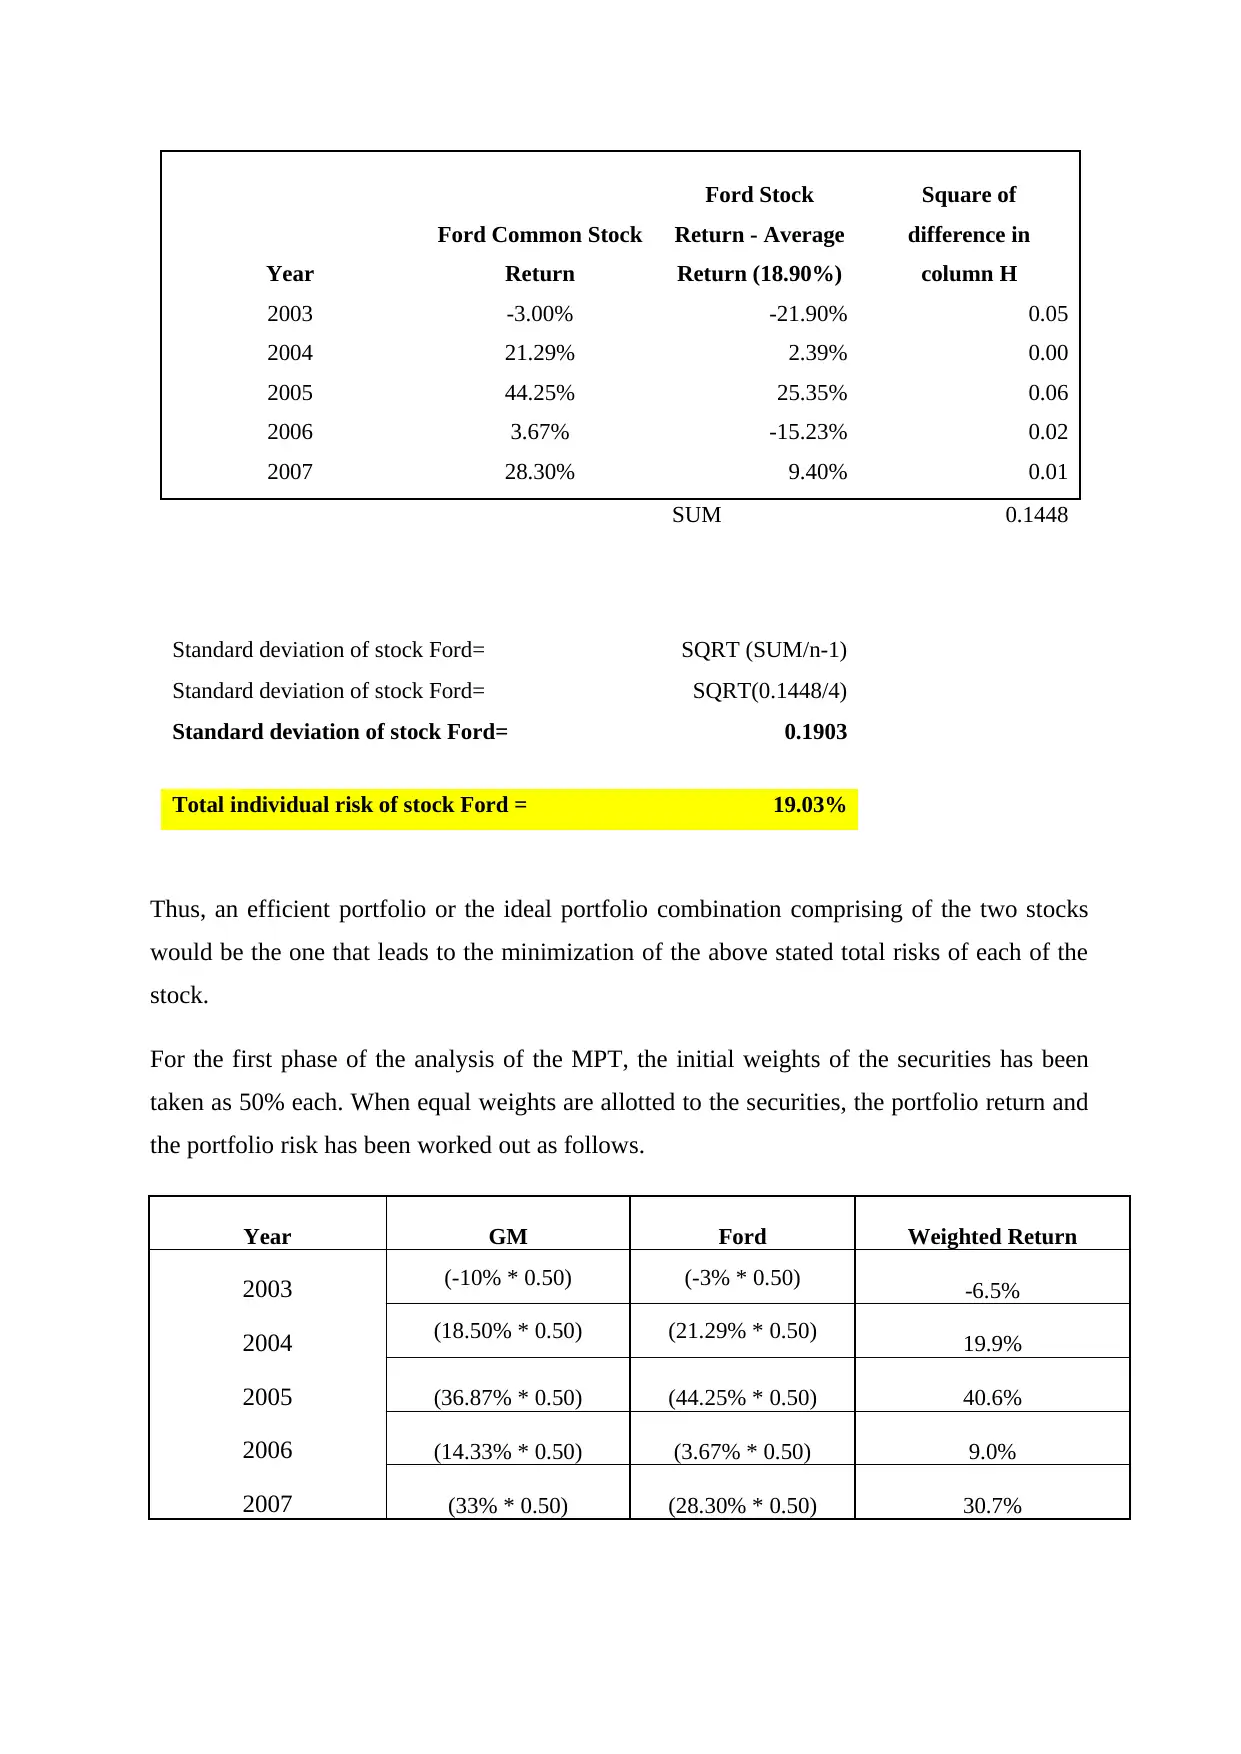
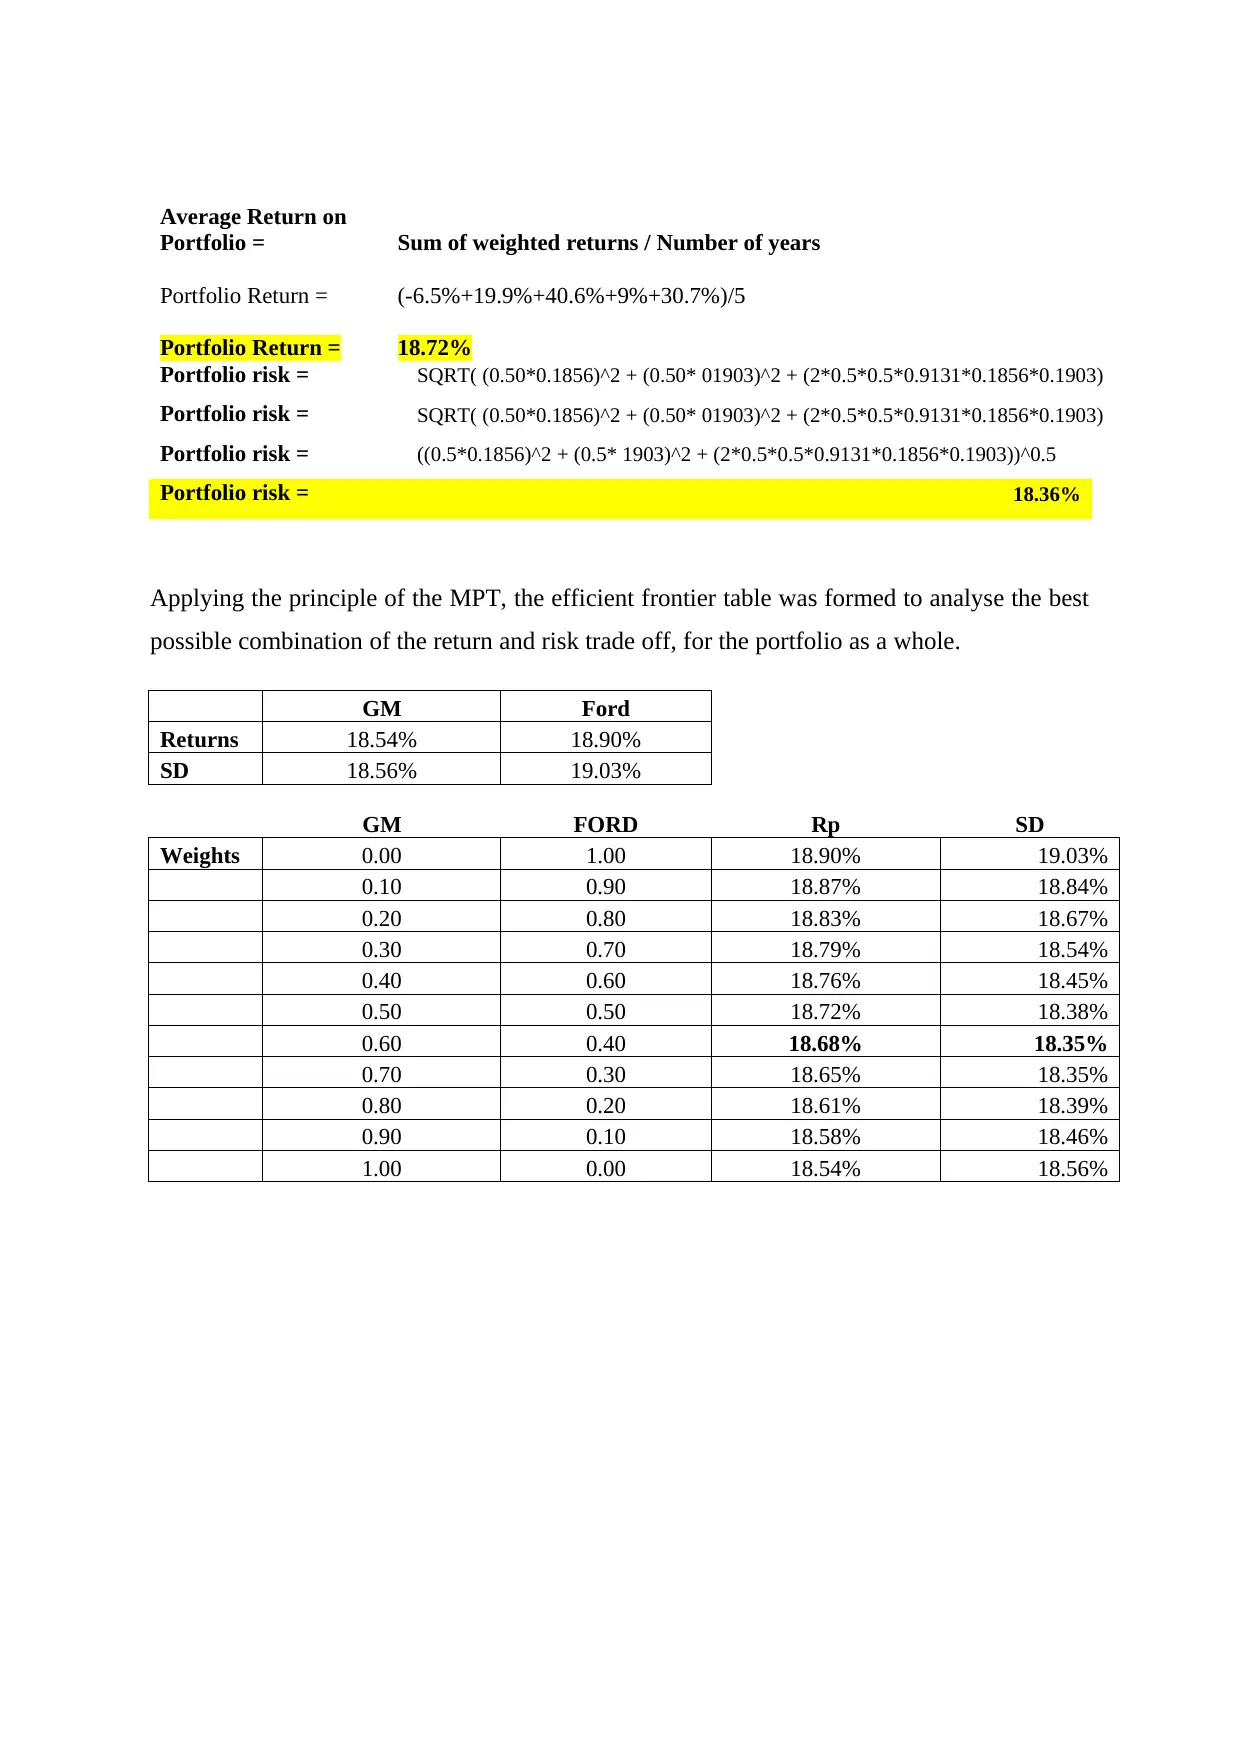
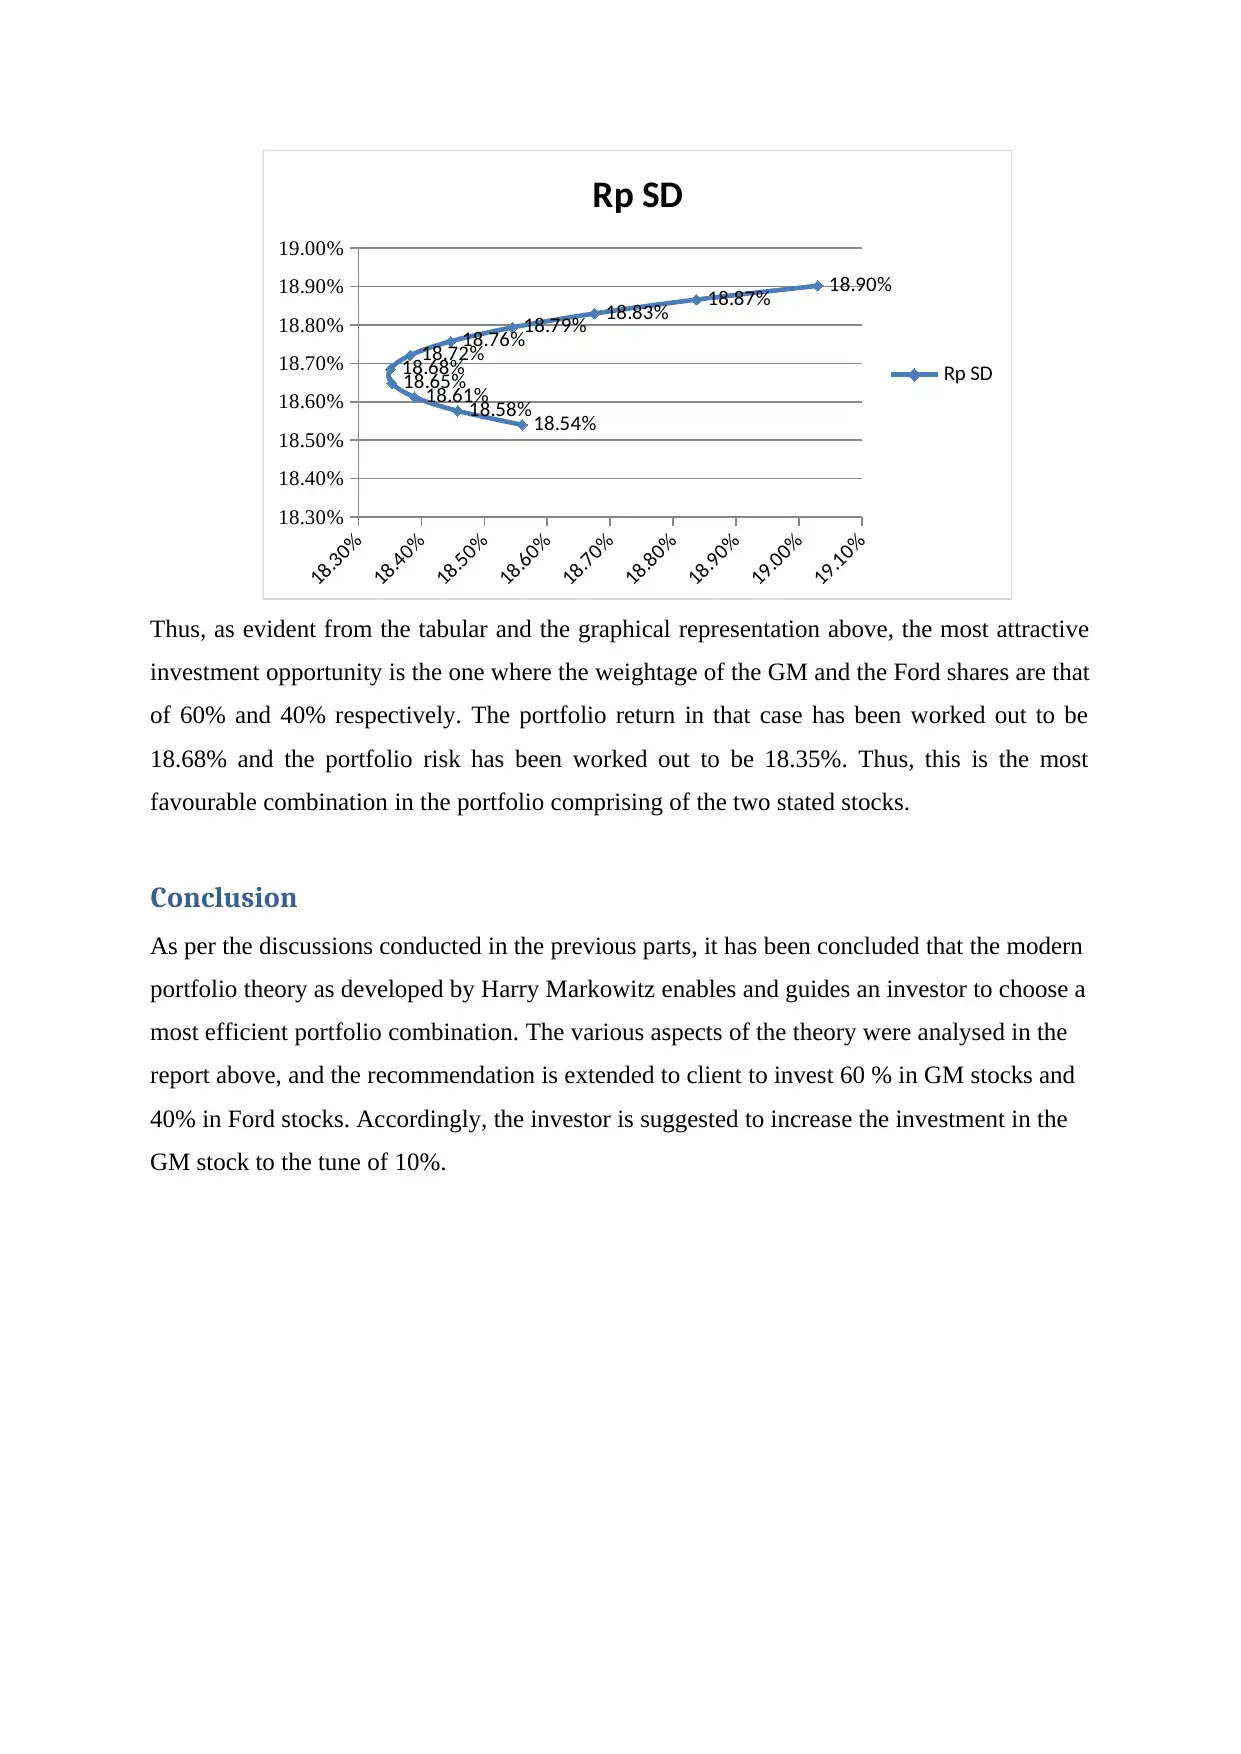
This report analyzes the risk and return of General Motors (GM) and Ford (Ford) stocks using Modern Portfolio Theory (MPT). The analysis includes calculating individual average returns, portfolio returns with equal weights, and individual stock risks (standard deviation). The report also calculates portfolio risk and explores the efficient frontier to identify the optimal stock combination for maximizing returns while minimizing risk. The findings suggest an investment strategy where 60% of the portfolio is allocated to GM stocks and 40% to Ford stocks. The report concludes that MPT provides a framework for efficient portfolio construction, guiding investors in selecting optimal asset allocations to achieve their financial goals. The report uses data from the New York Stock Exchange (NYSE) to calculate the rate of return on the asset portfolio each year. It also estimates the average return on the portfolio during the period from 2003 to 2007 and calculates the coefficient correlation between the returns of the two common stocks.
Document Page
RISK AND RETURN
tabler-icon-diamond-filled.svg

Secure Best Marks with AI Grader

Need help grading? Try our AI Grader for instant feedback on your assignments.
Document Page
Introduction
Modern Portfolio Theory (MPT) has been developed by Harry Markowitz which enables for
the formation of most efficient portfolio that minimizes the risk of the investors and
maximizes the returns in context of the portfolio as a whole (Mangram, 2013). The theory
was first proposed in “The Journal of Finance” in the year 1952 by the stated author. The aim
of the following report is to evaluate the various aspects of the theory by applying the
principles on the given stocks and related returns and risks.
Analysis
The theory is based on the two key principles as stated follows. The first principle is that the
chief goal of any investment is to maximise the risk for any levels of risk (Pfiffelmann, Roger
and Bourachnikova, 2016). This is followed by the second principle that the creation of a
diversified portfolio can lead to the reduction of the overall risk, and the assets chosen must
be unrelated to each other to balance out the overall portfolio risk (Jewczyn, 2013). The
analysis of the theory is conducted in relation to the stocks GM and the Ford as elaborated
follows.
In order to construct a portfolio, the two areas that are chiefly considered are the returns and
the risks. The individual average returns of both the stocks have been computed in the table
below for the concerned period of five years, as shown below.
Year
GM Common Stock
Return Ford Common Stock Return
2003 -10.00% -3.00%
2004 18.50% 21.29%
2005 36.87% 44.25%
2006 14.33% 3.67%
2007 33.00% 28.30%
Average rate of return of a stock = Sum of returns/Number of years
Average rate of return of GM stock = (-10+18.50+36.87+14.33+33)/5
Average rate of return of GM stock = 18.54%
Average rate of return of Ford stock = (-3+21.29+44.25+3.67+28.30)/5
Document Page
Average rate of return of Ford stock = 18.90%
As evident from the calculations conducted above, it is to be noted that the individual average
returns of the stocks GM and Ford has been computed out to be 18.54% and 18.90%
respectively. This means, an efficient portfolio as per the MPT must be one that leads to the
overall returns more than the above stated returns.
The second principle of the MPT states that an efficient portfolio is the one that leads to the
minimization of the risk of the overall portfolio. As depicted in the below tables, the
individual variances/ risk or the standard deviation of the stocks GM and Ford are 18.56 %
and 19.03% respectively.
Year
GM Common Stock
Return
GM Stock
Return -
Average Return
(18.54%)
Square of difference in
column C
2003 -10.00% -28.54% 0.08
2004 18.50% -0.04% 0.00
2005 36.87% 18.33% 0.03
2006 14.33% -4.21% 0.00
2007 33.00% 14.46% 0.02
SUM 0.1377
Total risk of a stock is depicted by the Standard Deviation
Standard deviation of stock GM= SQRT (SUM/n-1)
Standard deviation of stock GM= SQRT(0.1377/4)
Standard deviation of stock GM= 0.1856
Total individual risk of stock GM = 18.56%
Document Page
Year
Ford Common Stock
Return
Ford Stock
Return - Average
Return (18.90%)
Square of
difference in
column H
2003 -3.00% -21.90% 0.05
2004 21.29% 2.39% 0.00
2005 44.25% 25.35% 0.06
2006 3.67% -15.23% 0.02
2007 28.30% 9.40% 0.01
SUM 0.1448
Standard deviation of stock Ford= SQRT (SUM/n-1)
Standard deviation of stock Ford= SQRT(0.1448/4)
Standard deviation of stock Ford= 0.1903
Total individual risk of stock Ford = 19.03%
Thus, an efficient portfolio or the ideal portfolio combination comprising of the two stocks
would be the one that leads to the minimization of the above stated total risks of each of the
stock.
For the first phase of the analysis of the MPT, the initial weights of the securities has been
taken as 50% each. When equal weights are allotted to the securities, the portfolio return and
the portfolio risk has been worked out as follows.
Year GM Ford Weighted Return
2003 (-10% * 0.50) (-3% * 0.50) -6.5%
2004 (18.50% * 0.50) (21.29% * 0.50) 19.9%
2005 (36.87% * 0.50) (44.25% * 0.50) 40.6%
2006 (14.33% * 0.50) (3.67% * 0.50) 9.0%
2007 (33% * 0.50) (28.30% * 0.50) 30.7%
tabler-icon-diamond-filled.svg

Secure Best Marks with AI Grader

Need help grading? Try our AI Grader for instant feedback on your assignments.
Document Page
Average Return on
Portfolio = Sum of weighted returns / Number of years
Portfolio Return = (-6.5%+19.9%+40.6%+9%+30.7%)/5
Portfolio Return = 18.72%
Portfolio risk = SQRT( (0.50*0.1856)^2 + (0.50* 01903)^2 + (2*0.5*0.5*0.9131*0.1856*0.1903)
Portfolio risk = ((0.5*0.1856)^2 + (0.5* 1903)^2 + (2*0.5*0.5*0.9131*0.1856*0.1903))^0.5
Portfolio risk = 18.36%
Applying the principle of the MPT, the efficient frontier table was formed to analyse the best
possible combination of the return and risk trade off, for the portfolio as a whole.
GM Ford
Returns 18.54% 18.90%
SD 18.56% 19.03%
GM FORD Rp SD
Weights 0.00 1.00 18.90% 19.03%
0.10 0.90 18.87% 18.84%
0.20 0.80 18.83% 18.67%
0.30 0.70 18.79% 18.54%
0.40 0.60 18.76% 18.45%
0.50 0.50 18.72% 18.38%
0.60 0.40 18.68% 18.35%
0.70 0.30 18.65% 18.35%
0.80 0.20 18.61% 18.39%
0.90 0.10 18.58% 18.46%
1.00 0.00 18.54% 18.56%
Document Page
Thus, as evident from the tabular and the graphical representation above, the most attractive
investment opportunity is the one where the weightage of the GM and the Ford shares are that
of 60% and 40% respectively. The portfolio return in that case has been worked out to be
18.68% and the portfolio risk has been worked out to be 18.35%. Thus, this is the most
favourable combination in the portfolio comprising of the two stated stocks.
Conclusion
As per the discussions conducted in the previous parts, it has been concluded that the modern
portfolio theory as developed by Harry Markowitz enables and guides an investor to choose a
most efficient portfolio combination. The various aspects of the theory were analysed in the
report above, and the recommendation is extended to client to invest 60 % in GM stocks and
40% in Ford stocks. Accordingly, the investor is suggested to increase the investment in the
GM stock to the tune of 10%. 18.30%
18.40%
18.50%
18.60%
18.70%
18.80%
18.90%
19.00%
19.10%
18.30%
18.40%
18.50%
18.60%
18.70%
18.80%
18.90%
19.00%
18.90%
18.87%
18.83%
18.79%
18.76%
18.72%
18.68%
18.65%
18.61%
18.58%18.54%
Rp SD
Rp SD
Document Page
References
Mangram, M. E. (2013), ‘A simplified perspective of the Markowitz portfolio theory,’ Global
journal of business research, Vol. 7, No. 1, pp. 59-70.
https://papers.ssrn.com/sol3/papers.cfm?abstract_id=2147880
Pfiffelmann, M., Roger, T. and Bourachnikova, O. (2016), ‘When behavioral portfolio theory
meets Markowitz theory. Economic Modelling, Vol. 53, pp. 419-435. DOI:
10.1016/j.econmod.2015.10.041
Jewczyn, N. (2013), ‘Modern portfolio theory, apt, and the capm: The years 1952 to 1986,’
The International Journal of Social Science Research, Vol. 2, No. 1, pp. 74-87.
http://mustangjournals.com/MJBE/v6_MJBE_2014_forwebsite.pdf
chevron_up_icon
1 out of 7
circle_padding
hide_on_mobile
zoom_out_icon
logo.png

Your All-in-One AI-Powered Toolkit for Academic Success.

Available 24*7 on WhatsApp / Email

[object Object]