Module 5: Analyzing Prevalence, Sensitivity, and Study Designs
VerifiedAdded on 2023/06/07
|10
|2182
|238
Homework Assignment
AI Summary
This assignment delves into epidemiological concepts using exercises related to HPV prevalence and hypertension (HTN). It involves calculating prevalence, specificity, sensitivity, positive predictive value (PPV), and negative predictive value (NPV) based on a given population. The assignment also analyzes the impact of changing disease prevalence on test sensitivity and discusses the implications of false positive and false negative results in healthcare settings. Furthermore, it distinguishes between different study designs, such as cohort, case-control, cross-sectional, and correlation studies, and applies these concepts to various scenarios. The exercise includes calculating and interpreting the odds ratio (OR) for a case-control study on HTN and family history of stroke, highlighting potential biases and confounding factors. Desklib offers a wealth of similar solved assignments and study resources for students.
MODULE 5 ASSIGNMENT
Exercise 3.3
Given a population of 2000 students, 352 students tested positive for HPV, prevalence =
12 percent and the specificity = 92 percent, then:
The prevalence is calculated using the formula below (Ann & Patty, 2016):
Prevalence= Total number of existing cases(during a specified period )
Total population at risk (during the same specified period of time) x Constant Multiplier
The total population at risk = 2000 and prevalence = 12 percent,
Thus,
0.12= Total number of existing cases(during a specified period )
2000
Total number of existing cases ( duringa specified period ) =2000 x 0.12=240
The total number of existing cases is the value of the total HPV cases in both positive and
negative test results.
Thus,
Total for No HPV =Total Population at risk (during a specified period)−Total number of existing cases( duringthe
Total for No HPV =2000−240=1760
The specificity is calculated using the formula below (Graig, 2014):
Specificity= Total Number that Tested Negative∧had No HPV
Total Number that had No HPV (Total Number for No HPV ) x Constant Multiplier
Thus,
1
Paraphrase This Document
Need a fresh take? Get an instant paraphrase of this document with our AI Paraphraser
MODULE 5 ASSIGNMENT
0.92= Total Number that Tested Negative∧had No HPV
1760
Total Number that Tested Negative∧had No HPV =0.92 x 1760=1619.2
Approximating this value to the nearest whole value, we get;
Total Number that Tested Negative∧had No HPV =1619
For the No HPV cases;
Total Number that had No HPV ( Total Number for No HPV ) =Total Number that Tested Negative∧had No HPV +T
Thus,
1760=1619+ Total Number that Tested Positive∧had No HPV
Total Number that Tested Positive∧had No HPV =1760−1619=141
If 352 students tested positive for HPV, then in terms of test results;
Total Population=Total Number of PositiveTest Results+Total Number of Negative Test Results
2000=352+Total Number of Negative Test Results
Thus,
Total Number of Negative Test Results=2000−352=1648
For the positive test results;
Total Number of Positive Test Results=Total Number that Tested Positive∧had HPV +Total Number that Tested Po
2
MODULE 5 ASSIGNMENT
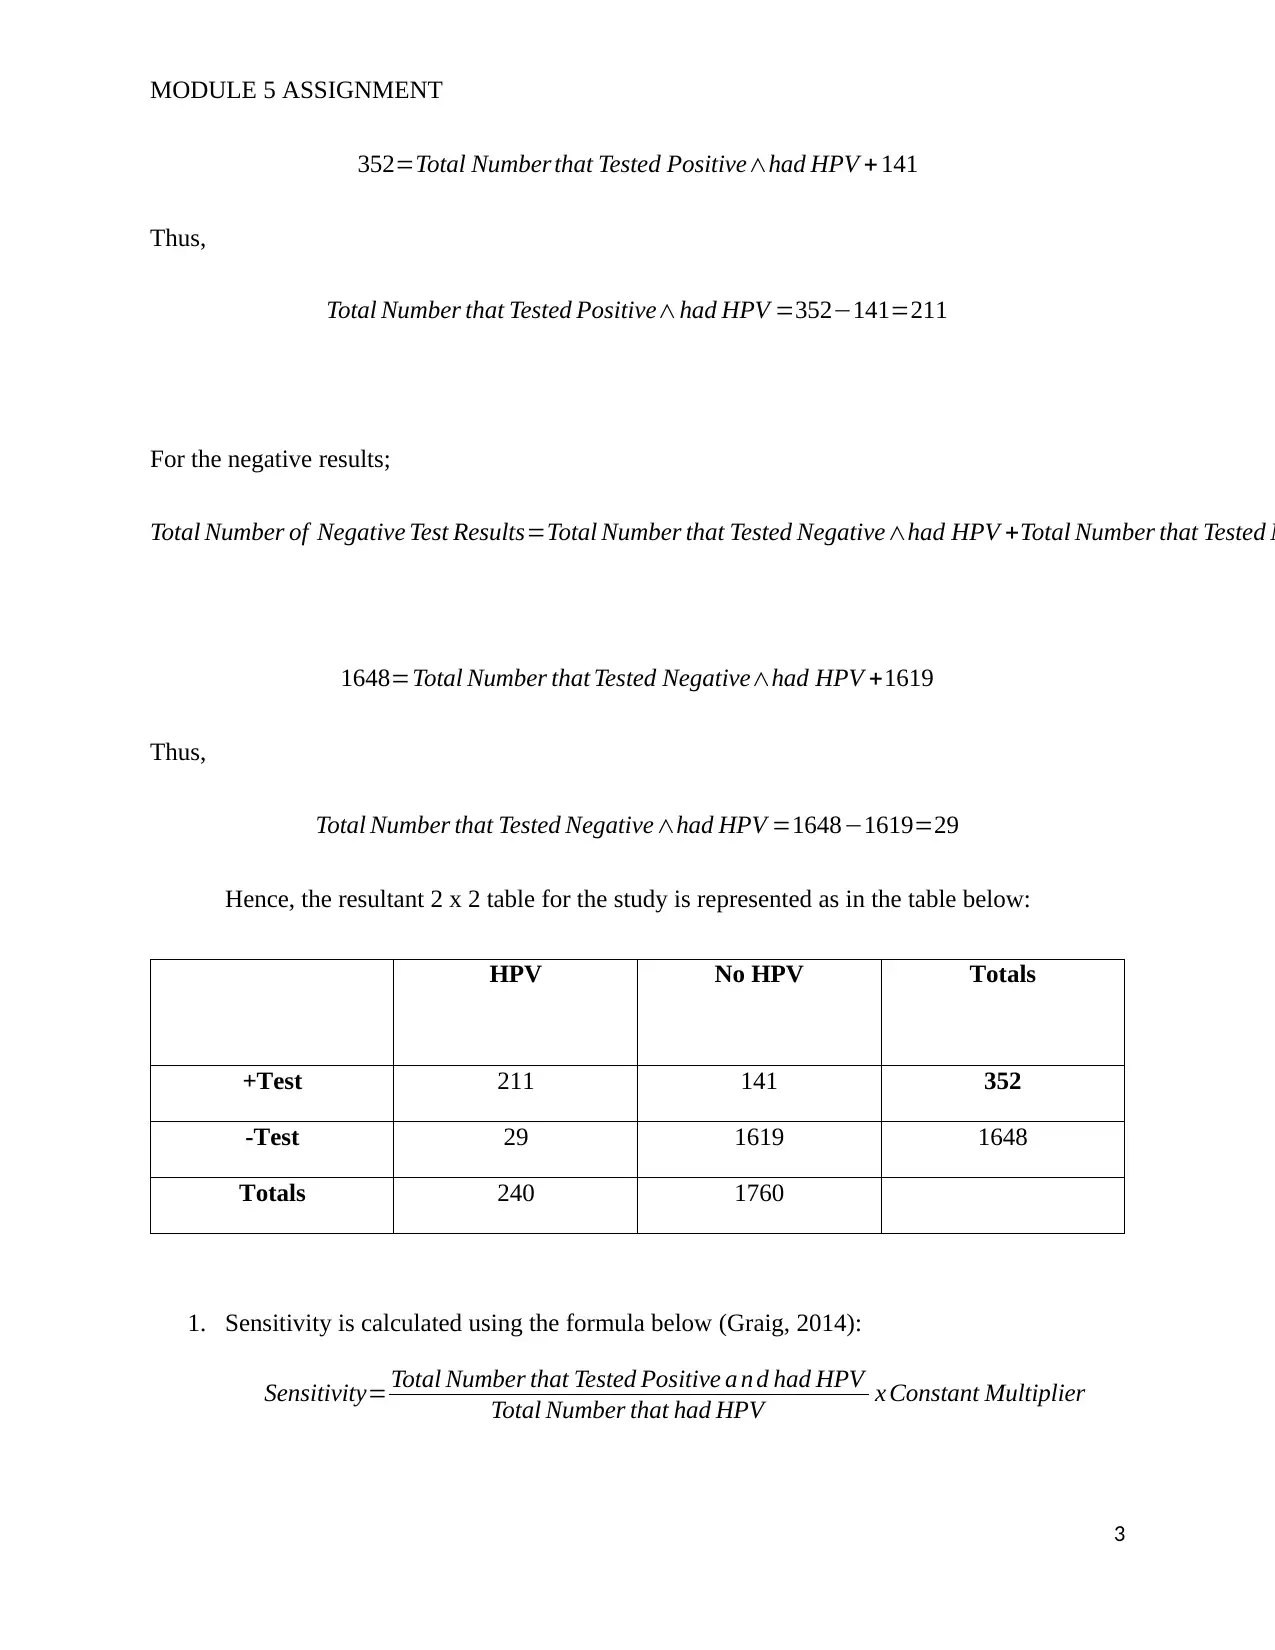
352=Total Number that Tested Positive∧had HPV + 141
Thus,
Total Number that Tested Positive∧had HPV =352−141=211
For the negative results;
Total Number of Negative Test Results=Total Number that Tested Negative∧had HPV +Total Number that Tested N
1648=Total Number that Tested Negative∧had HPV +1619
Thus,
Total Number that Tested Negative∧had HPV =1648−1619=29
Hence, the resultant 2 x 2 table for the study is represented as in the table below:
HPV No HPV Totals
+Test 211 141 352
-Test 29 1619 1648
Totals 240 1760
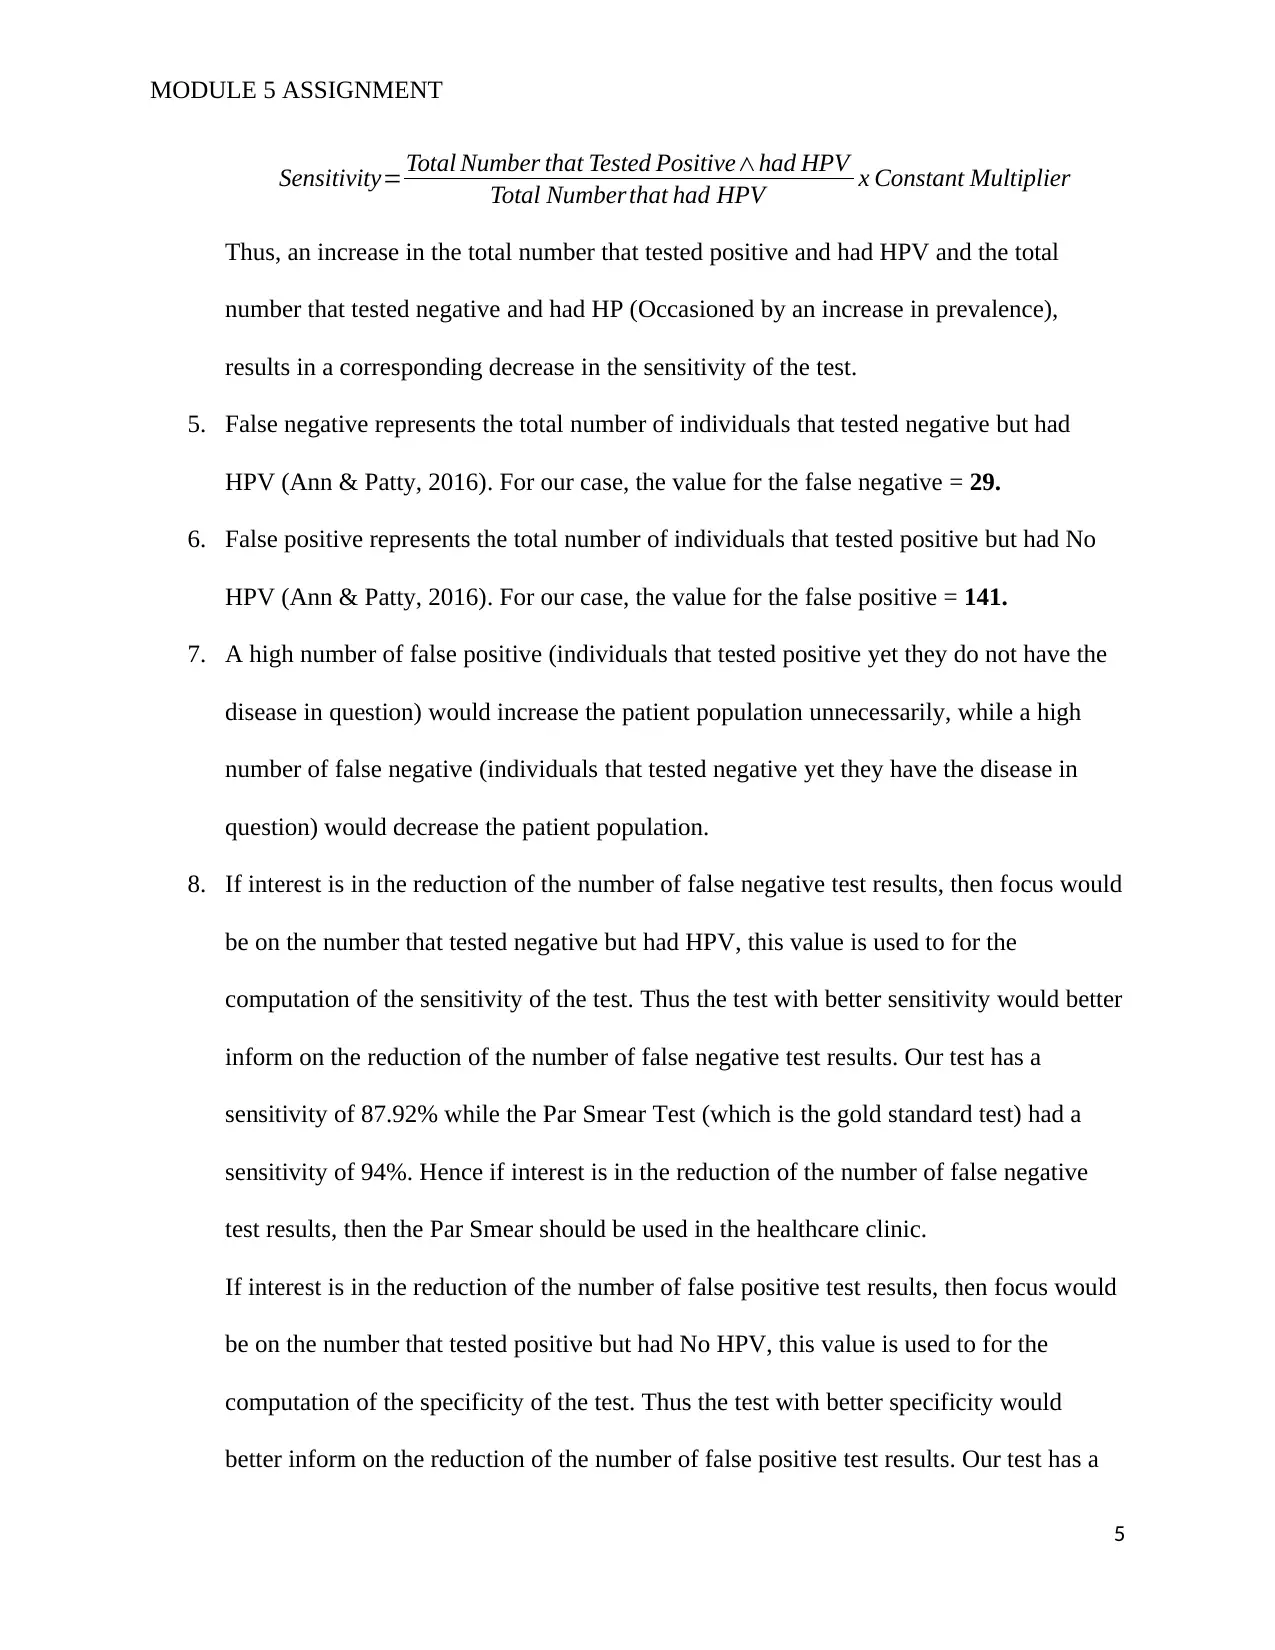
1. Sensitivity is calculated using the formula below (Graig, 2014):
Sensitivity= Total Number that Tested Positive a n d had HPV
Total Number that had HPV x Constant Multiplier
3
352=Total Number that Tested Positive∧had HPV + 141
Thus,
Total Number that Tested Positive∧had HPV =352−141=211
For the negative results;
Total Number of Negative Test Results=Total Number that Tested Negative∧had HPV +Total Number that Tested N
1648=Total Number that Tested Negative∧had HPV +1619
Thus,
Total Number that Tested Negative∧had HPV =1648−1619=29
Hence, the resultant 2 x 2 table for the study is represented as in the table below:
HPV No HPV Totals
+Test 211 141 352
-Test 29 1619 1648
Totals 240 1760
1. Sensitivity is calculated using the formula below (Graig, 2014):
Sensitivity= Total Number that Tested Positive a n d had HPV
Total Number that had HPV x Constant Multiplier
3
⊘ This is a preview!⊘
Do you want full access?
Subscribe today to unlock all pages.
Trusted by 1+ million students worldwide
MODULE 5 ASSIGNMENT
Sensitivity= 211
240 x 100=87.92 %
2. Positive Predictive Value (PPV) is calculated using the formula below (Ann & Patty,
2016):
Positive Predictive Value ( PPV ) =Total Number that Tested Positive ∧had HPV
Total Number that Tested Positive
Positive Predictive Value ( PPV ) =211
352 =0.5994
3. Negative Predictive Value (NPV) is calculated using the formula below (Ann & Patty,
2016):
Negative Predictive Value ( NPV )=Total Number that Tested Negative∧had No HPV
Total Number that Tested Negative
Negative Predictive Value ( NPV )=1619
1648 =0.9824
4. If the disease prevalence increases, then this implies that the total number of existing
cases will also have increased. The total number of existing cases represents the sum of
the cases of HPV regardless of the test result. That is:
Total Number of Existing Cases=Total Number that Tested Positive∧had HPV +Total Number that Tested N
Thus, an increase in the total number of existing cases means an increase in both the total
number that tested positive and had HPV and the total number that tested negative and
had HPV.
The sensitivity is calculated using the formula below (Graig, 2014):
4
Paraphrase This Document
Need a fresh take? Get an instant paraphrase of this document with our AI Paraphraser
MODULE 5 ASSIGNMENT
Sensitivity= Total Number that Tested Positive∧had HPV
Total Number that had HPV x Constant Multiplier
Thus, an increase in the total number that tested positive and had HPV and the total
number that tested negative and had HP (Occasioned by an increase in prevalence),
results in a corresponding decrease in the sensitivity of the test.
5. False negative represents the total number of individuals that tested negative but had
HPV (Ann & Patty, 2016). For our case, the value for the false negative = 29.
6. False positive represents the total number of individuals that tested positive but had No
HPV (Ann & Patty, 2016). For our case, the value for the false positive = 141.
7. A high number of false positive (individuals that tested positive yet they do not have the
disease in question) would increase the patient population unnecessarily, while a high
number of false negative (individuals that tested negative yet they have the disease in
question) would decrease the patient population.
8. If interest is in the reduction of the number of false negative test results, then focus would
be on the number that tested negative but had HPV, this value is used to for the
computation of the sensitivity of the test. Thus the test with better sensitivity would better
inform on the reduction of the number of false negative test results. Our test has a
sensitivity of 87.92% while the Par Smear Test (which is the gold standard test) had a
sensitivity of 94%. Hence if interest is in the reduction of the number of false negative
test results, then the Par Smear should be used in the healthcare clinic.
If interest is in the reduction of the number of false positive test results, then focus would
be on the number that tested positive but had No HPV, this value is used to for the
computation of the specificity of the test. Thus the test with better specificity would
better inform on the reduction of the number of false positive test results. Our test has a
5
MODULE 5 ASSIGNMENT
specificity of 92% while the Par Smear Test (which is the gold standard test) had a
specificity of 88%. Hence if interest is in the reduction of the number of false positive
test results, then our test should be used in the healthcare clinic.
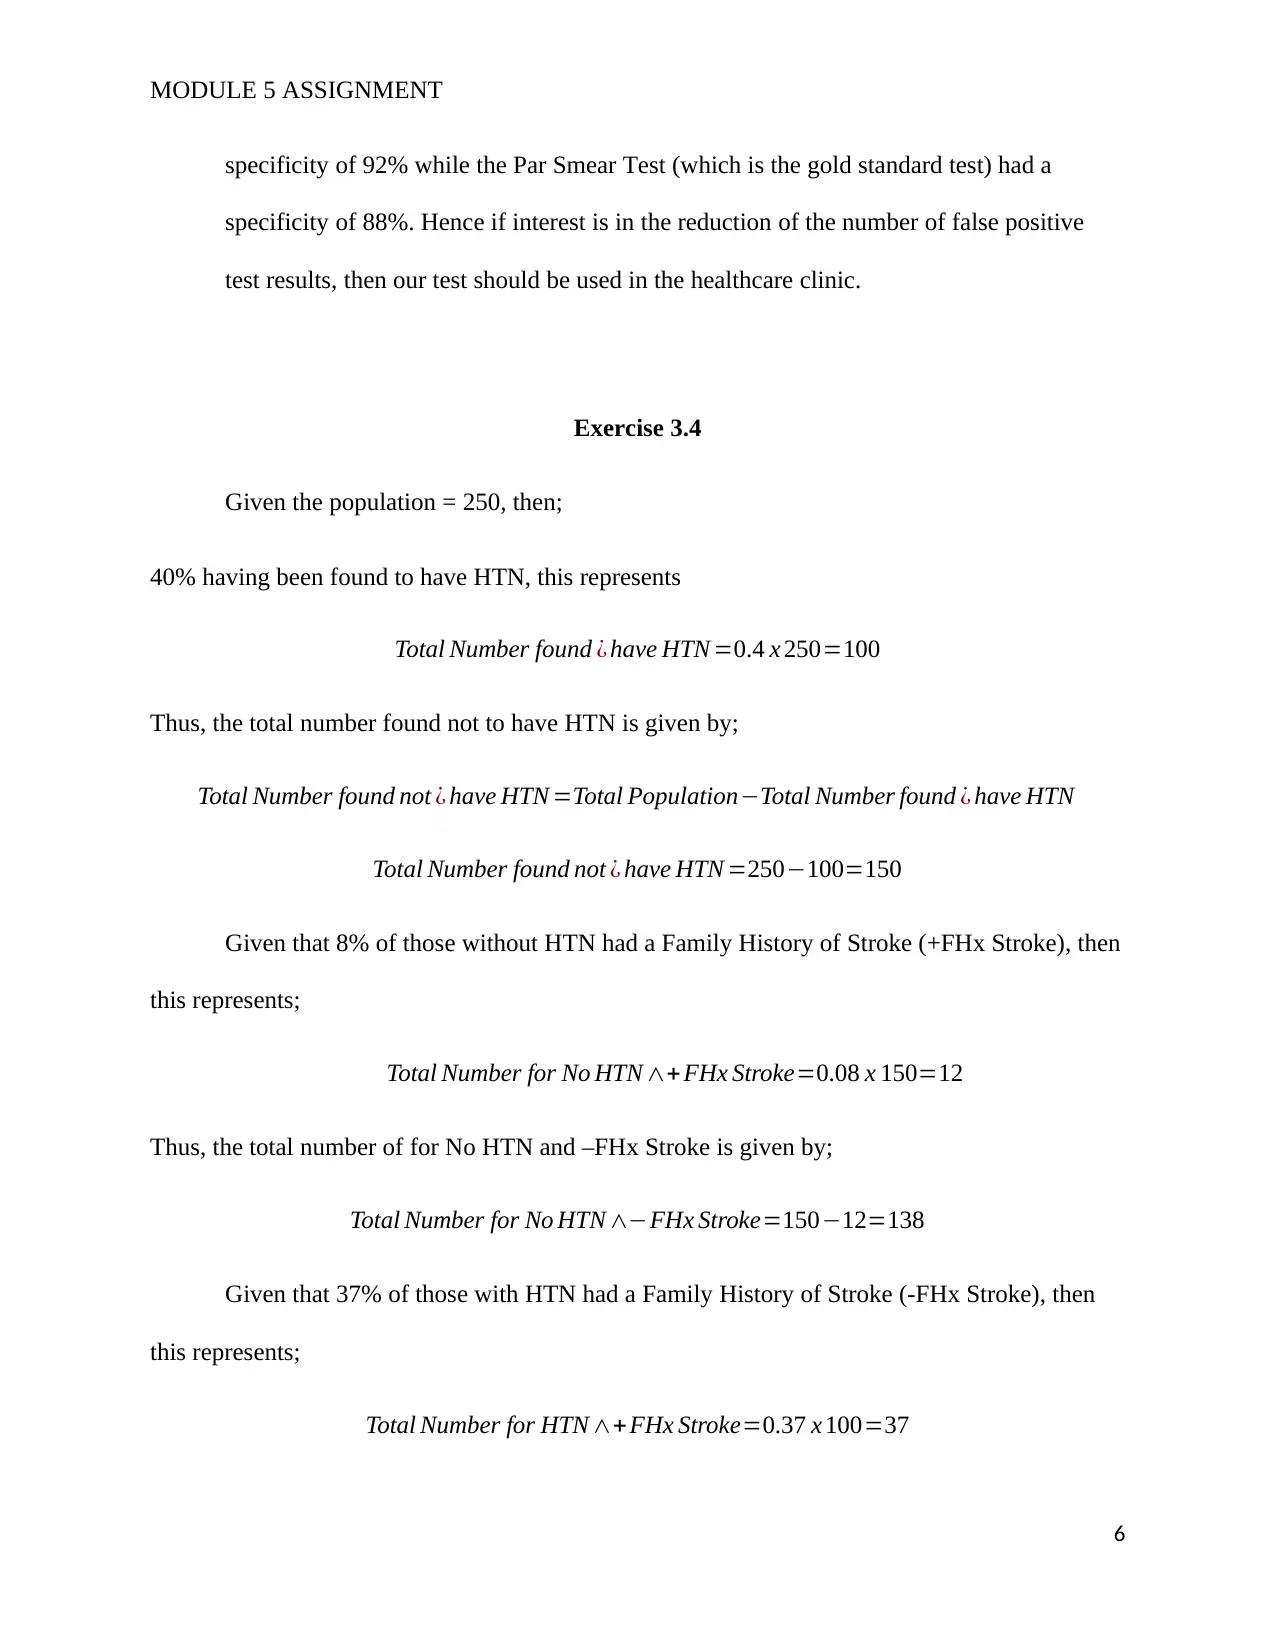
Exercise 3.4
Given the population = 250, then;
40% having been found to have HTN, this represents
Total Number found ¿ have HTN =0.4 x 250=100
Thus, the total number found not to have HTN is given by;
Total Number found not ¿ have HTN =Total Population−Total Number found ¿ have HTN
Total Number found not ¿ have HTN =250−100=150
Given that 8% of those without HTN had a Family History of Stroke (+FHx Stroke), then
this represents;
Total Number for No HTN ∧+ FHx Stroke=0.08 x 150=12
Thus, the total number of for No HTN and –FHx Stroke is given by;
Total Number for No HTN ∧−FHx Stroke=150−12=138
Given that 37% of those with HTN had a Family History of Stroke (-FHx Stroke), then
this represents;
Total Number for HTN ∧+FHx Stroke=0.37 x 100=37
6
specificity of 92% while the Par Smear Test (which is the gold standard test) had a
specificity of 88%. Hence if interest is in the reduction of the number of false positive
test results, then our test should be used in the healthcare clinic.
Exercise 3.4
Given the population = 250, then;
40% having been found to have HTN, this represents
Total Number found ¿ have HTN =0.4 x 250=100
Thus, the total number found not to have HTN is given by;
Total Number found not ¿ have HTN =Total Population−Total Number found ¿ have HTN
Total Number found not ¿ have HTN =250−100=150
Given that 8% of those without HTN had a Family History of Stroke (+FHx Stroke), then
this represents;
Total Number for No HTN ∧+ FHx Stroke=0.08 x 150=12
Thus, the total number of for No HTN and –FHx Stroke is given by;
Total Number for No HTN ∧−FHx Stroke=150−12=138
Given that 37% of those with HTN had a Family History of Stroke (-FHx Stroke), then
this represents;
Total Number for HTN ∧+FHx Stroke=0.37 x 100=37
6
⊘ This is a preview!⊘
Do you want full access?
Subscribe today to unlock all pages.
Trusted by 1+ million students worldwide
MODULE 5 ASSIGNMENT
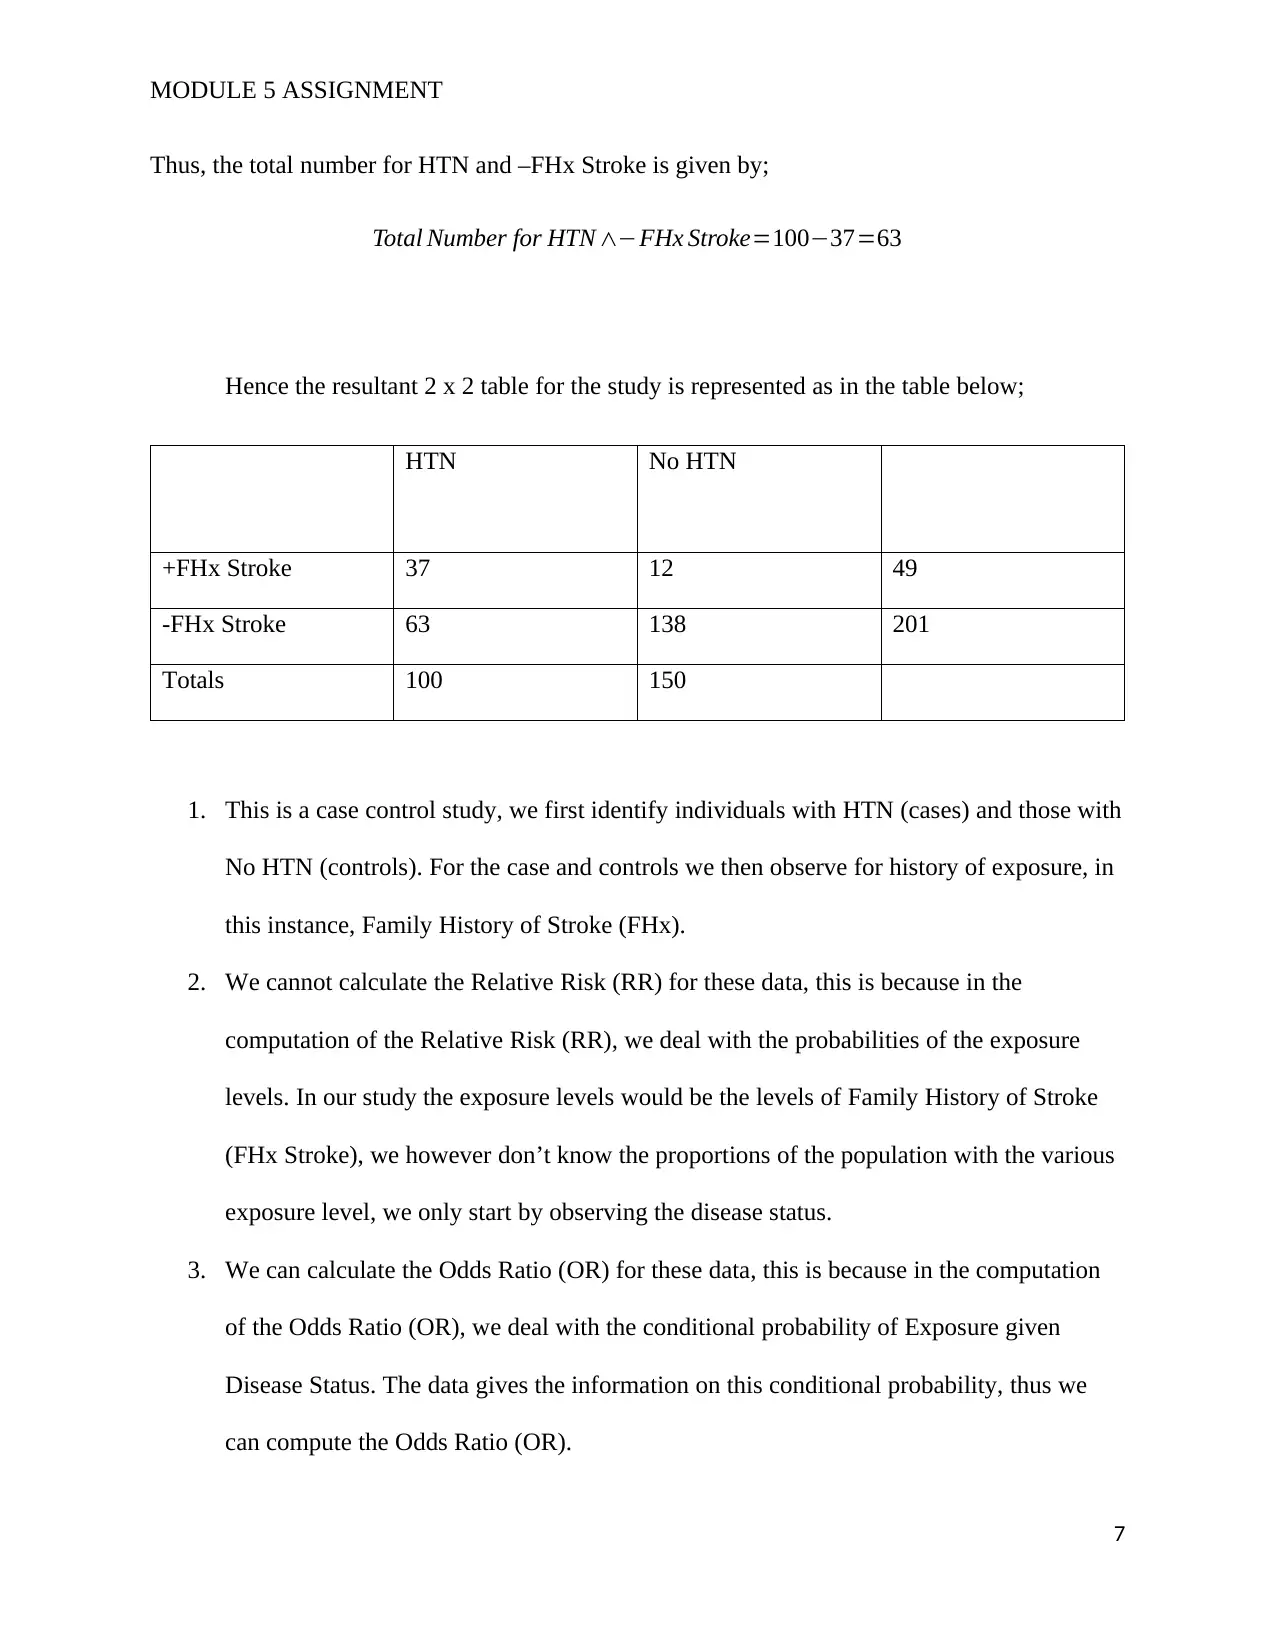
Thus, the total number for HTN and –FHx Stroke is given by;
Total Number for HTN ∧−FHx Stroke=100−37=63
Hence the resultant 2 x 2 table for the study is represented as in the table below;
HTN No HTN
+FHx Stroke 37 12 49
-FHx Stroke 63 138 201
Totals 100 150
1. This is a case control study, we first identify individuals with HTN (cases) and those with
No HTN (controls). For the case and controls we then observe for history of exposure, in
this instance, Family History of Stroke (FHx).
2. We cannot calculate the Relative Risk (RR) for these data, this is because in the
computation of the Relative Risk (RR), we deal with the probabilities of the exposure
levels. In our study the exposure levels would be the levels of Family History of Stroke
(FHx Stroke), we however don’t know the proportions of the population with the various
exposure level, we only start by observing the disease status.
3. We can calculate the Odds Ratio (OR) for these data, this is because in the computation
of the Odds Ratio (OR), we deal with the conditional probability of Exposure given
Disease Status. The data gives the information on this conditional probability, thus we
can compute the Odds Ratio (OR).
7
Paraphrase This Document
Need a fresh take? Get an instant paraphrase of this document with our AI Paraphraser
MODULE 5 ASSIGNMENT
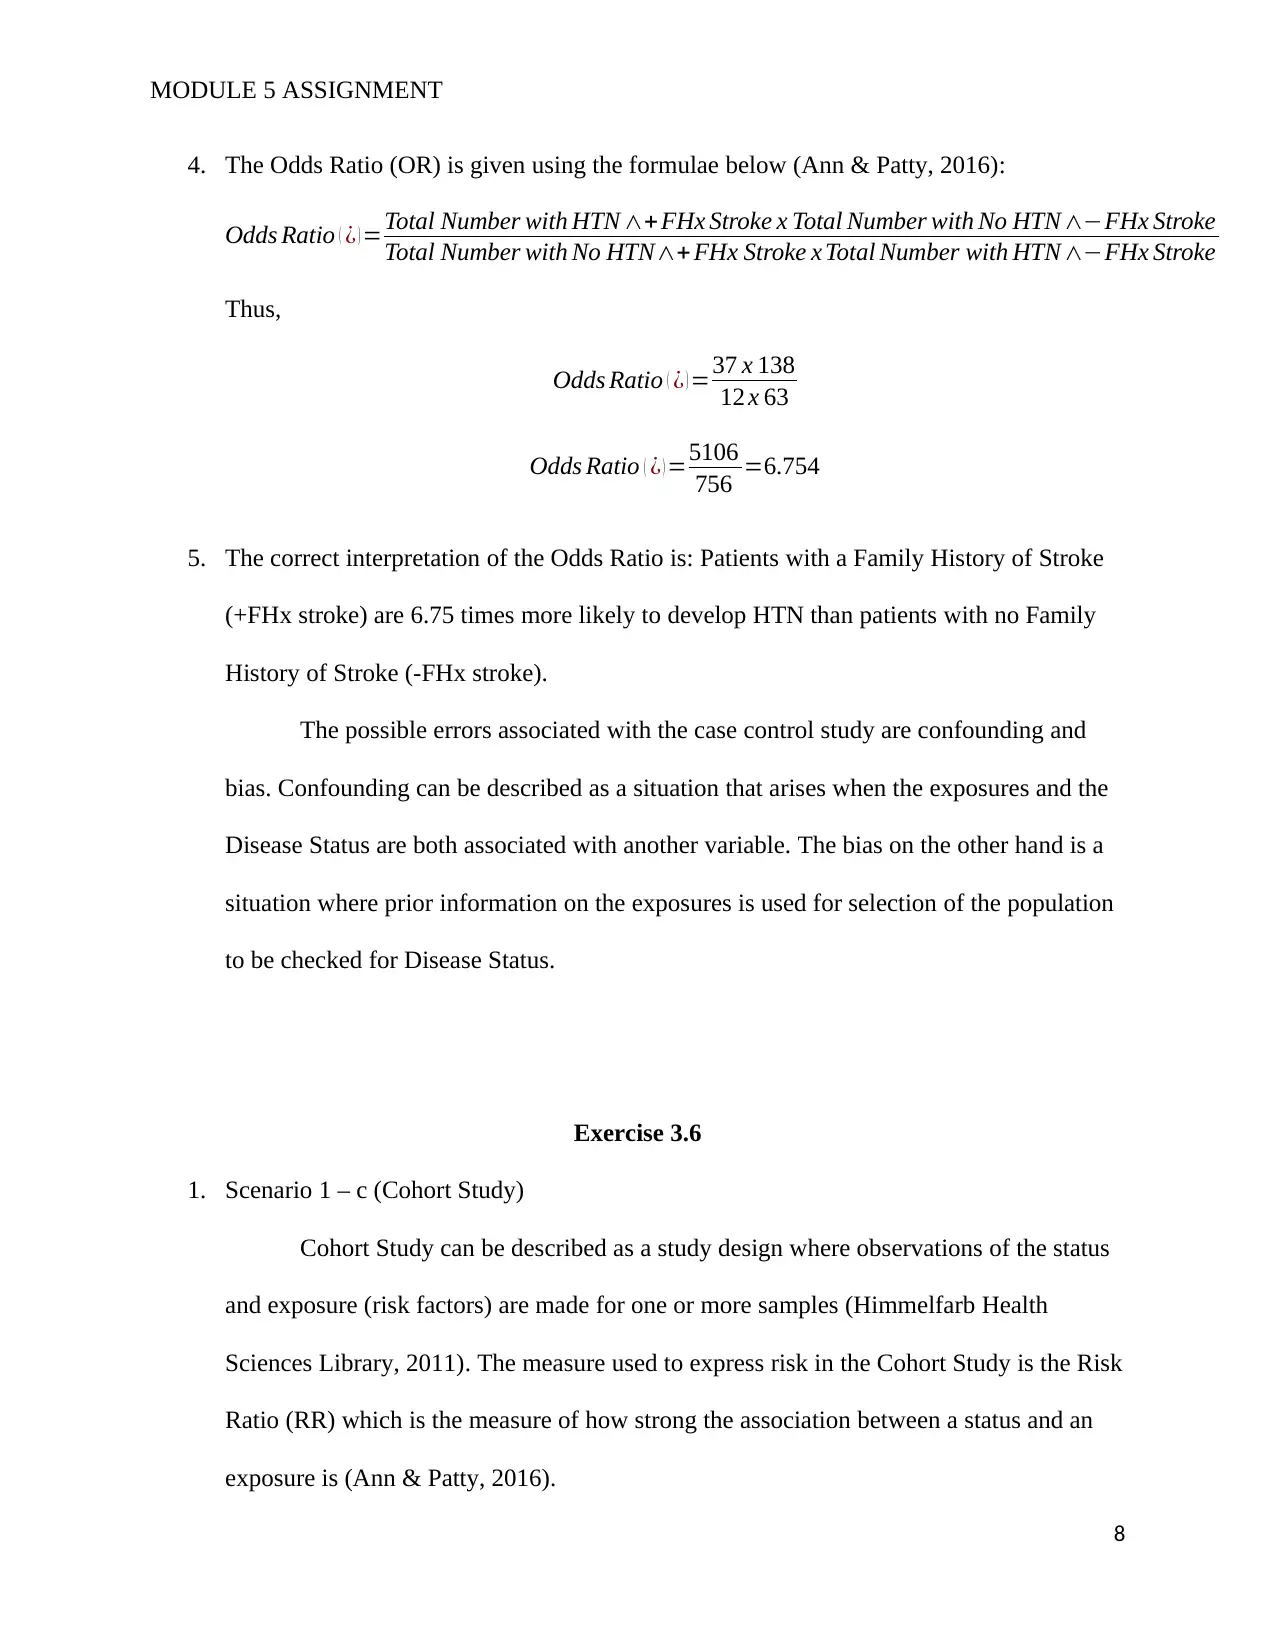
4. The Odds Ratio (OR) is given using the formulae below (Ann & Patty, 2016):
Odds Ratio ( ¿ ) =Total Number with HTN ∧+ FHx Stroke x Total Number with No HTN ∧−FHx Stroke
Total Number with No HTN∧+ FHx Stroke x Total Number with HTN ∧−FHx Stroke
Thus,
Odds Ratio ( ¿ ) =37 x 138
12 x 63
Odds Ratio ( ¿ ) =5106
756 =6.754
5. The correct interpretation of the Odds Ratio is: Patients with a Family History of Stroke
(+FHx stroke) are 6.75 times more likely to develop HTN than patients with no Family
History of Stroke (-FHx stroke).
The possible errors associated with the case control study are confounding and
bias. Confounding can be described as a situation that arises when the exposures and the
Disease Status are both associated with another variable. The bias on the other hand is a
situation where prior information on the exposures is used for selection of the population
to be checked for Disease Status.
Exercise 3.6
1. Scenario 1 – c (Cohort Study)
Cohort Study can be described as a study design where observations of the status
and exposure (risk factors) are made for one or more samples (Himmelfarb Health
Sciences Library, 2011). The measure used to express risk in the Cohort Study is the Risk
Ratio (RR) which is the measure of how strong the association between a status and an
exposure is (Ann & Patty, 2016).
8
MODULE 5 ASSIGNMENT
2. Scenario 2 – c (Cohort Study)
3. Scenario 3 – a (Cross-sectional Study)
4. Scenario 4 – b (Case Control Study)
Case Control Study can be described as a study design where a population with
the status of interest in identified (Cases) and a population without the status of interested
is also identified (Controls), then the exposure levels are observed for both populations
and recorded (Ann & Patty, 2016). The measure used to express risk in the Case Control
Study is the Odds Ratio (OR) which is the ratio of exposure if your status is the status of
interest to exposure if your status is not the status of interest (Ann & Patty, 2016).
5. Scenario 5 – d (Correlation Study)
Descriptive epidemiology refers to studies that provide information on the distribution of
a health related state/event or disease with respect to time, geographical location or personal
characteristic while Analytic epidemiology refers to studies that investigate the casual factors
and origins of health related states/events or diseases (Ann & Patty, 2016).
Scenarios 3 and 5, Cross-sectional and Correlation studies respectively, represent
Descriptive epidemiology studies.
Scenarios 1, 2 and 4, which are Cohort and Case Control Studies, represent the Analytic
epidemiology studies.
References
9
⊘ This is a preview!⊘
Do you want full access?
Subscribe today to unlock all pages.
Trusted by 1+ million students worldwide
MODULE 5 ASSIGNMENT
Ann, C. C., & Patty, V. A. (2016). Population-Based Nursing [Electronic Resource]: Cocepts
and Competencies for Advanced Practice 2nd Edition . New York: Springer Publishing
Company .
Graig, M. (2014, April 30). Global Health. Retrieved from Youtube:
http://www.youtube.com/watch?v=FnJ3L-63Cf8
Himmelfarb Health Sciences Library. (2011, November 1). Study Design 101. Retrieved from
Himmelfarb: https://himmelfarb.gwu.edu/tutorials/studydesign101/cohorts.html
10
1 out of 10