Monash University CHM2922: Gas Chromatography - Wine Alcohol Analysis
VerifiedAdded on 2023/08/09
|66
|17238
|363
Report
AI Summary
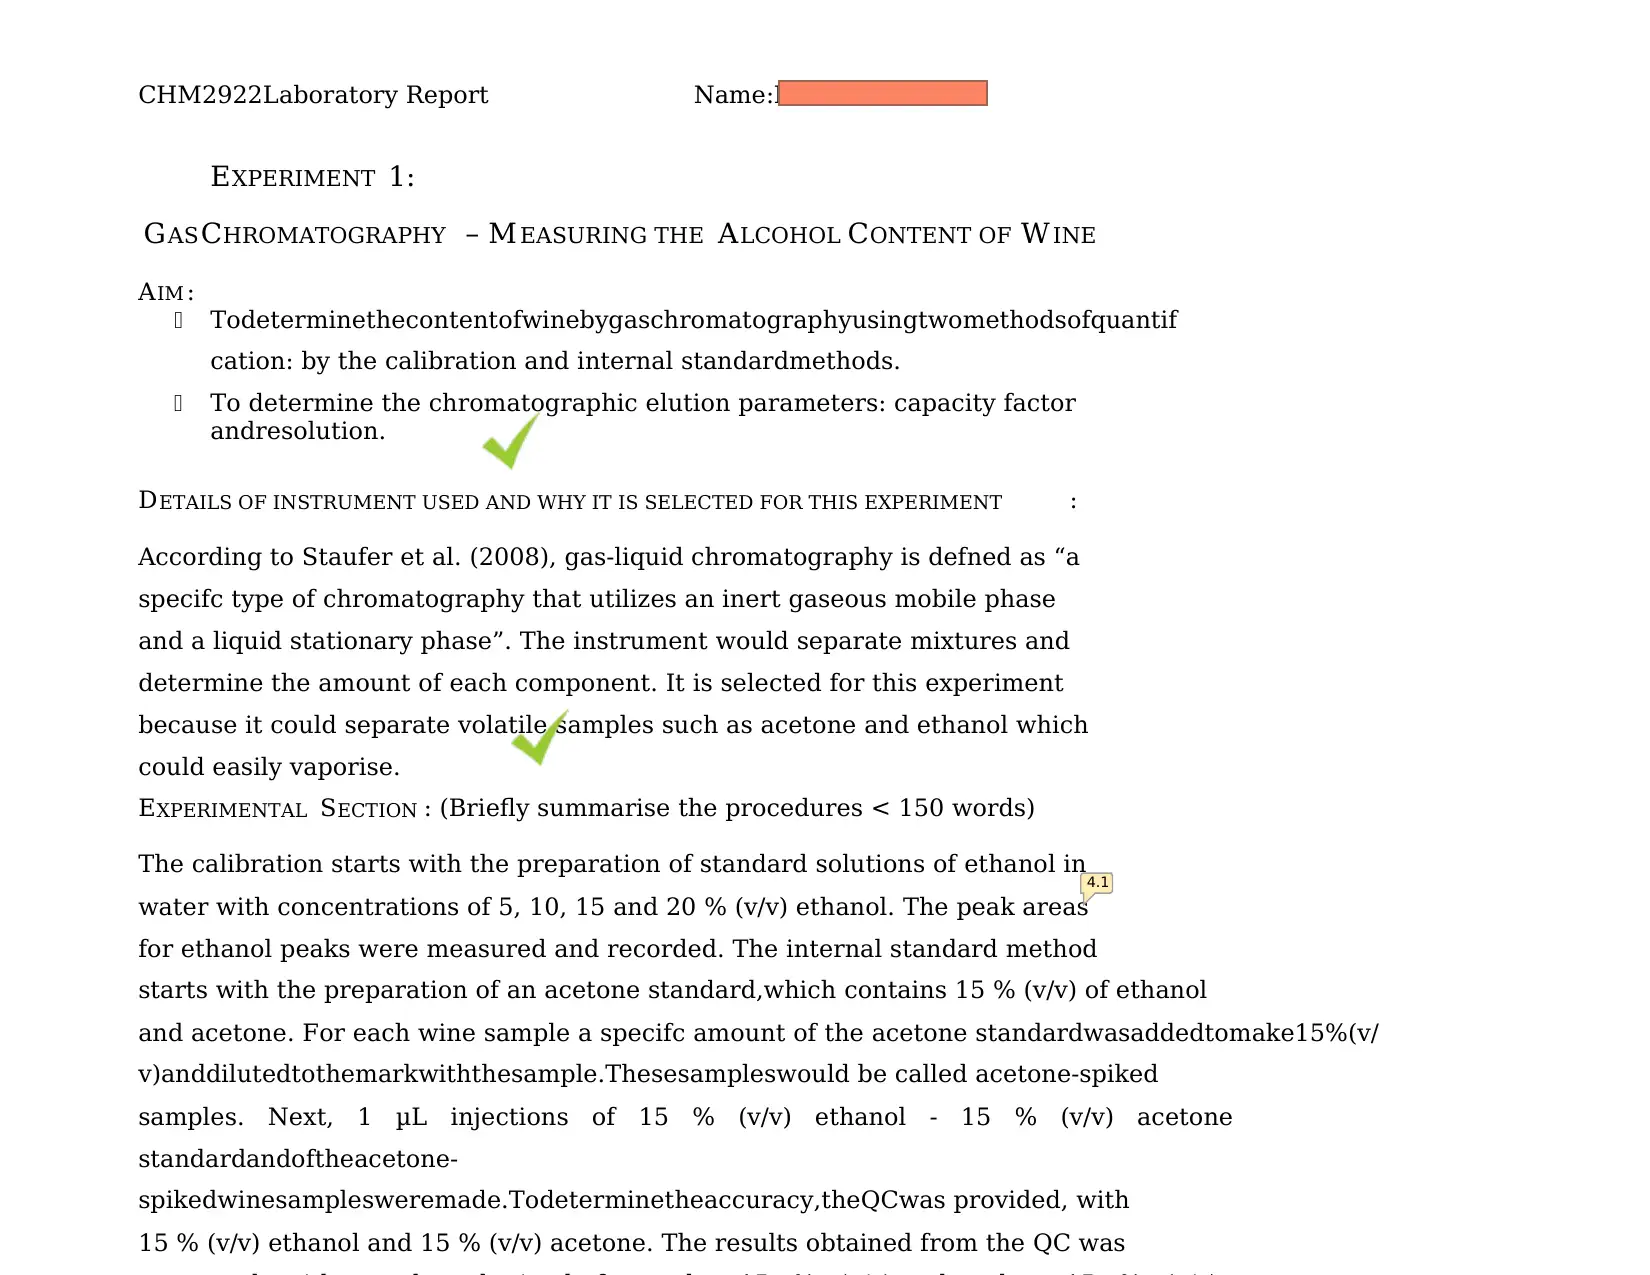
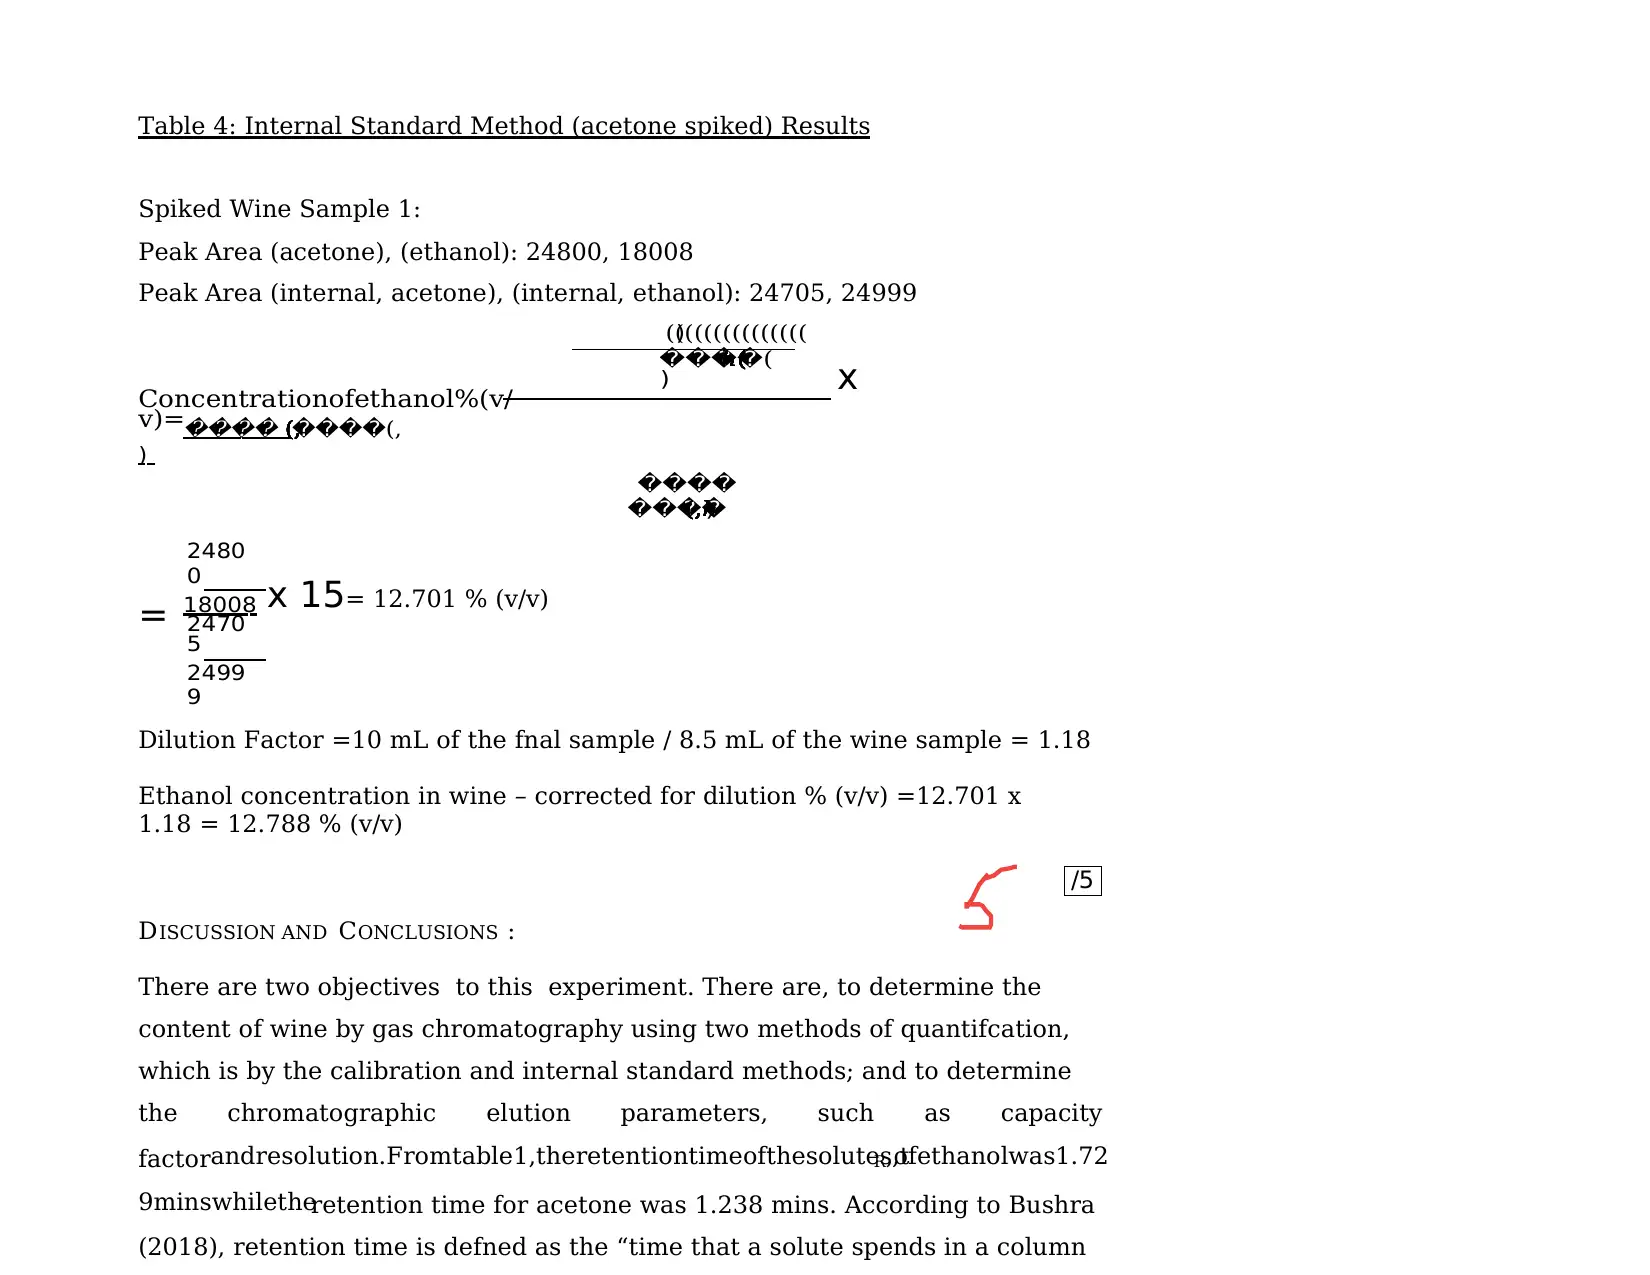
This lab report details an experiment using gas chromatography to determine the alcohol content of wine, employing both calibration and internal standard methods for quantification. The experiment involved preparing ethanol standard solutions and acetone-spiked wine samples, followed by gas chromatography analysis to measure peak areas and calculate ethanol concentrations. The report includes calculations for retention time, capacity factor, and resolution, alongside a discussion of the results' precision and accuracy. The findings from both quantification methods are compared, and the impact of oven temperature on retention time is discussed. The experiment successfully achieved its objectives, providing insights into chromatographic elution parameters and the quantification of alcohol in wine.

Spectroscopy and Analytical
Chemistry (CHM2922) - Lab Reports
Chemistry
Monash University, Malaysia Campus
65 pag.
Chemistry (CHM2922) - Lab Reports
Chemistry
Monash University, Malaysia Campus
65 pag.
Paraphrase This Document
Need a fresh take? Get an instant paraphrase of this document with our AI Paraphraser

Spectroscopy and
Analytical Chemistry
(CHM2922) – Lab
Reports
Analytical Chemistry
(CHM2922) – Lab
Reports

Intentional plagiarism or collusion amounts to cheating under Monash UniversityStatute 4.1
– Student Discipline.
Plagiarism:Plagiarismmeanstotakeanduseanotherperson’sideasandormannerofexpressingthemandt
opasstheseofas one’s own by failing to give appropriate acknowledgement, including the use of
material from any source, staf, students ortheinternet, published and unpublishedworks.
Collusion: Collusion means unauthorised collaboration on assessable written, oral or practical work
with another person.
Where there are reasonable grounds for believing that intentional plagiarism or collusion has
occurred, this will be reported to the Associate Dean (Education) or nominee, who may disallow the
work concerned by prohibiting assessment or refer the matter to the Faculty Discipline Panel for a
SCHOOL OF SCIENCE
ASSESSMENT COVER
SHEET
Student’s name (Surname)
Amran (Given names)
Nuramira Batrisyia
ID number 27467236 Phone
Unit name Spectroscopy and Analytical
Chemistry
Unit code CHM2922
t
Note: If this is a group assignment, please include the names of all other group members.
Title of
assignment
Experiment 1: Gas Chromatography - Measuring the Alcohol Content
of Wine
Lecturer/tutor Assoc Prof Dr Lim Yau Yan
Is this an authorisedgroup assignment? Yes No
Has any part of this assignment been previously submitted as part
ofanotherunit/course? Yes No
Tutorial/laboratory day &
time
Tuesday, 2PM
Due date Tuesday, 2PM Date submitted T u e s d a y
All work must be submitted by the due date. If an extension of work is granted this must be specifed
with the signature of the lecturer/tutor.
Extension granted until(date)................................ Signature of
lecturer/tutor.................................................
Please note that it is your responsibility to retain copies of your assessments.
Student Statement:
I have read the university’s Student Academic IntegrityPolicyandProcedures.
I understand the consequences of engaging in plagiarism and collusion as described
⊘ This is a preview!⊘
Do you want full access?
Subscribe today to unlock all pages.

Trusted by 1+ million students worldwide

Privacy Statement
The information on this form is collected for the primary purpose of assessing your assignment and ensuring the
academic integrity requirements of the University are met. Other purposes of collection include recording your
plagiarism and collusion declaration, attending to course and administrative matters and statistical analyses. If you
choose not to complete all the questions on this form it may not be possible for Monash University to assess your
assignment. You have a right to access personal information that Monash University holds about you, subject to
any exceptions in relevant legislation. If you wish to seek access to your personal information or inquire about the
handling of your personal
information, please contact the University Privacy Ofcer:privacyofcer@adm.monash.edu.au
Paraphrase This Document
Need a fresh take? Get an instant paraphrase of this document with our AI Paraphraser

RISK
ASSESSMENT
Name: Nuramira Amran
Lab Course details (e.g.
CHM
2922)
CHM2922 Date 5/8/2020
Experiment name and
number
Experiment 1: Gas Chromatography – Measuring the
Alcohol
Content of Wine
Identify the
HAZARD
(the POTENTIAL to do
harm)
Determine the RISK
(the PROBABILITY that
harm mayresult)
CONTROL the Risk
(PREVENTING an
incident)
Absolute ethanol Highly flammable. Causes
eye
irritation.
Handle in fumehood. Wear
protective gloves and
goggles
Acetone
Highly flammable. Causes
eye irritation. May cause
drowsiness
or dizziness.
Handle in fumehood.
Wear protective gloves
and goggles.
Glassware Cuts, stab wound from
sharp edges
Handle with care, dispose
of
broken glass using a
dustpan & brush. If cut,
see demonstrator.

CHM2922Laboratory Report Name:NuramiraAmran
EXPERIMENT 1:
GASCHROMATOGRAPHY – M EASURING THE ALCOHOL CONTENT OF W INE
AIM :
Todeterminethecontentofwinebygaschromatographyusingtwomethodsofquantif
cation: by the calibration and internal standardmethods.
To determine the chromatographic elution parameters: capacity factor
andresolution.
DETAILS OF INSTRUMENT USED AND WHY IT IS SELECTED FOR THIS EXPERIMENT :
According to Staufer et al. (2008), gas-liquid chromatography is defned as “a
specifc type of chromatography that utilizes an inert gaseous mobile phase
and a liquid stationary phase”. The instrument would separate mixtures and
determine the amount of each component. It is selected for this experiment
because it could separate volatile samples such as acetone and ethanol which
could easily vaporise.
EXPERIMENTAL SECTION : (Briefly summarise the procedures < 150 words)
The calibration starts with the preparation of standard solutions of ethanol in
water with concentrations of 5, 10, 15 and 20 % (v/v) ethanol. The peak areas
for ethanol peaks were measured and recorded. The internal standard method
starts with the preparation of an acetone standard,which contains 15 % (v/v) of ethanol
and acetone. For each wine sample a specifc amount of the acetone standardwasaddedtomake15%(v/
v)anddilutedtothemarkwiththesample.Thesesampleswould be called acetone-spiked
samples. Next, 1 μL injections of 15 % (v/v) ethanol - 15 % (v/v) acetone
standardandoftheacetone-
spikedwinesamplesweremade.Todeterminetheaccuracy,theQCwas provided, with
15 % (v/v) ethanol and 15 % (v/v) acetone. The results obtained from the QC was
4.1
⊘ This is a preview!⊘
Do you want full access?
Subscribe today to unlock all pages.

Trusted by 1+ million students worldwide

/
tR(acetone) = 1.398
mins
t’R(acetone) = 1.238
mins
k’ (acetone) =
7.7375
w (ethanol) = 0.1
mins
w (acetone) = 0.1
mins
R = 4.91
1 of 8
tR(acetone) = 1.398
mins
t’R(acetone) = 1.238
mins
k’ (acetone) =
7.7375
w (ethanol) = 0.1
mins
w (acetone) = 0.1
mins
R = 4.91
1 of 8
Paraphrase This Document
Need a fresh take? Get an instant paraphrase of this document with our AI Paraphraser

/
/
Ethanol Concentration % (v/v)
2520051015
y = 743.41x - 142.45
R² = 0.9996
16000
14000
12000
10000
8000
6000
4000
2000
0
Calibration Graph of Peak Area vs Diferent
Concentration of Ethanol Standard Solution
Table 2: Calibration data
Ethanol
concentrat
ion
%(v/v)
Peak
area 1
Peak
area 2
Peak
area 3
Mean
area
Standa
rd
deviati
on
% RSD
5 3374.06 3586.62 14504.39 3541 15
0
4.
2
10 7339.71 7408.66 11224.34 7277 17
3
2.
4
15 11426.4 10766.45 7081.15 11139 33
8
3.
0
20 14492.62 14935.07 3663.25 14644 25
2
1.
7
Calibration Graph
Figure1:Calibrationgraphofpeakareasvsethanolindiferentconcentration,5%,10
%,15% and 20%
Peak Area
6.1

/
Table 3: Calibration method results
Wine Sample run
number
Peak area (Ethanol) Calculated
Ethanol
Concentration - %
(v/v)
1 8167.85 11.179
2 8065.78 11.041
3 8095.57 11.081
Average
concentration -
%(v/v)
11.1
Standard deviation 0.0706
04
Relative standard
deviation
(%)
0.6360
5
Table 4: Internal standard method (acetone spiked) results
Internal
standard
number
Peak area
(Acetone)
Peak area
(Ethanol)
1 24705 24999
2 24819 25131
3 24616 25131
Average area 24713.33 101.75
Standard
Deviation
25087 76.21
⊘ This is a preview!⊘
Do you want full access?
Subscribe today to unlock all pages.

Trusted by 1+ million students worldwide

/
Average
concentrati
on (% v/v)
10.838
Standard
deviation
0.0731
75
Dilution factor 1.18
Ethanol
concentration in
wine - corrected
for dilution (% v/
v)
12.788
Relative
standard
deviation
(%)
0.6752
CALCULATIONS
Table 1: Peak Elution Data
t’R(ethanol)= t R– tM
= 1.889 – 0.16 = 1.729 mins
k’ (ethanol)= t’ R/ tM= 1.729 / 0.16 = 10.81 mins
R =2 (t R(ethanol) – tR(acetone)) / (w (ethanol) + w (acetone))
= 2 (1.889 – 1.398) / (0.1 + 0.1) = 4.91 mins
Table 2: Calibration Data
For 5% ethanol concentration:
Average peak area = (3374.06 + 3586.62 + 3663.25) / 3 = 3541
Standard Deviation = √ ((3374.06 – 3541) 2+ (3586.62 – 3541)2+ (3663.25 –
Paraphrase This Document
Need a fresh take? Get an instant paraphrase of this document with our AI Paraphraser

Peak Area = 8167.85
From the equation obtained by calibration graph: y = 743.41x – 142.45
Ethanol Concentration % (v/v)= (8167.85 + 142.45) / 743.41 = 11.179 % (v/v)
From the equation obtained by calibration graph: y = 743.41x – 142.45
Ethanol Concentration % (v/v)= (8167.85 + 142.45) / 743.41 = 11.179 % (v/v)

/5
Table 4: Internal Standard Method (acetone spiked) Results
Spiked Wine Sample 1:
Peak Area (acetone), (ethanol): 24800, 18008
Peak Area (internal, acetone), (internal, ethanol): 24705, 24999
)(((((((((((((((
����(ℎ(ℎ(ℎ(ℎ(ℎ(ℎ(ℎ(ℎ(ℎ(ℎ(ℎ(ℎ(ℎ(ℎ(ℎ
)
Concentrationofethanol%(v/
v)=���� ����(,(,(,(,(,(,(,(,(,(,(,(,(,(,(,
)
����
����)(,ℎ(,ℎ(,ℎ(,ℎ(,ℎ(,ℎ(,ℎ(,ℎ(,ℎ(,ℎ(,ℎ(,ℎ(,ℎ(,ℎ(,ℎ
2480
0
18008
2470
5
2499
9
x 15= 12.701 % (v/v)
Dilution Factor =10 mL of the fnal sample / 8.5 mL of the wine sample = 1.18
Ethanol concentration in wine – corrected for dilution % (v/v) =12.701 x
1.18 = 12.788 % (v/v)
DISCUSSION AND CONCLUSIONS :
There are two objectives to this experiment. There are, to determine the
content of wine by gas chromatography using two methods of quantifcation,
which is by the calibration and internal standard methods; and to determine
the chromatographic elution parameters, such as capacity
factorandresolution.Fromtable1,theretentiontimeofthesolutes,tR,ofethanolwas1.72
9minswhiletheretention time for acetone was 1.238 mins. According to Bushra
(2018), retention time is defned as the “time that a solute spends in a column
x
=
⊘ This is a preview!⊘
Do you want full access?
Subscribe today to unlock all pages.

Trusted by 1+ million students worldwide
1 out of 66
Related Documents

Your All-in-One AI-Powered Toolkit for Academic Success.
+13062052269
info@desklib.com
Available 24*7 on WhatsApp / Email
Unlock your academic potential
Copyright © 2020–2025 A2Z Services. All Rights Reserved. Developed and managed by ZUCOL.