Monetary Policy: Australia and Euro Area Interest Rate Analysis

Verified

Added on  2023/06/04

|6
|1178
|343
Report
AI Summary
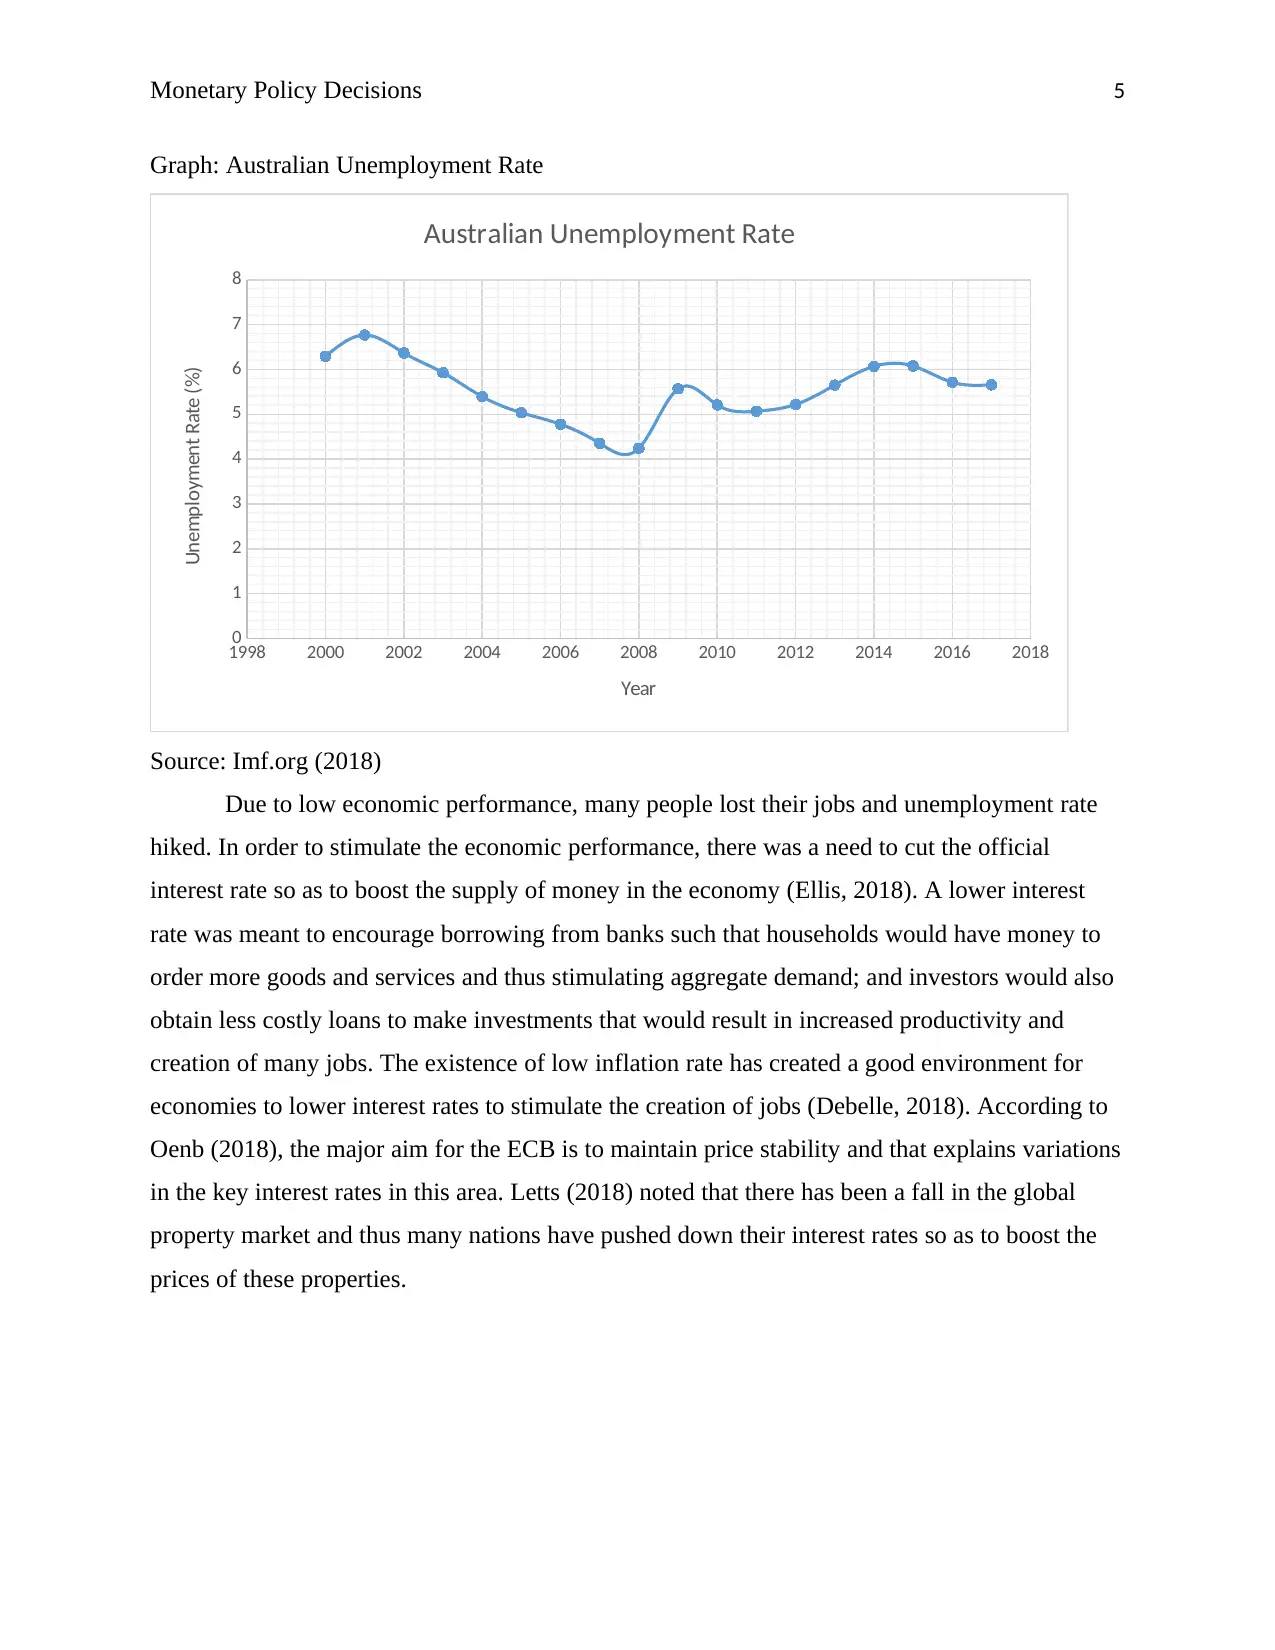
This report provides a comparative analysis of monetary policy decisions in Australia and the Euro area, examining trends in official cash rates, key interest rates, inflation, and unemployment from 2000 to 2017. The analysis includes graphical representations of the Australian cash rate and the Euro area interest rates, along with data on inflation and unemployment rates in Australia. The report explores the reasons behind the monetary policy decisions, such as the RBA's response to high inflation and the subsequent rate cuts following the 2008 global recession, as well as the ECB's focus on maintaining price stability. The study highlights how both economies have adjusted their monetary policies in response to economic changes, including the global recession and its impact on unemployment and property markets, while also considering the impact of low productivity and stagnating wages on the standards of living. The report also references relevant sources and provides an overview of how different factors influence monetary policy in these two distinct economic regions.
Document Page
Running Head: Monetary Policy Decisions
Monetary Policy in Australia and the Euro Area
Student Name
Institutional Affiliation
Course/Number
Instructor Name
Due Date
tabler-icon-diamond-filled.svg

Paraphrase This Document

Need a fresh take? Get an instant paraphrase of this document with our AI Paraphraser
Document Page
Monetary Policy Decisions 2
Monetary Policy in Australia and the Euro Area
Part a
Graph: Australian Historical Official Cash Rate (2000 – 2017)
1998 2000 2002 2004 2006 2008 2010 2012 2014 2016 2018
0.00
1.00
2.00
3.00
4.00
5.00
6.00
7.00
8.00
Australian Historical Official Cash Rate (2000 - 2017)
Year
Cash Rate (%)
Source: Rba.gov.au (2018)
For the period between year 2000 and 2008, the Australian cash rate was on a rising
trend. The highest reported official cash rate was in 2008. The 2008 global recession that led to
low economic performance for many economies was the starting base for the cut in the cash rate.
In 2008, the cash rate was cut from 7.25 to 4.25%. The rate was further cut in 2009 to a low level
of 3.00%. The rate rose to 4.75% as at the year 2010. Since then up to the year 2017, the trend
has been falling. The lowest level of all times was reported in 2016; the rate was 1.5%. This rate
of 1.5% has been constant up to date.
Document Page
Monetary Policy Decisions 3
Graph: The key Euro area interest rate (Deposit facility, Marginal refinancing Operations (MRO)
and Marginal Lending Facility (MLF) (2000 – 2017)
1998 2000 2002 2004 2006 2008 2010 2012 2014 2016 2018
0
1
2
3
4
5
6
7
Euro Area Interest Rate
Deposit Facility Marginal Refinancing Operations
Marginal Lending Facility
Year
Euro area Interest Rate
Source: Europa.eu. (2018)
All the three Euro area key interest rate were exhibiting a positive trend. There were
several changes for each in 2000, several in 2001, a single change in 2001, no change until 2005,
many changes in 2006, and fewer changes in 2007 and 2008. The marginal lending facility is
higher than other key interest rate, followed by marginal refinancing operations rate, and finally,
the deposit facility rate is the lowest for all the periods. From 28th June 2000 to 9th July 2008, the
MRO was on a variable bases. From 4th February 2000 to 9th June 2000, and from 15th October
2008 to 16th March 2016, the MRO was on a fixed basis.
Part b
Between 2000 and 2008, the RBA was raising the official cash rate because the
Australian inflation rate was very high by then. The European Central Bank (ECB) was also
raising its key interest rate. This means that many economies had issues of high inflation rate
prior to the 2008 global crisis.
Document Page
Monetary Policy Decisions 4
Graph: Australian Inflation Rate
1998 2000 2002 2004 2006 2008 2010 2012 2014 2016 2018
0
0.5
1
1.5
2
2.5
3
3.5
4
4.5
5
Australian Inflation Rate
Year
Inflation Rate
Source: Imf.org (2018)
The high official cash rate hike was meant for discouraging banks from borrowing from
the RBA and also the European Central Bank (ECB). In return, the money supply was expected
to fall such that households would borrow less money from the banks since a higher cash rate
also leads to a raise in lending rates for the banks. With less money, households would cut their
hiked demand and thus the price level would fall. The reason for rate cuts since 2008 is because
the Global recession lead to poor economic performance in a situation where production was low
and there was a shortage in aggregate demand. All economies in the world were hurt; the
Australian economy was among the few economies that were slightly hurt. After 2008, the
inflation rate has been low and thus not a threat for governments on lowering the key interest
rates. According to Zhang (2017), due to low productivity, the standards of living have stagnated
due to rigidness of income. Wages have not changed with the changes in economic situations. In
an attempt to improve the standards of living, interest rate has been lowered to stimulate
investment.
tabler-icon-diamond-filled.svg

Paraphrase This Document

Need a fresh take? Get an instant paraphrase of this document with our AI Paraphraser
Document Page
Monetary Policy Decisions 5
Graph: Australian Unemployment Rate
1998 2000 2002 2004 2006 2008 2010 2012 2014 2016 2018
0
1
2
3
4
5
6
7
8
Australian Unemployment Rate
Year
Unemployment Rate (%)
Source: Imf.org (2018)
Due to low economic performance, many people lost their jobs and unemployment rate
hiked. In order to stimulate the economic performance, there was a need to cut the official
interest rate so as to boost the supply of money in the economy (Ellis, 2018). A lower interest
rate was meant to encourage borrowing from banks such that households would have money to
order more goods and services and thus stimulating aggregate demand; and investors would also
obtain less costly loans to make investments that would result in increased productivity and
creation of many jobs. The existence of low inflation rate has created a good environment for
economies to lower interest rates to stimulate the creation of jobs (Debelle, 2018). According to
Oenb (2018), the major aim for the ECB is to maintain price stability and that explains variations
in the key interest rates in this area. Letts (2018) noted that there has been a fall in the global
property market and thus many nations have pushed down their interest rates so as to boost the
prices of these properties.
Document Page
Monetary Policy Decisions 6
Bibliography
Debelle, G. (2018). The State of the Labor Market. Retrieved from
https://www.rba.gov.au/speeches/2018/sp-dg-2018-10-17.html.
Ellis, L. (2018). Supporting Growth in the Short Run and the Long Run. Retrieved from
https://www.rba.gov.au/speeches/2018/sp-ag-2018-10-11.html.
Europa.eu. (2018). Official interest rates. Retrieved from
https://www.ecb.europa.eu/stats/policy_and_exchange_rates/key_ecb_interest_rates/
html/index.en.html.
Imf.org. (2018). Report for Selected Countries and Subjects. Retrieved from
https://www.imf.org/external/pubs/ft/weo/2016/02/weodata/weorept.aspx?
pr.x=67&pr.y=0&sy=2000&ey=2017&scsm=1&ssd=1&sort=country&ds=.&br=1&c=19
3&s=PCPIPCH%2CLUR&grp=0&a=.
Letts, S. (2018). Record low interest rate rolls into its second year. Retrieved from
https://www.abc.net.au/news/2018-08-07/rba-record-low-interest-rate-rolls-into-its-
second-year/10082830.
Rba.gov.au. (2018). Cash Rate. Retrieved from https://www.rba.gov.au/statistics/cash-rate/.
Oenb. (2018). Monetary policy. Retrieved from https://www.oenb.at/en/Monetary-Policy.html.
Zhang, T. (2018). Global Economic Challenges and Opportunities. Retrieved from
https://www.imf.org/en/News/Articles/2017/09/25/sp092517-global-economic-
challenges-and-opportunities.
chevron_up_icon
1 out of 6
circle_padding
hide_on_mobile
zoom_out_icon
[object Object]