Money and Capital Market Analysis Report: Australian and US Markets

Verified

Added on  2021/05/31

|10
|917
|29
Report
AI Summary
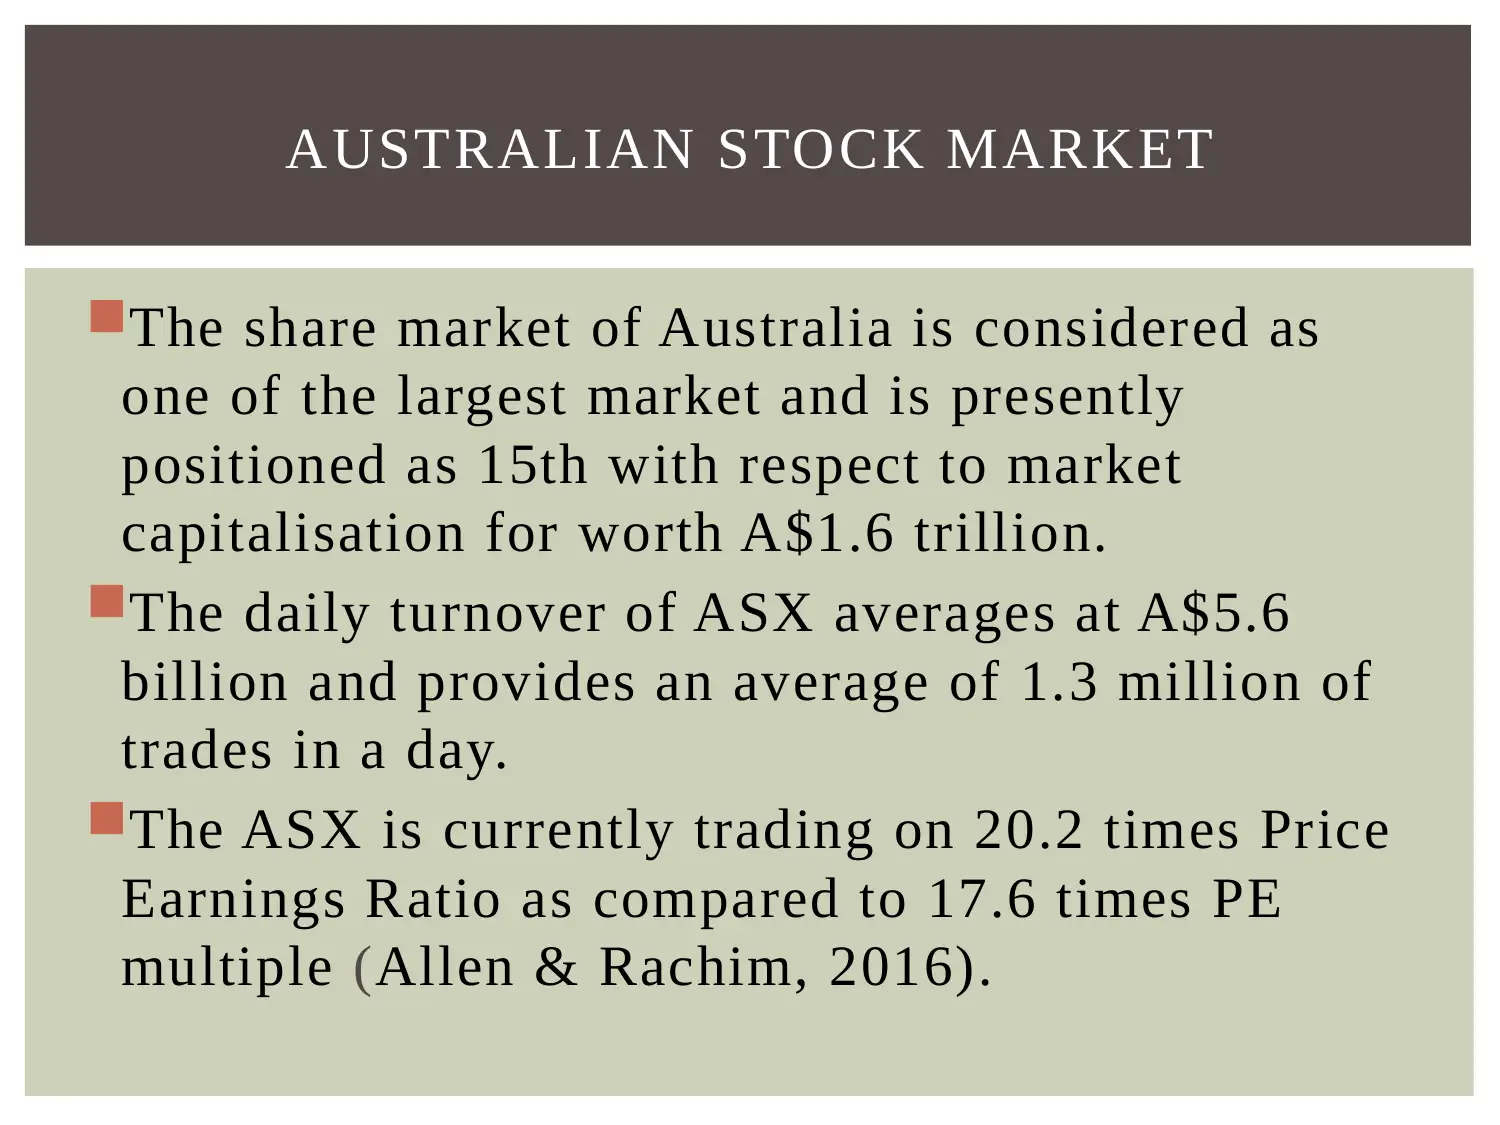
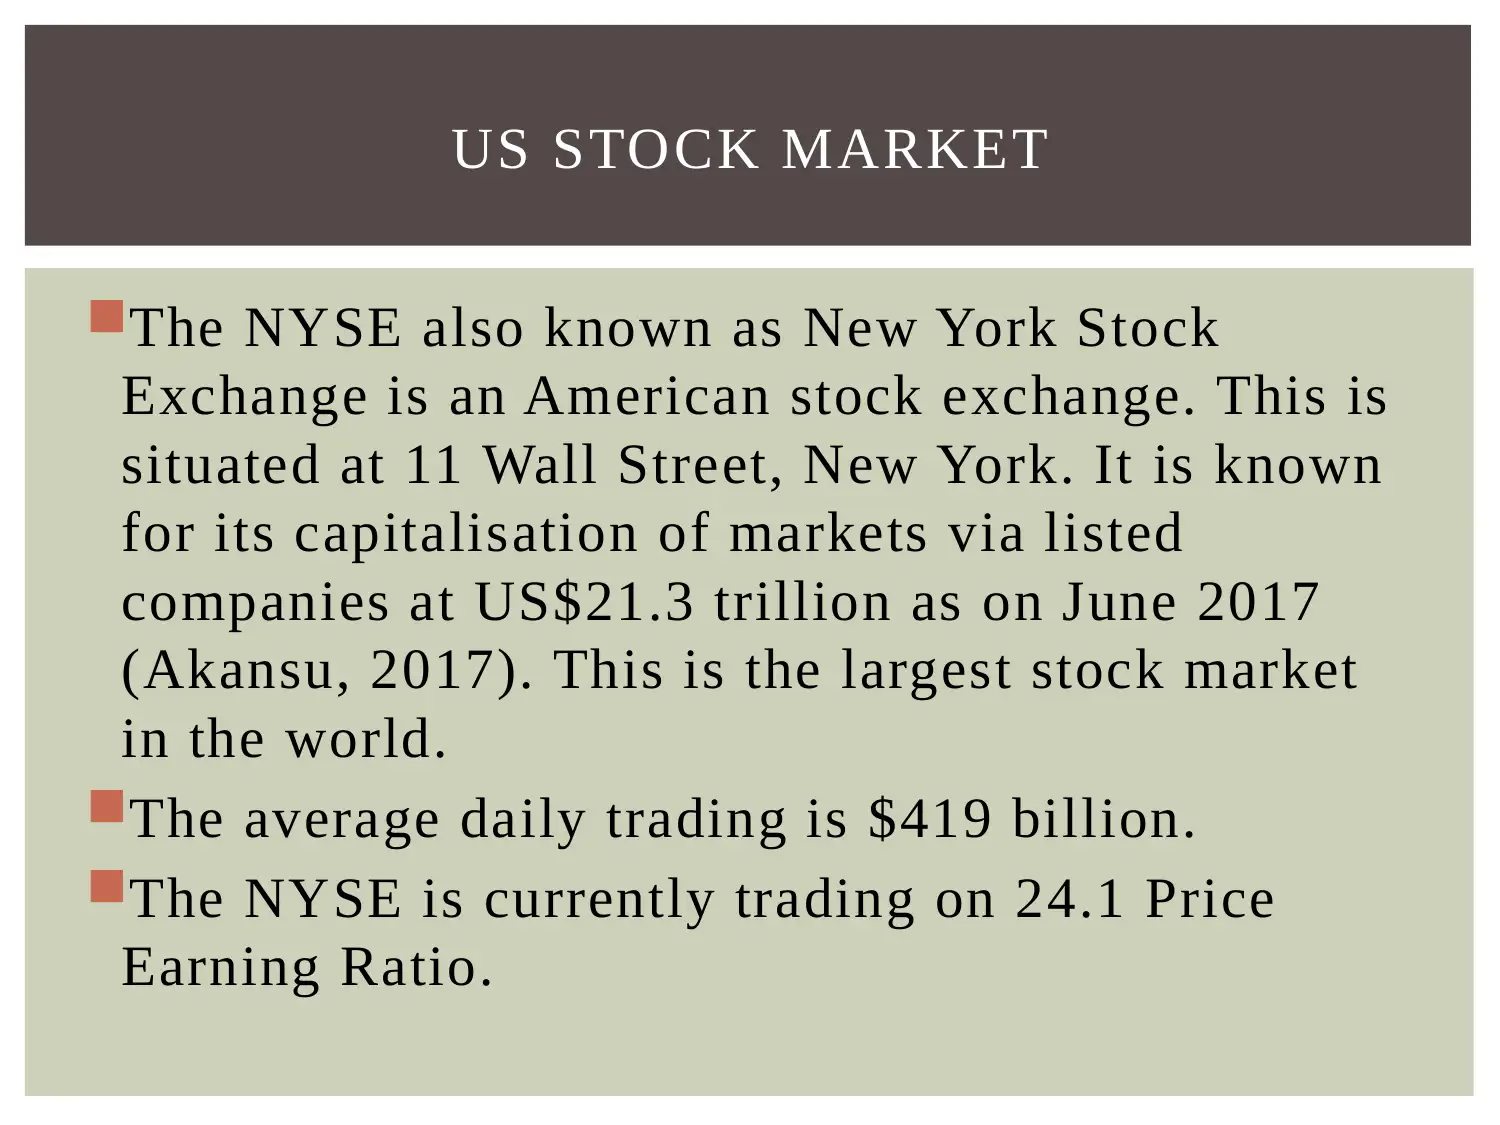
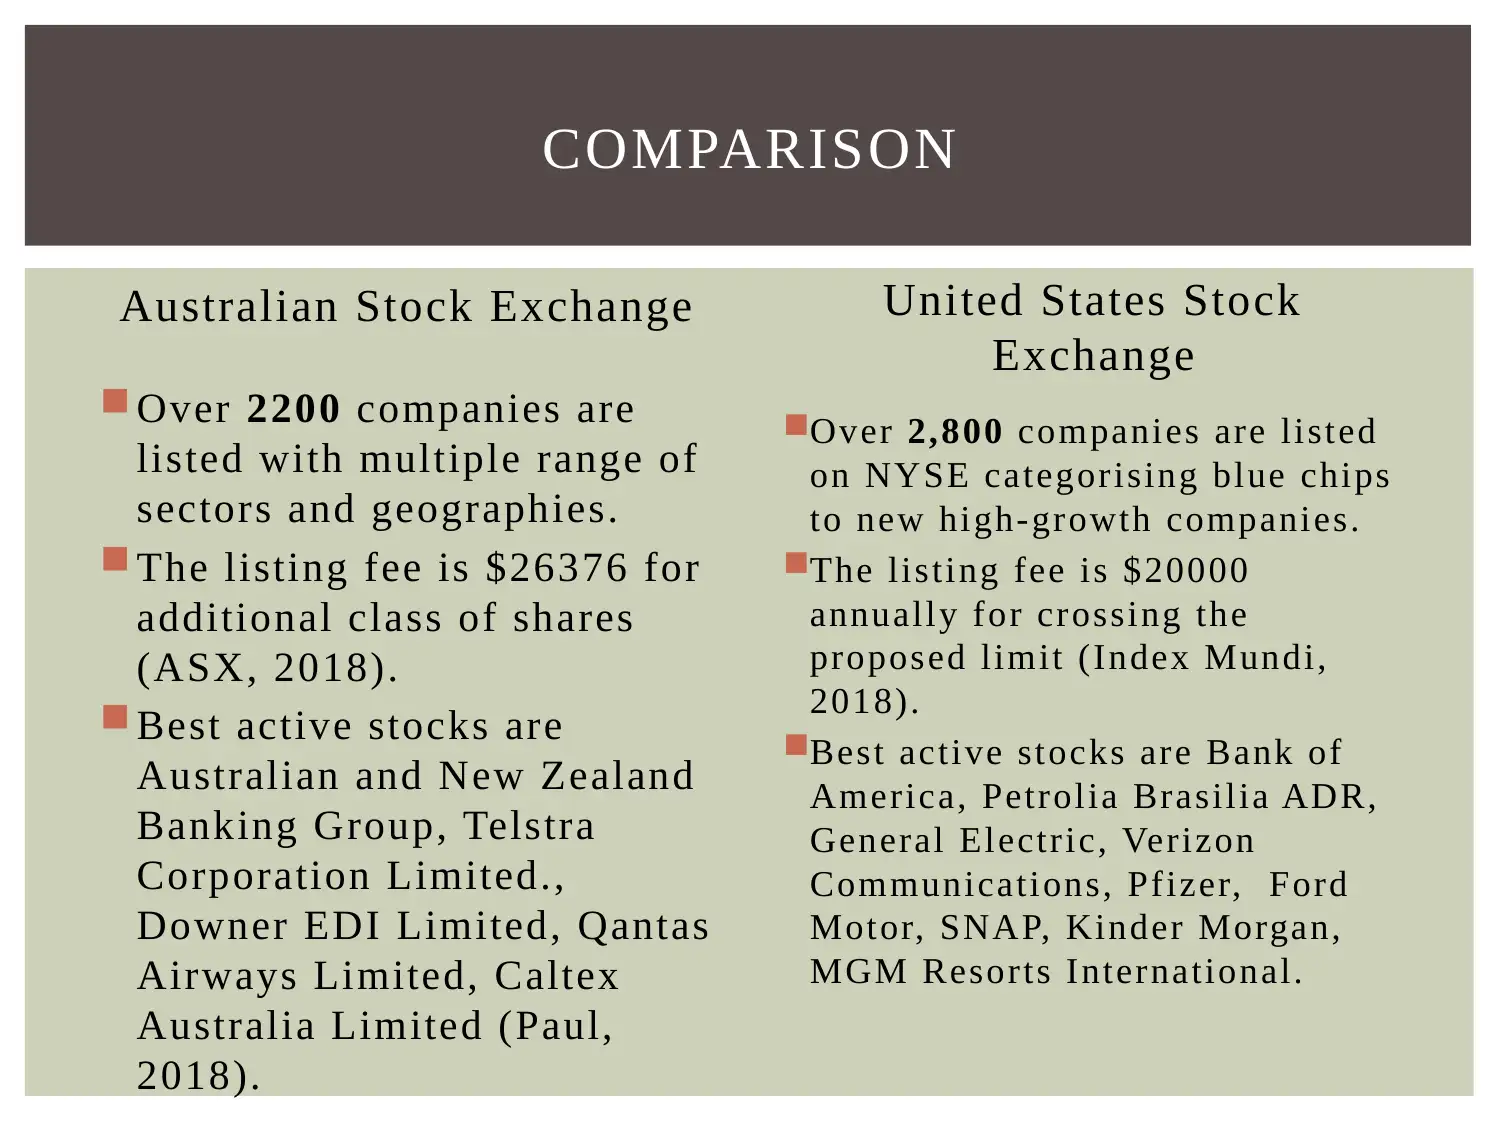
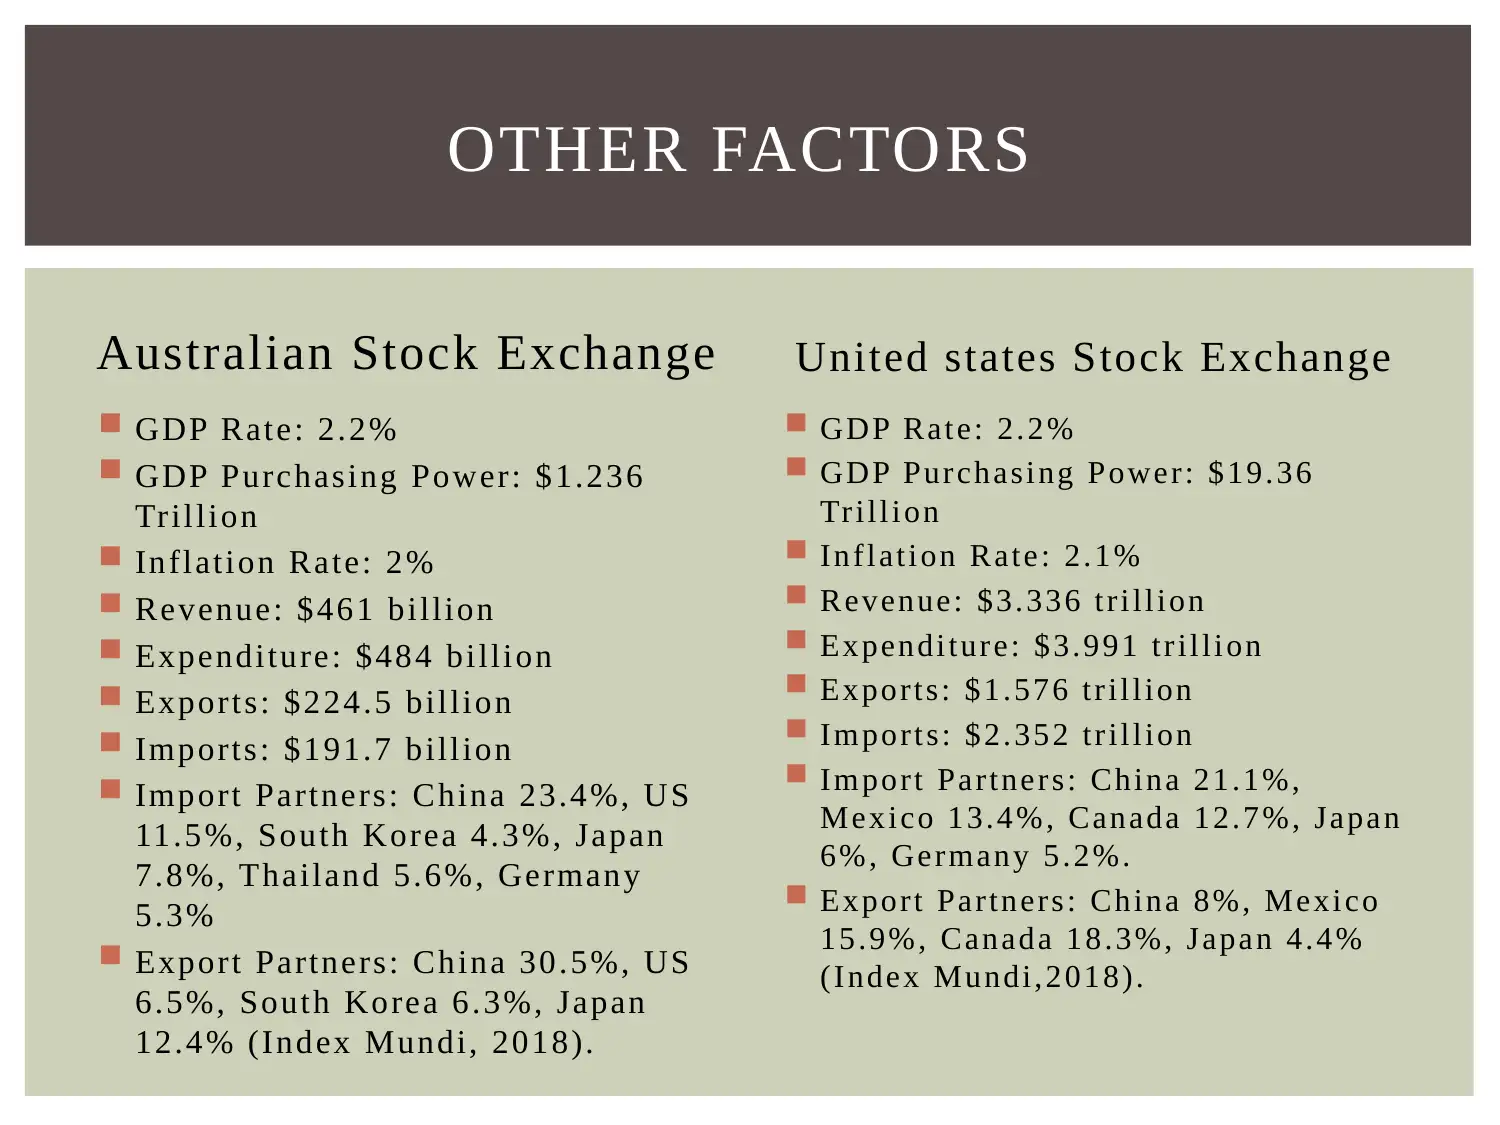
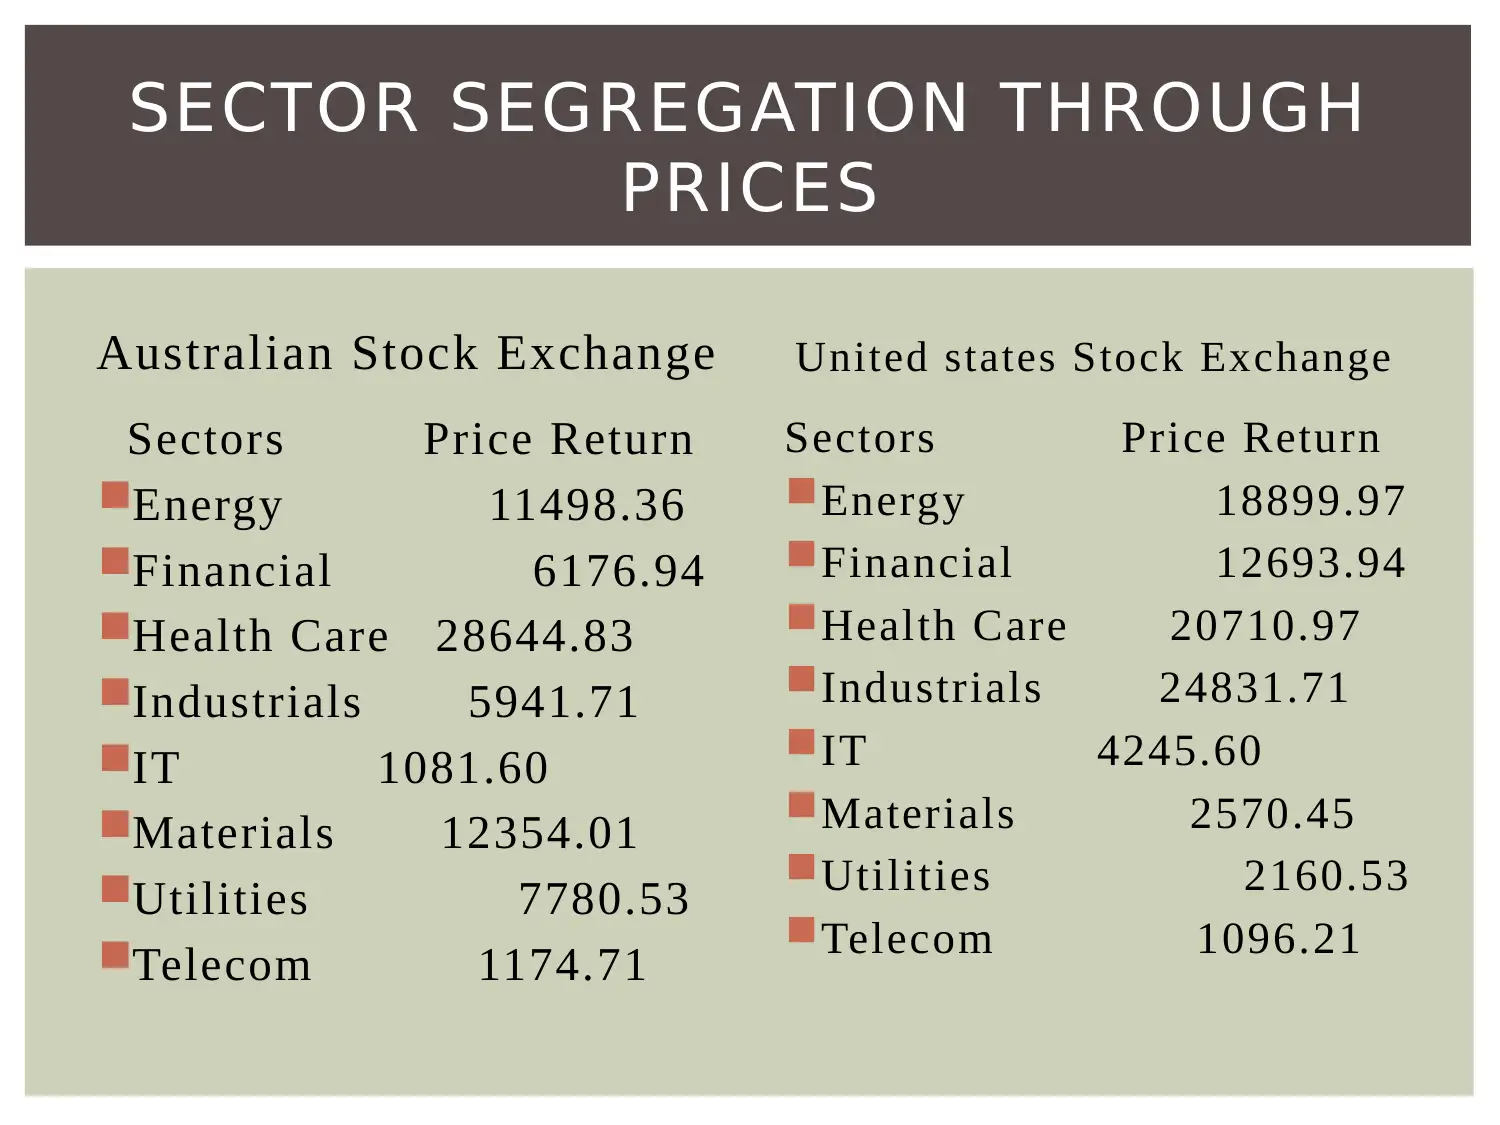
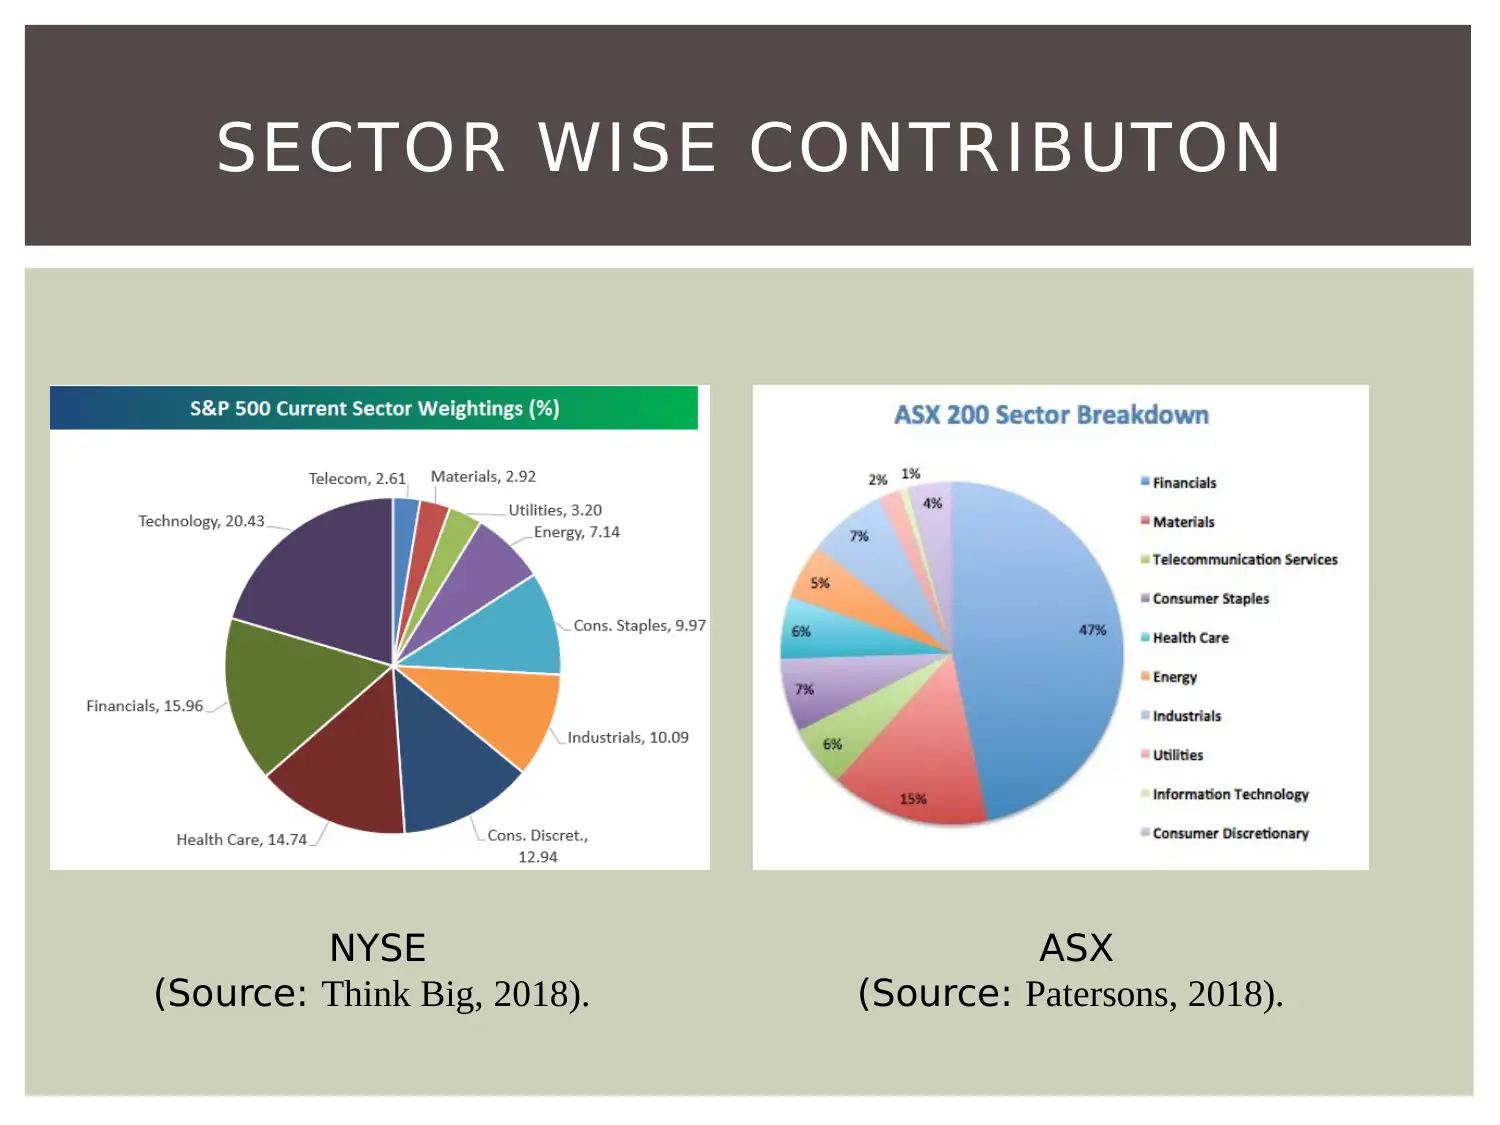
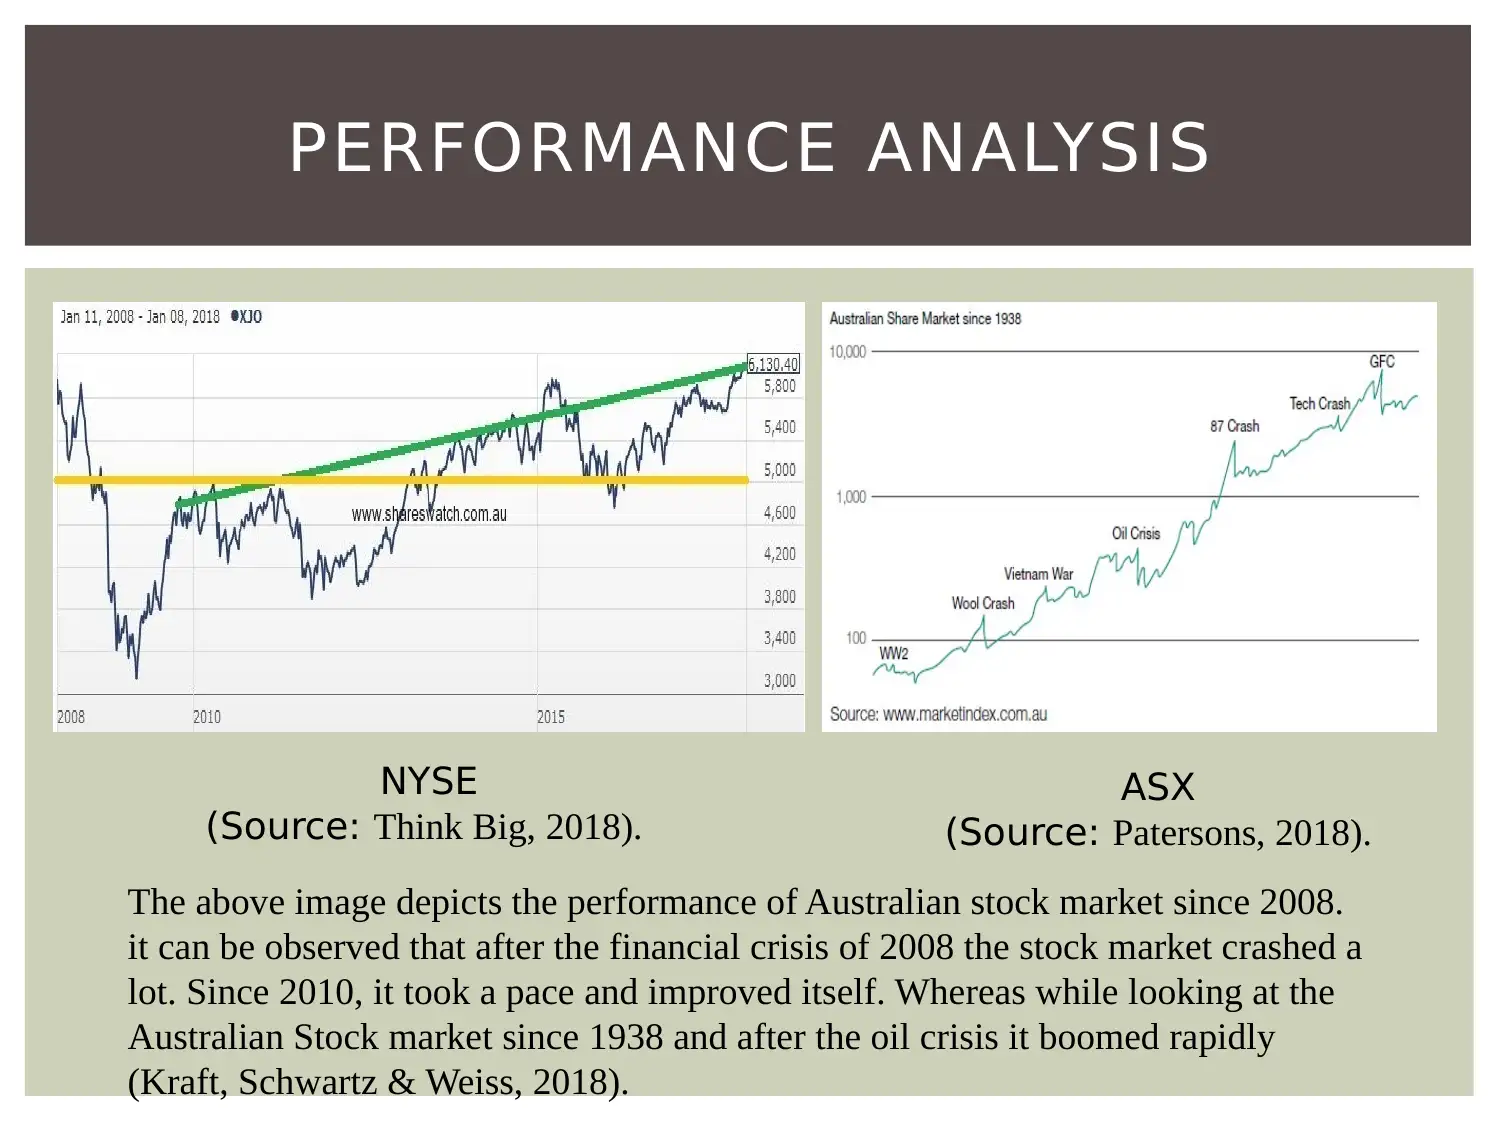
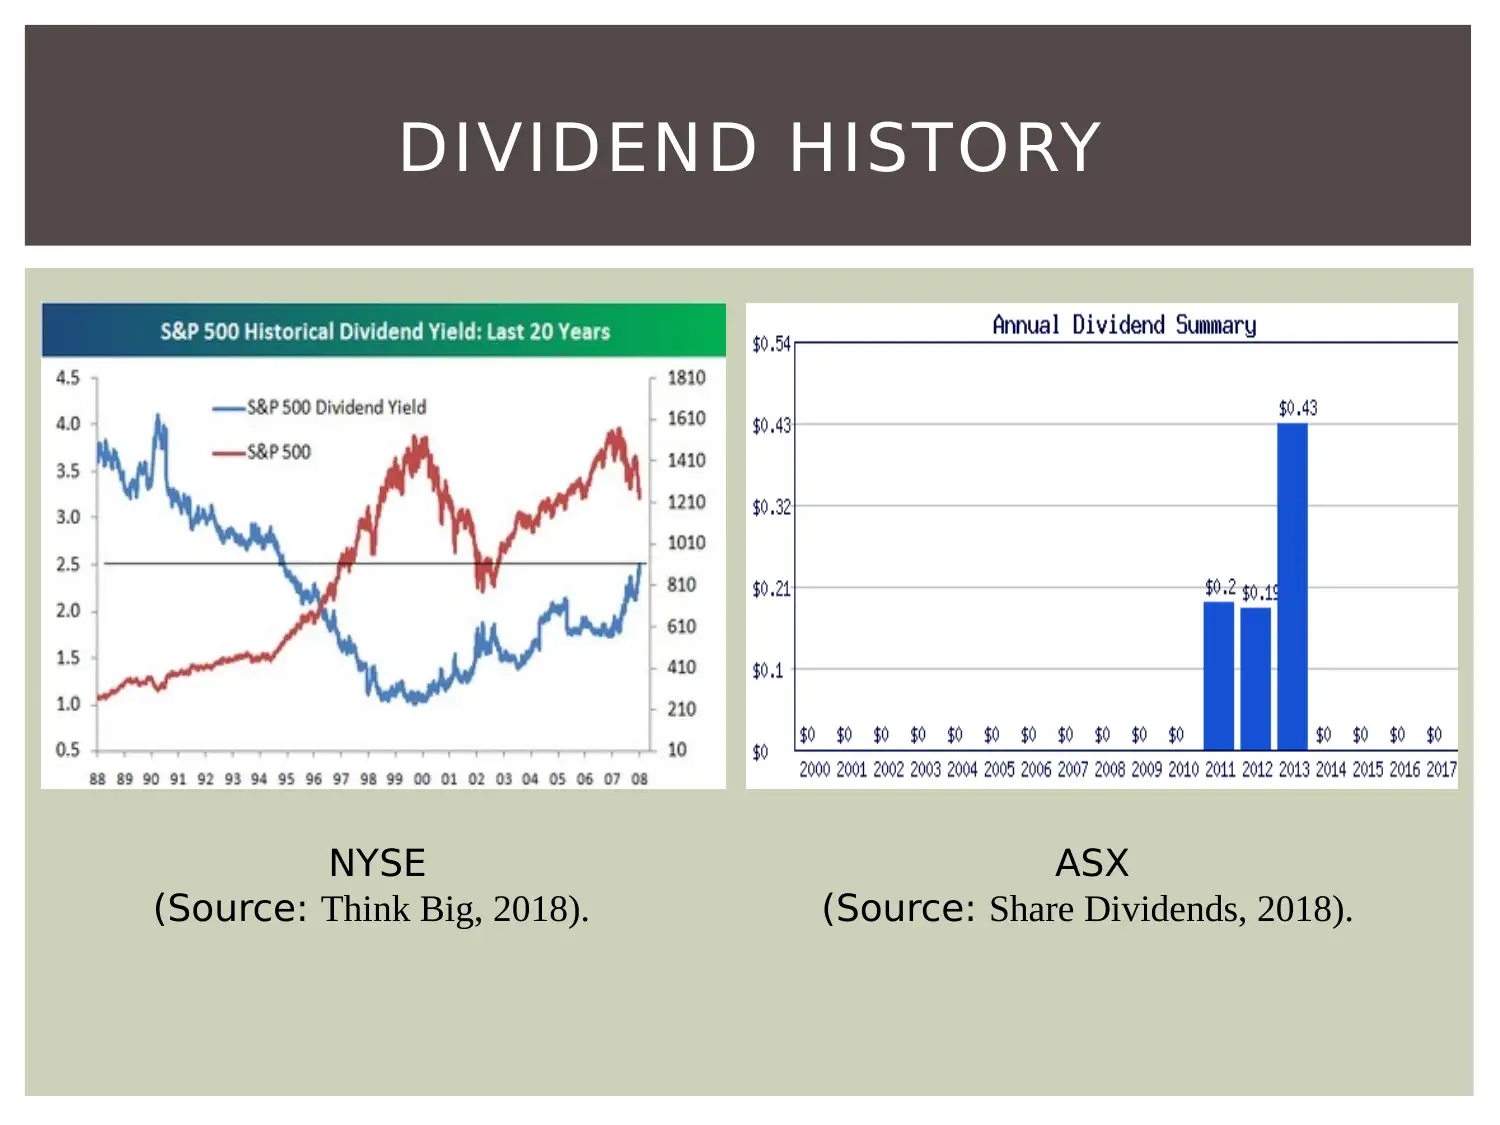
This report provides a comparative analysis of the Australian Stock Exchange (ASX) and the New York Stock Exchange (NYSE), focusing on key financial metrics and market performance. It begins by outlining the market capitalization, daily turnover, and Price-Earnings ratio of both exchanges. The report then compares the number of listed companies, listing fees, and best-performing stocks on each exchange. A detailed comparison of economic indicators, including GDP, inflation rates, exports, and imports, is presented for both countries. The report also examines sector-wise contributions to each market, using price return data for various sectors like Energy, Financials, and Healthcare. Historical performance, dividend history, and sector segregation are visualized. The report concludes by referencing key sources like ASX, NYSE, and various financial publications to support its findings and provide a comprehensive overview of the financial markets.
Document Page
MONEY AND CAPITAL
MARKET
ANALYSIS
tabler-icon-diamond-filled.svg

Paraphrase This Document

Need a fresh take? Get an instant paraphrase of this document with our AI Paraphraser
Document Page
The share market of Australia is considered as
one of the largest market and is presently
positioned as 15th with respect to market
capitalisation for worth A$1.6 trillion.
The daily turnover of ASX averages at A$5.6
billion and provides an average of 1.3 million of
trades in a day.
The ASX is currently trading on 20.2 times Price
Earnings Ratio as compared to 17.6 times PE
multiple (Allen & Rachim, 2016).
AUSTRALIAN STOCK MARKET
Document Page
The NYSE also known as New York Stock
Exchange is an American stock exchange. This is
situated at 11 Wall Street, New York. It is known
for its capitalisation of markets via listed
companies at US$21.3 trillion as on June 2017
(Akansu, 2017). This is the largest stock market
in the world.
The average daily trading is $419 billion.
The NYSE is currently trading on 24.1 Price
Earning Ratio.
US STOCK MARKET
Document Page
Australian Stock Exchange
Over 2200 companies are
listed with multiple range of
sectors and geographies.
The listing fee is $26376 for
additional class of shares
(ASX, 2018).
Best active stocks are
Australian and New Zealand
Banking Group, Telstra
Corporation Limited.,
Downer EDI Limited, Qantas
Airways Limited, Caltex
Australia Limited (Paul,
2018).
United States Stock
Exchange
Over 2,800 companies are listed
on NYSE categorising blue chips
to new high-growth companies.
The listing fee is $20000
annually for crossing the
proposed limit (Index Mundi,
2018).
Best active stocks are Bank of
America, Petrolia Brasilia ADR,
General Electric, Verizon
Communications, Pfizer, Ford
Motor, SNAP, Kinder Morgan,
MGM Resorts International.
COMPARISON
tabler-icon-diamond-filled.svg

Paraphrase This Document

Need a fresh take? Get an instant paraphrase of this document with our AI Paraphraser
Document Page
Australian Stock Exchange
GDP Rate: 2.2%
GDP Purchasing Power: $1.236
Trillion
Inflation Rate: 2%
Revenue: $461 billion
Expenditure: $484 billion
Exports: $224.5 billion
Imports: $191.7 billion
Import Partners: China 23.4%, US
11.5%, South Korea 4.3%, Japan
7.8%, Thailand 5.6%, Germany
5.3%
Export Partners: China 30.5%, US
6.5%, South Korea 6.3%, Japan
12.4% (Index Mundi, 2018).
United states Stock Exchange
GDP Rat e: 2.2%
GDP Pur chasi ng Powe r: $19. 36
Tr ill ion
Inf lati on Rate : 2. 1%
Revenue: $3.336 tr ill ion
Expenditur e: $3. 991 tr illi on
Exports: $1.576 tr ill ion
Im port s: $2.352 tr il lion
Im port Pa rtne r s: China 21.1%,
Me xico 13.4% , Canada 12.7%, Ja pa n
6% , Ge rm any 5.2%.
Export Pa rtner s: China 8%, Me xico
15.9% , Canada 18.3%, Ja pa n 4.4%
(I nde x M undi,2018) .
OTHER FACTORS
Document Page
Australian Stock Exchange
Sectors Price Return
Energy 11498.36
Financial 6176.94
Health Care 28644.83
Industrials 5941.71
IT 1081.60
Materials 12354.01
Utilities 7780.53
Telecom 1174.71
United states Stock Exchange
Sectors Price Return
Energy 18899.97
Financial 12693.94
Health Care 20710.97
Industrials 24831.71
IT 4245.60
Materials 2570.45
Utilities 2160.53
Telecom 1096.21
SECTOR SEGREGATION THROUGH
PRICES
Document Page
SECTOR WISE CONTRIBUTON
NYSE
(Source: Think Big, 2018).
ASX
(Source: Patersons, 2018).
tabler-icon-diamond-filled.svg

Paraphrase This Document

Need a fresh take? Get an instant paraphrase of this document with our AI Paraphraser
Document Page
The above image depicts the performance of Australian stock market since 2008.
it can be observed that after the financial crisis of 2008 the stock market crashed a
lot. Since 2010, it took a pace and improved itself. Whereas while looking at the
Australian Stock market since 1938 and after the oil crisis it boomed rapidly
(Kraft, Schwartz & Weiss, 2018).
PERFORMANCE ANALYSIS
NYSE
(Source: Think Big, 2018).
ASX
(Source: Patersons, 2018).
Document Page
DIVIDEND HISTORY
NYSE
(Source: Think Big, 2018).
ASX
(Source: Share Dividends, 2018).
Document Page
REFERENCES
A k a n s u , A . N . ( 2 0 1 7 ) . T h e f l a s h c r a s h : a r e v i e w. J o u r n a l o f C a p i t a l M a r k e t s S t u d i e s , 1 ( 1 ) , 8 9 - 1 0 0 .
A l l e n , D . E . , & R a c h i m , V. S . ( 2 0 1 6 ) . D i v i d e n d p o l i c y a n d s t o c k p r i c e v o l a t i l i t y : A u s t r a l i a n
e v i d e n c e . A p p l i e d f i n a n c i a l e c o n o m i c s , 6 ( 2 ) , 1 7 5 - 1 8 8 .
A S X . ( 2 0 1 8 ) . C o m p a n y I n f o r m a t i o n . R e t r i e v e d f r o m h t t p s : / / w w w. a s x . c o m . a u / p r i c e s / c o m p a n y -
i n f o r m a t i o n . h t m
A S X . ( 2 0 1 8 ) . T h e O f f i c i a l L i s t ( L i s t e d C o m p a n i e s ) R e t r i e v e d f r o m
h t t p s : / / w w w. a s x . c o m . a u / a s x / r e s e a r c h / l i s t e d C o m p a n i e s . d o
C h a t e a u , J . P. ( 2 0 1 7 ) . F u n d a m e n t a l a n a l y s i s : S t o c k v a l u a t i o n . N e w Yo r k : S p r i n g e r.
K r a f t , H . , S c h w a r t z , E . , & We i s s , F. ( 2 0 1 8 ) . G r o w t h o p t i o n s a n d f i r m v a l u a t i o n . E u ro p e a n
F i n a n c i a l M a n a g e m e n t , 2 4 ( 2 ) , 2 0 9 - 2 3 8 .
I n d e x M u n d i ( 2 0 1 8 ) . U n i t e d S t a t e s v s . A u s t r a l i a . R e t r i e v e d f r o m
h t t p s : / / w w w. i n d e x m u n d i . c o m / f a c t b o o k / c o m p a r e / u n i t e d - s t a t e s . a u s t r a l i a
P a t e r s o n s ( 2 0 1 8 ) . O v e r v i e w o f t h e A u s t r a l i a n S h a re M a r k e t . R e t r i e v e d f r o m
h t t p s : / / w w w. p s l . c o m . a u / We a l t h - M a n a g e m e n t / N e w s - I n s i g h t s / A r t i c l e - L i b r a r y / O v e r v i e w - o f - t h e -
A u s t r a l i a n - S h a r e - M a r k e t
P a u l , E . ( 2 0 1 8 ) . A u s t r a l i a i n t h e U S E m p i re : A S t u d y i n P o l i t i c a l R e a l i s m . N e w Yo r k : S p r i n g e r.
S h a r e D i v i d e n d s ( 2 0 1 8 ) . A u s t r a l i a n S h a re D i v i d e n d I n f o r m a t i o n R e s o u rc e . R e t r i e v e d F r o m
h t t p : / / w w w. s h a r e d i v i d e n d s . c o m . a u / F I X + d i v i d e n d + h i s t o r y
T h i n k B i g ( 2 0 1 8 ) . B e s p o k e I n v e s t m e n t g ro u p . R e t r i e v e d f r o m
h t t p : / / b e s p o k e i n v e s t . t y p e p a d . c o m / b e s p o k e / 2 0 0 8 / 0 7 / s p - 5 0 0 - d i v i d e n d . h t m
chevron_up_icon
1 out of 10
circle_padding
hide_on_mobile
zoom_out_icon
[object Object]